. 2023 May 19;9(20):eadf6757.
doi: 10.1126/sciadv.adf6757. Epub 2023 May 17.

Lighting up metastasis process before formation of secondary tumor by phosphorescence imaging

Affiliations

Lighting up metastasis process before formation of secondary tumor by phosphorescence imaging

Kai Chang et al. Sci Adv. .

Abstract

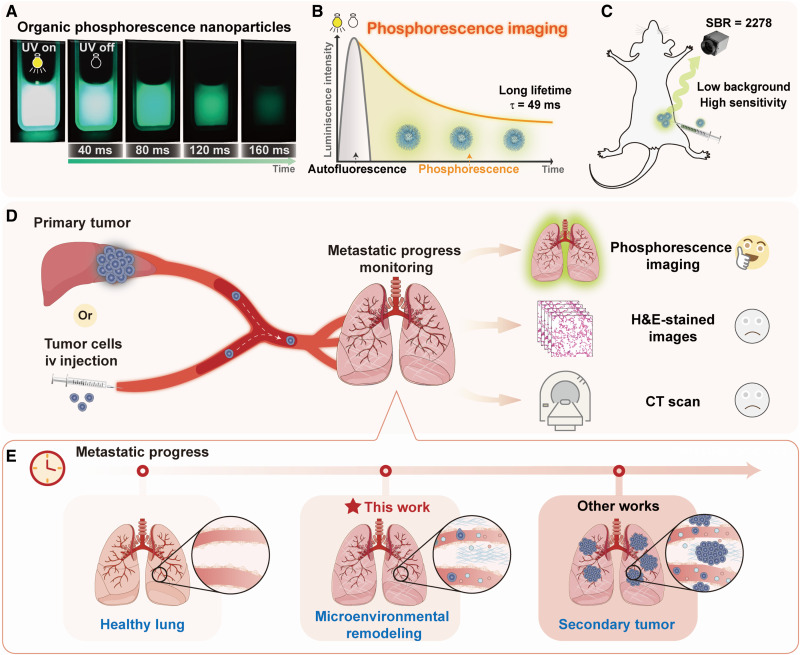
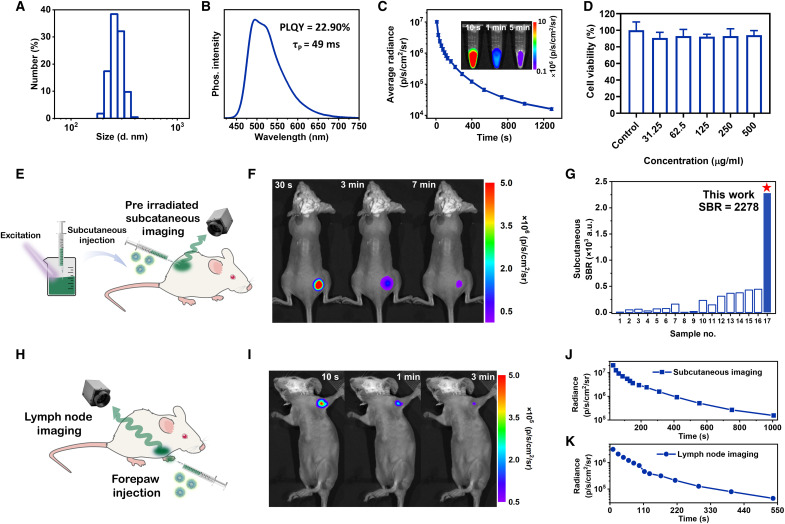
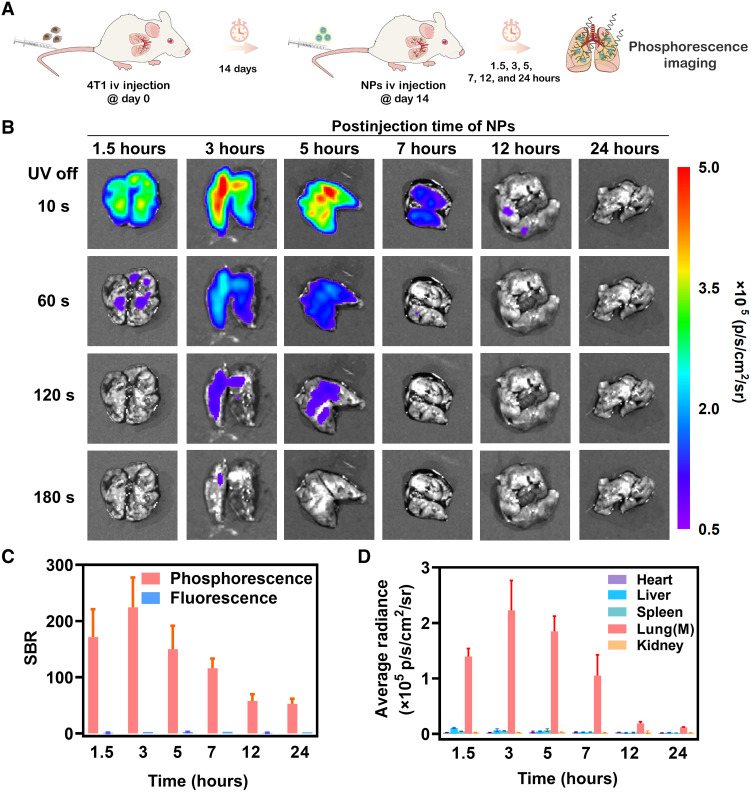
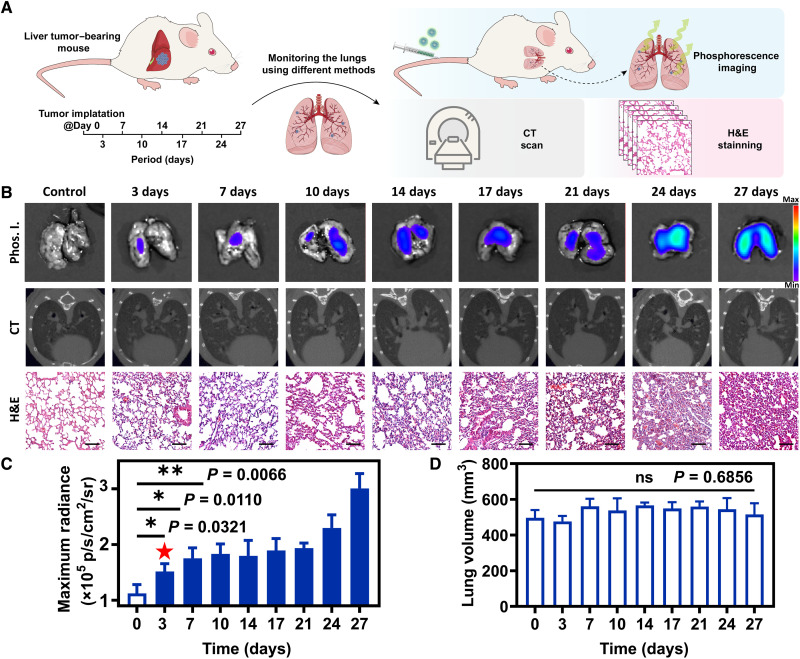
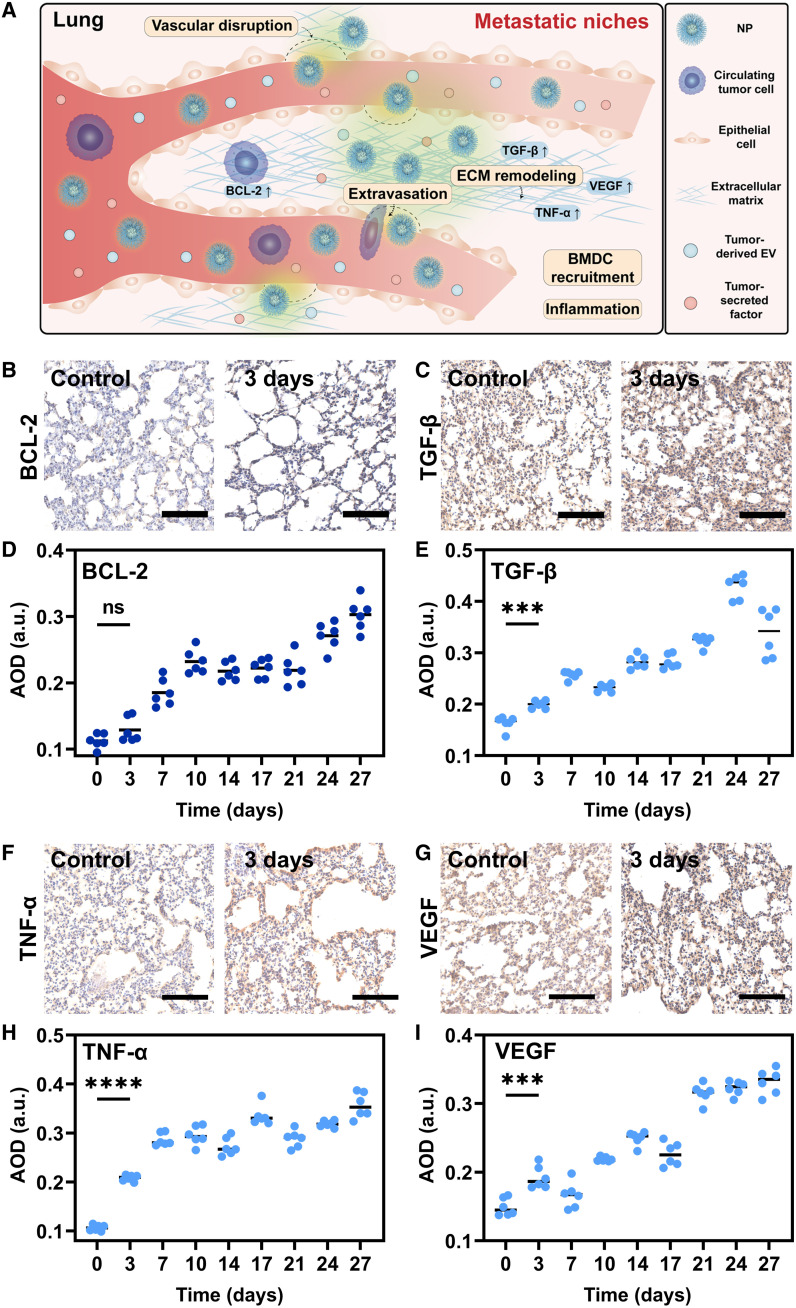
Metastasis is the leading cause of cancer-related deaths; until now, the detection of tumor metastasis is mainly located at the period that secondary tumors have been formed, which usually results in poor prognosis. Thus, fast and precise positioning of organs, where tumor metastases are likely to occur at its earliest stages, is essential for improving patient outcomes. Here, we demonstrated a phosphorescence imaging method by organic nanoparticles to detect early tumor metastasis progress with microenvironmental changes, putting the detection period ahead to the formation of secondary tumors. In the orthotopic and simulated hematological tumor metastasis models, the microenvironmental changes could be recognized by phosphorescence imaging at day 3, after tumor implantation in liver or intravenous injection of cancer cells. It was far ahead those of other reported imaging methods with at least 7 days later, providing a sensitive and convenient method to monitor tumor metastases at the early stage.


Figures

Fig. 1.
Fig. 1.. Detection of tumor metastasis processes using pure organic phosphorescence imaging.
(A) Photograph of pure organic phosphorescence NPs with ultrabright and persistent afterglow. (B) The schematic diagram of phosphorescence imaging, which can shield the autofluorescence for long lifetime. (C) The high SBR of phosphorescence NPs in in vivo imaging of living mice. (D) Metastatic progress from liver to lung or simulated by intravenous (iv) injection of tumor cells and detection of metastatic progress in lung by organic phosphorescence imaging, H&E-stained images, and CT scan. (E) Detailed tumor metastatic progress in lung with the passage of time, and the microenvironmental remodeling of metastatic progress can be recognized by phosphorescence imaging, far ahead of other works at secondary tumor stage.
Fig. 2.
Fig. 2.. Characterization, preirradiated subcutaneous imaging, and lymph nodes imaging of phosphorescence NPs.
(A) Sizes and distribution of phosphorescence NPs by dynamic light scattering. (B) Phosphorescence spectrum, PLQY, and phosphorescence lifetime of NPs. (C) Time-dependent phosphorescence decay of NPs recorded after turning off the light irradiation, acquired using an IVIS instrument in bioluminescent mode. Inset: Phosphorescence images of NPs (4 mg ml−1) with lasting times of 10 s, 1 min, and 5 min. (D) The viability of H22 cancer cells with the incorporation of NPs in different concentrations (n = 3; means ± SD). (E) Schematic diagram of preirradiated subcutaneous in vivo imaging of living mice. (F) Phosphorescence bioimaging of mice by subcutaneous injection of preirradiated NPs at lasting times of 30 s, 3 min, and 7 min using an IVIS instrument in bioluminescent mode (n = 3). (G) SBR of subcutaneous imaging by pure organic RTP materials reported in literatures and our work. Detailed sample names can be found in table S2. (H) Schematic diagram of lymph node imaging by forepaw injection of RTP NPs. (I) Phosphorescence bioimaging of mice after removal of light irradiation at t = 10 s, t = 1 min, and t = 3 min using an IVIS instrument in bioluminescent mode (n = 3). (J and K) Time-dependent phosphorescence decay of preirradiated subcutaneous imaging (J) and lymph nodes imaging (K) (n = 3). a.u., arbitrary units.
Fig. 3.
Fig. 3.. Phosphorescence imaging in lung metastases model by intravenous injection of 4T1 cancer cells after 14 days.
(A) Schematic diagram of establishment of lung metastatic mouse model and the following phosphorescence imaging. (B) Time-resolved phosphorescence imaging of isolated lungs from mice bearing 4T1 metastatic tumors at 1.5, 3, 5, 7, 12, and 24 hours postintravenous injection of NPs, after removal of light irradiation at t = 10 s, t = 60 s, t = 120 s, and t = 180 s using an IVIS instrument in bioluminescent mode (n = 3; means ± SD). (C) SBR of isolated lungs from mice bearing 4T1 metastatic tumors at 1.5, 3, 5, 7, 12, and 24 hours postintravenous injection of NPs after removal of light irradiation at t = 10 s (n = 3; means ± SD). (D) Average radiance of isolated organs (hearts, livers, spleens, lungs, and kidneys) from mice bearing 4T1 metastatic tumors at 1.5, 3, 5, 7, 12, and 24 hours postintravenous injection of NPs after removal of light irradiation at t = 10 s (n = 3; means ± SD).
Fig. 4.
Fig. 4.. Detection of tumor metastatic processes by phosphorescence imaging.
(A) Schematic diagram of in situ implantation of liver tumor and detection of microenvironmental changes in lungs by phosphorescence imaging, CT scan, and pathological sections. (B) Phosphorescence imaging (Phos. I.), CT images, and H&E-stained images of metastatic lungs from day 0 to day 27. Scale bars, 100 μm. (C) Maximum radiance of phosphorescence imaging of lungs from day 0 to day 27 (n = 3). (D) Lung volume of lungs from day 0 today 27 calculated by Analyze 14.0 software (n = 3; means ± SD). ns, not significant, *P < 0.05, and **P < 0.01.
Fig. 5.
Fig. 5.. IHC analysis.
(A) Schematic diagram of metastatic niches. (B, C, F, and G) IHC staining of Bcl-2 (B), TGF-β (C), TNF-α (F), and VEGF (G) of metastatic lungs on day 0 and day 3 (n = 3). Scale bars, 100 μm. (D, E, H, and I) AOD of the corresponding IHC-stained images calculated by ImageJ software: Bcl-2 (D), TGF-β (E), TNF-α (H), and VEGF (I) (n = 6). ns, not significant, ***P < 0.001, and ****P < 0.0001.

References

    1. Siegel R. L., Miller K. D., Fuchs H. E., Jemal A., Cancer statistics, 2021. CA Cancer J. Clin. 71, 7–33 (2021). - PubMed
    1. Valastyan S., Weinberg R. A., Tumor metastasis: Molecular insights and evolving paradigms. Cell 147, 275–292 (2011). - PMC - PubMed
    1. Massague J., Obenauf A. C., Metastatic colonization by circulating tumour cells. Nature 529, 298–306 (2016). - PMC - PubMed
    1. Yu W., Hu C., Gao H., Advances of nanomedicines in breast cancer metastasis treatment targeting different metastatic stages. Adv. Drug Deliv. Rev. 178, 113909 (2021). - PubMed
    1. Steeg P. S., Targeting metastasis. Nat. Rev. Cancer 16, 201–218 (2016). - PMC - PubMed