. 2024 Aug 1;15(4):1899-1912.
doi: 10.14336/AD.2022.1210.

Edge Density Imaging Identifies White Matter Biomarkers of Late-Life Obesity and Cognition

Affiliations

Edge Density Imaging Identifies White Matter Biomarkers of Late-Life Obesity and Cognition

Maxwell Bond Wang et al. Aging Dis. .

Abstract

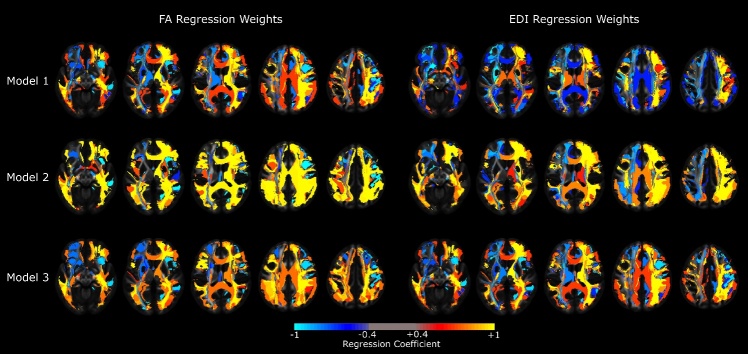
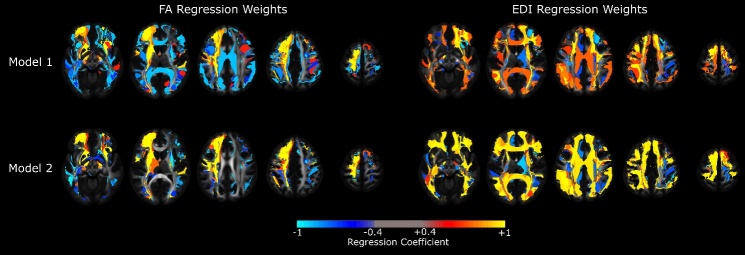
Alzheimer disease (AD) and obesity are related to disruptions in the white matter (WM) connectome. We examined the link between the WM connectome and obesity and AD through edge-density imaging/index (EDI), a tractography-based method that characterizes the anatomical embedding of tractography connections. A total of 60 participants, 30 known to convert from normal cognition or mild-cognitive impairment to AD within a minimum of 24 months of follow up, were selected from the Alzheimer disease Neuroimaging Initiative (ADNI). Diffusion-weighted MR images from the baseline scans were used to extract fractional anisotropy (FA) and EDI maps that were subsequently averaged using deterministic WM tractography based on the Desikan-Killiany atlas. Multiple linear and logistic regression analysis were used to identify the weighted sum of tract-specific FA or EDI indices that maximized correlation to body-mass-index (BMI) or conversion to AD. Participants from the Open Access Series of Imaging Studies (OASIS) were used as an independent validation for the BMI findings. The edge-density rich, periventricular, commissural and projection fibers were among the most important WM tracts linking BMI to FA as well as to EDI. WM fibers that contributed significantly to the regression model related to BMI overlapped with those that predicted conversion; specifically in the frontopontine, corticostriatal, and optic radiation pathways. These results were replicated by testing the tract-specific coefficients found using ADNI in the OASIS-4 dataset. WM mapping with EDI enables identification of an abnormal connectome implicated in both obesity and conversion to AD.


Conflict of interest statement

Conflict of interest

The authors report no conflict of interest.

Figures

Figure 1.
Figure 1.
Color-coded map of weights from regression models predicting BMI using tract-specific FA or EDI values. Footnote: Colors reflect the sign and magnitude of the coefficient of each WM tract in each model. Model 1 included the FA/EDI values only, while Model 2 incorporated age, sex and years of education, and Model 3 additionally included conversion status to AD in the prediction vector. Abbreviations: FA: fractional anisotropy; EDI: edge-density imaging index; BMI: body-mass index
Figure 2.
Figure 2.
Performance of the regression model is demonstrated as the relationship between the regression metric and BMI. Footnote: Statistics in each model are demonstrated as the Bartlett’s chi-square and p-value. The performance of the EDI to BMI model in an external dataset is shown in the bottom-left and evaluated using Pearson’s correlation. Abbreviations: FA: fractional anisotropy; EDI: edge-density imaging index; BMI: body-mass index; df; degree of freedom, χ2: Chi-square
Figure 3.
Figure 3.
Color-coded map of coefficient weights from regression models predicting conversion to AD using tract-specific FA or EDI values. Footnote: Colors reflect the sign and magnitude of the coefficient of each WM tract in each model. Model 1 included the FA/EDI index values only, while Model 2 incorporated age, sex and years of education in the prediction vector. Abbreviations: FA: fractional anisotropy; EDI: edge-density imaging index; AD: Alzheimer disease
Figure 4.
Figure 4.
Performance of the converter model is demonstrated as the relationship between the regression metric and conversion status. Footnote: Statistics in each model are demonstrated as the Bartlett’s chi-square and p-value. Abbreviations: FA: fractional anisotropy; EDI: edge-density imaging index; df; degree of freedom, χ2: Chi-square

References

    1. Miller AA, Spencer SJ (2014). Obesity and neuroinflammation: a pathway to cognitive impairment. Brain Behav Immun, 42:10-21. - PubMed
    1. Guillemot-Legris O, Muccioli GG (2017). Obesity-Induced Neuroinflammation: Beyond the Hypothalamus. Trends Neurosci, 40:237-253. - PubMed
    1. Ly M, Raji CA, Yu GZ, Wang Q, Wang Y, Schindler SE, et al.. (2021). Obesity and White Matter Neuroinflammation Related Edema in Alzheimer’s Disease Dementia Biomarker Negative Cognitively Normal Individuals. J Alzheimers Dis, 79:1801-1811. - PMC - PubMed
    1. Isaac V, Sim S, Zheng H, Zagorodnov V, Tai E-S, Chee M (2011). Adverse Associations between Visceral Adiposity, Brain Structure, and Cognitive Performance in Healthy Elderly. Front. Aging Neurosci, 3:12. - PMC - PubMed
    1. Anand SS, Friedrich MG, Lee DS, Awadalla P, Després JP, Desai D, et al.. (2022). Evaluation of Adiposity and Cognitive Function in Adults. JAMA Netw open, 5: e2146324. - PMC - PubMed

LinkOut - more resources