. 2023 May 16;4(5):101036.
doi: 10.1016/j.xcrm.2023.101036.

Preclinical characterization of the Toll-like receptor 7/8 antagonist MHV370 for lupus therapy

Affiliations

Preclinical characterization of the Toll-like receptor 7/8 antagonist MHV370 for lupus therapy

Stuart Hawtin et al. Cell Rep Med. .

Abstract

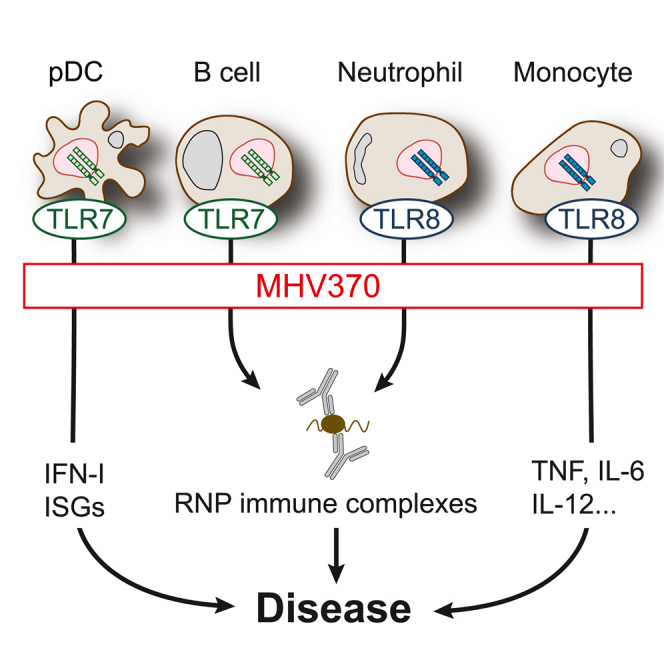
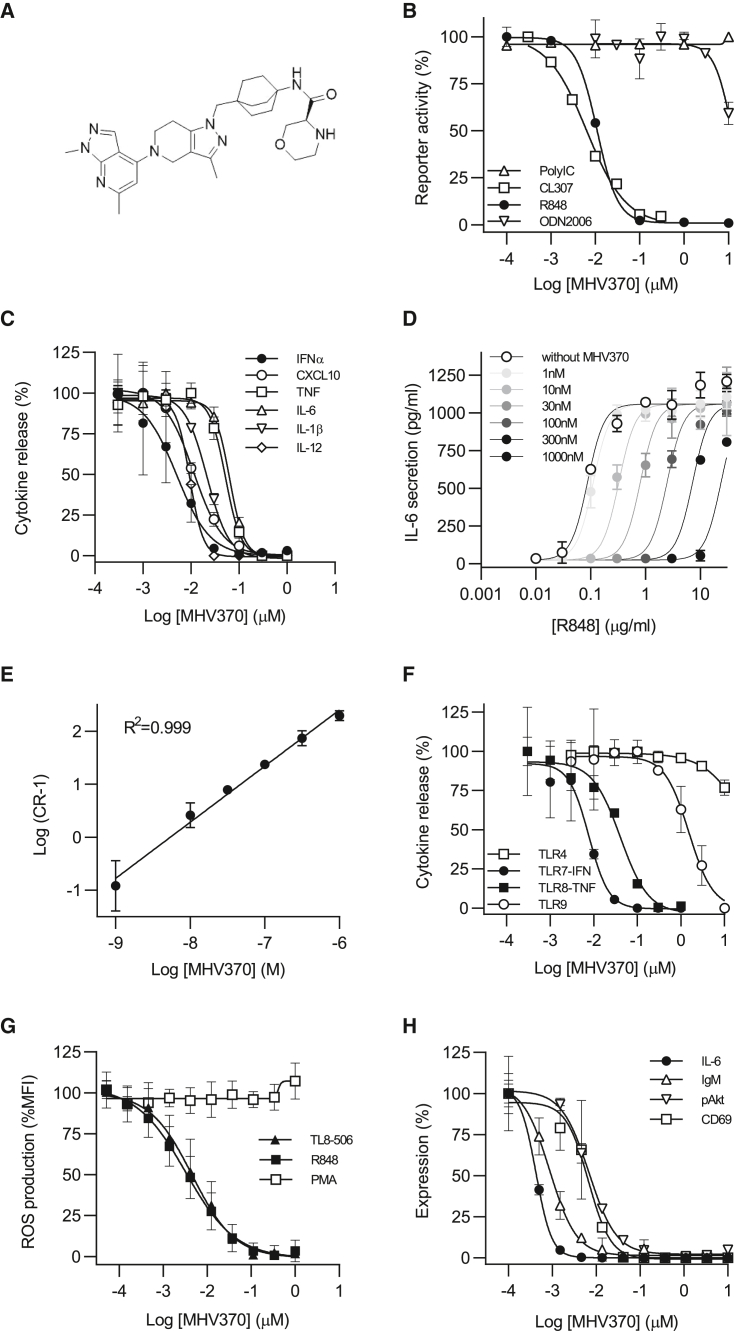
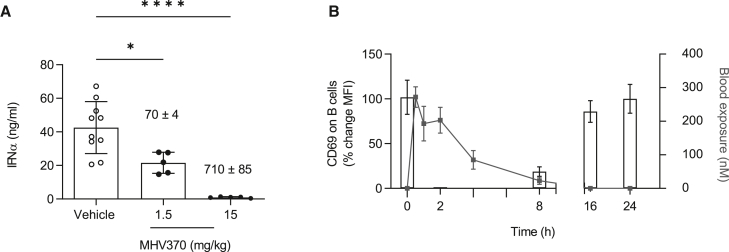
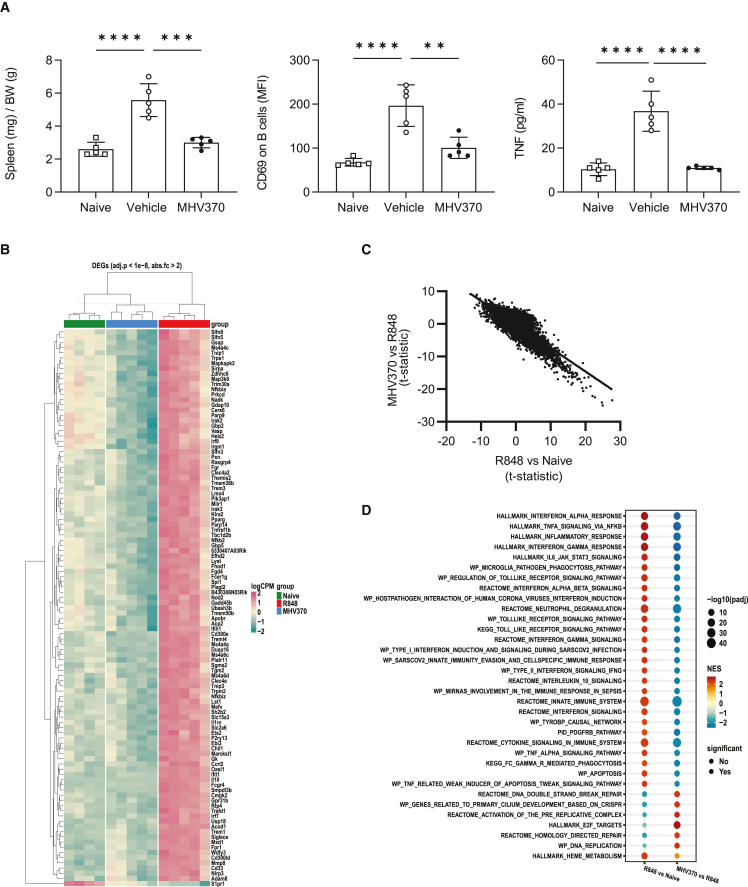
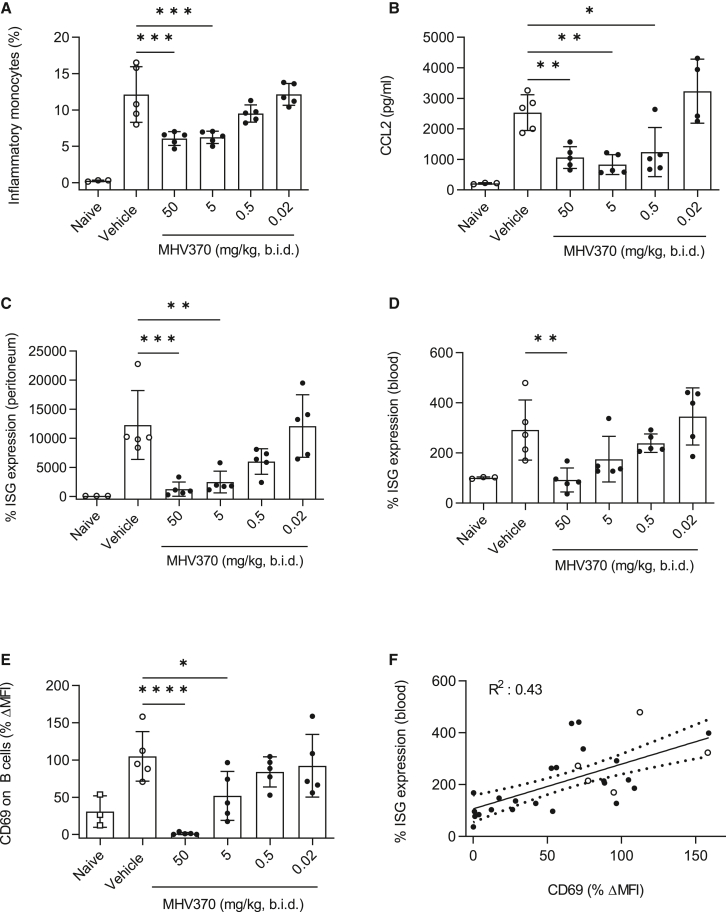
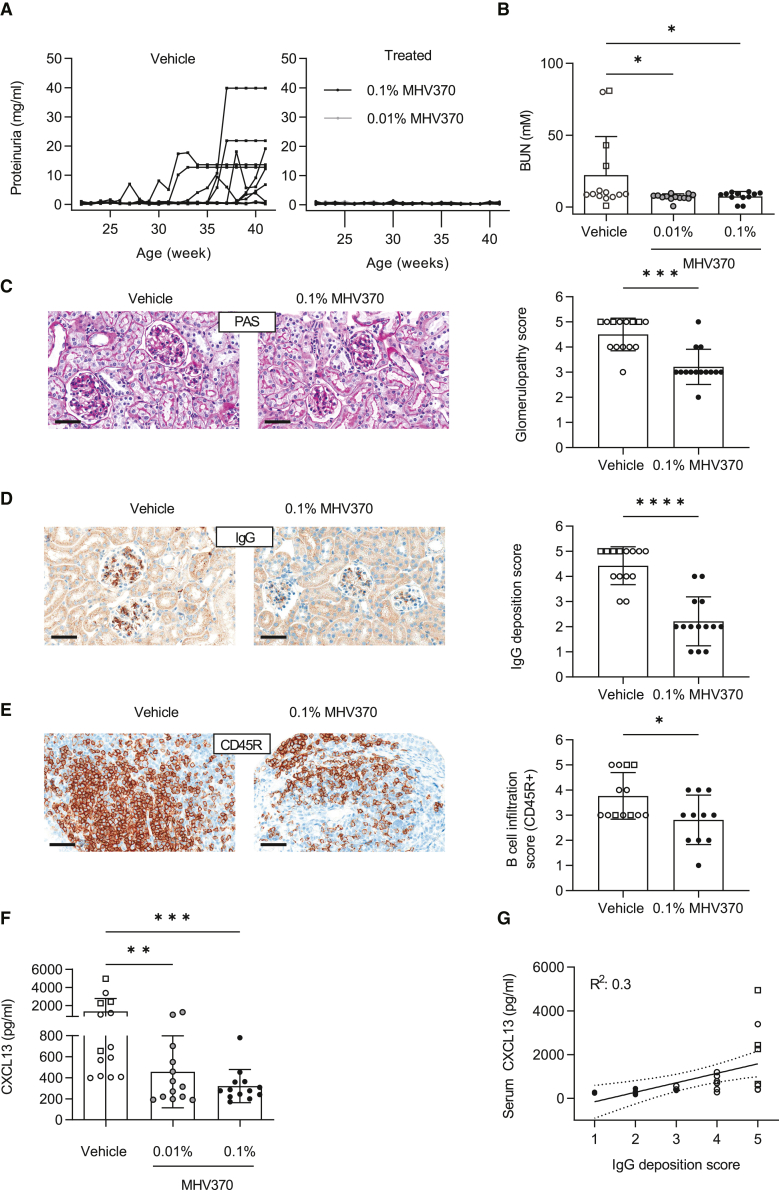
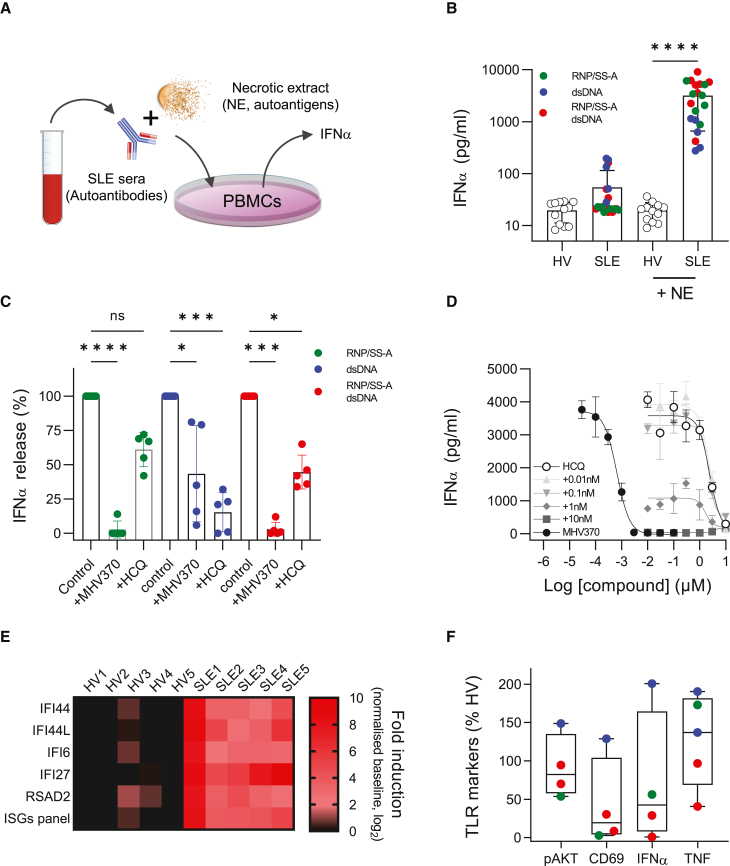
Genetic and in vivo evidence suggests that aberrant recognition of RNA-containing autoantigens by Toll-like receptors (TLRs) 7 and 8 drives autoimmune diseases. Here we report on the preclinical characterization of MHV370, a selective oral TLR7/8 inhibitor. In vitro, MHV370 inhibits TLR7/8-dependent production of cytokines in human and mouse cells, notably interferon-α, a clinically validated driver of autoimmune diseases. Moreover, MHV370 abrogates B cell, plasmacytoid dendritic cell, monocyte, and neutrophil responses downstream of TLR7/8. In vivo, prophylactic or therapeutic administration of MHV370 blocks secretion of TLR7 responses, including cytokine secretion, B cell activation, and gene expression of, e.g., interferon-stimulated genes. In the NZB/W F1 mouse model of lupus, MHV370 halts disease. Unlike hydroxychloroquine, MHV370 potently blocks interferon responses triggered by specific immune complexes from systemic lupus erythematosus patient sera, suggesting differentiation from clinical standard of care. These data support advancement of MHV370 to an ongoing phase 2 clinical trial.

Keywords: Toll-like receptors; antagonist; autoimmunity; innate immunity; lupus; pharmacology.


Conflict of interest statement

Declaration of interests All authors except S.A., B.B., H.I.B., J.D., D.K., P.M., F.R., and J.S.R. are current employees and shareholders of Novartis Pharma AG. MHV370 is described in patent WO2018047081.

Figures

None
Graphical abstract
Figure 1
Figure 1
MHV370 inhibits TLR7/8-specific activation of human cells (A) Structure of MHV370. (B) Reporter gene activity in Ramos B cells stimulated with agonists for TLR3 (polyIC), TLR7 (CL307), TLR7/8 (R848), or TLR9 (ODN2006), representative of two (TLR7) or four (TLR3, TLR7/8, and TLR9) independent experiments. (C) ssRNA-mediated pro-inflammatory cytokine release from PBMCs. (D and E) (D) R848-stimulated IL-6 release from human PBMCs with increasing fixed concentrations of MHV370, one representative of two experiments and (E) Schild plot analysis of (D), means of two experiments ± SD. (F) IFN-α (TLR7/ssRNA, TLR9/ODN2216-driven) or TNF (TLR4/LPS, TLR8/ssRNA-driven) release from human blood. (G) R848 (TLR7/8)-, TL8-506 (TLR8)-, or PMA-mediated ROS secretion from neutrophils; means of 8, 6, and 6 donors ± SD, respectively. (H) B cell activation markers following activation with R848. (C), (F) and (H) show data from one out of n donors (for n see Tables 1, S3, and S4). Data are standardized to conditions without MHV370, and data points are means of two (B, F, H) or three (C, D) technical replicates ± SD. See also Figure S2.
Figure 2
Figure 2
MHV370 suppresses acute TLR7-dependent immune activation in mice (A) TLR7/ssRNA-induced IFN-α in mouse plasma. MHV370 levels in blood are indicated above the bars (nM ± SD). Pooled data from two independent experiments, means ± SD. Data points represent individual mice. ∗p < 0.05, ∗∗∗∗p < 0.0001, ANOVA with Tukey’s post test. (B) Expression of CD69 on B cells after ex vivo stimulation of blood with R848 (bars) and MHV370 exposures (gray line) following 5 mg/kg MHV370 orally. Means ± SD of five mice. See also Figure S3.
Figure 3
Figure 3
MHV370 suppresses chronic TLR7-dependent immune activation in mice (A) Spleen weight, CD69 expression on B cells, and TNF in serum. Data points represent individual mice with means ± SD. ∗∗p < 0.01, ∗∗∗p < 0.001; ∗∗∗∗p < 0.0001, ANOVA with Tukey’s post test. (B) Scaled and normalized log counts per million of the most significant genes (adjusted p value <1e−8, absolute fold change >2) differentially expressed in naive mice (green horizontal bar), R848/MHV370-treated (blue), and R848/vehicle-treated (red) mice. Hierarchical clustering of genes and samples after grouping of samples by experimental group. (C) Anti-correlation of global gene expression changes in mice treated with R848/vehicle compared with naive mice (x axis) vs. mice treated with R848/MHV370 compared with R848/vehicle-treated mice (y axis). Data points represent values for individual genes, line represents linear fit to the data (Pearson correlation coefficient = −0.8, p value <2.2e−16). (D) Gene set enrichment analysis of the R848/vehicle vs. naive and the R848/MHV370 vs. R848/vehicle comparisons using the Hallmark and C2 Canonical Pathways gene set collections from MSigDB. Red, upregulated pathways; blue, downregulated pathways. The size of each circle is proportional to −log10 of the adjusted p value obtained in the enrichment test (−log10(padj)). Full circles, terms with padj < 0.01; empty circles, terms with padj > 0.01. See also Figure S3.
Figure 4
Figure 4
In vivo efficacy of MHV370 in the TMPD peritonitis model (A and B) Frequencies of (A) CD11b+Ly6C+ inflammatory monocytes and (B) CCL2 levels in peritoneal lavages. (C and D) Expression of ISGs (C) in peritoneal cells and (D) in blood cells. ISG expression was standardized to expression in naive mice with each ISG measured in triplicate. (E) CD69 expression on B cells from blood following ex vivo stimulation with R848. (F) Correlation of data from (D) and (E) for individual mice; dotted line, 95% confidence interval. Open symbols represent vehicle-treated mice. Data points in (A) to (E) represent individual mice, means ± SD. ∗p < 0.05, ∗∗p < 0.01, ∗∗∗p < 0.001; ∗∗∗∗p < 0.0001, ANOVA with Dunnett’s post test, comparing MHV370 groups with vehicle group.
Figure 5
Figure 5
In vivo efficacy of MHV370 in the NZB/W F1 lupus model (A) Proteinuria. Lines represent individual mice. (B) BUN levels at termination. ∗p < 0.05, ANOVA with Dunnett’s post test. (C) Kidney histopathology and glomerulopathy score. (D) IgG deposition in kidneys and score. (E) B cell infiltration in kidneys and score. (F) CXCL13 protein levels in serum at termination. ∗∗p < 0.01, ∗∗∗p < 0.001, ANOVA with Dunnett’s post test. (G) Correlation of CXCL13 levels in serum with glomerular IgG deposition; dotted line, 95% confidence interval. In (B) to (G), data points represent individual mice, in (B) to (F), means ± SD. Open symbols, vehicle-treated mice; open squares, vehicle-treated mice which were terminated prematurely as they reached the humane endpoint of the license. In (C) to (E), ∗p < 0.05, ∗∗∗p < 0.001, ∗∗∗∗p < 0.0001, Mann-Whitney test. Scale bars, 50 μm. See also Figures S4–S6.
Figure 6
Figure 6
MHV370 inhibits SLE patient sera immune-complex-driven responses and ex vivo blood pathway markers in SLE patients (A) Schematic illustration of the functional immune-complex assay using SLE patient serum. (B) IFN-α release from PBMCs stimulated by immune complexes of healthy volunteer (HV) or SLE patient sera with and without necrotic extract (NE). Data points represent individual HV sera (n = 12) or SLE patient sera (n = 20), as means from 2 to 23 PBMC stimulations, and three technical replicates per stimulation. Bars denote means ± SD. Colors indicate autoantibody profiles of individual SLE patients. (C) Normalized IFN-α release from PBMCs stimulated with SLE immune complexes in presence of medium, MHV370 (0.3 μM) or HCQ (1 μM). Data points are means of individual SLE patient sera (n = 5), with 2–10 PBMC stimulations per serum, and three technical replicates per stimulation. Bars denote means ± SD. (D) IFN-α release from PBMCs stimulated with immune complexes from an SLE patient (positive for RNP/Sm and dsDNA) in the presence of MHV370 (filled circles), HCQ (open circles), and HCQ in the presence of increasing fixed amounts of MHV370 (gray symbols), as indicated. Means ± SD, one representative of two experiments. (E) Expression of individual ISGs (performed in triplicate) and a five-gene ISG signature in blood of five individual HV and SLE patients. (F) Marker expression in blood of individual SLE patients (n = 4 or 5), following ex vivo stimulation with R848 (pAKT, CD69, TNF) or ssRNA (IFN-α), normalized to matched HV blood. In (B) and (C), data points are means of at least two technical replicates. ns, not significant; ∗p < 0.05, ∗∗∗p < 0.001, ∗∗∗∗p < 0.0001, ANOVA with (B) Tukey’s or (C) Kruskal-Wallis post test. See also Figure S7.

Similar articles

Cited by

References

    1. Junt T., Barchet W. Translating nucleic acid-sensing pathways into therapies. Nat. Rev. Immunol. 2015;15:529–544. - PubMed
    1. Lee Y.H., Choi S.J., Ji J.D., Song G.G. Association between toll-like receptor polymorphisms and systemic lupus erythematosus: a meta-analysis update. Lupus. 2016;25:593–601. - PubMed
    1. García-Ortiz H., Velázquez-Cruz R., Espinosa-Rosales F., Jiménez-Morales S., Baca V., Orozco L. Association of TLR7 copy number variation with susceptibility to childhood-onset systemic lupus erythematosus in Mexican population. Ann. Rheum. Dis. 2010;69:1861–1865. - PubMed
    1. Souyris M., Cenac C., Azar P., Daviaud D., Canivet A., Grunenwald S., Pienkowski C., Chaumeil J., Mejía J.E., Guéry J.C. TLR7 escapes X chromosome inactivation in immune cells. Sci. Immunol. 2018;3:eaap8855. - PubMed
    1. Lyn-Cook B.D., Xie C., Oates J., Treadwell E., Word B., Hammons G., Wiley K. Increased expression of Toll-like receptors (TLRs) 7 and 9 and other cytokines in systemic lupus erythematosus (SLE) patients: ethnic differences and potential new targets for therapeutic drugs. Mol. Immunol. 2014;61:38–43. - PubMed

Publication types