. 2023 Jul 5;111(13):2076-2090.e9.
doi: 10.1016/j.neuron.2023.04.015. Epub 2023 May 16.

Hippocampo-cortical circuits for selective memory encoding, routing, and replay

Affiliations

Hippocampo-cortical circuits for selective memory encoding, routing, and replay

Ryan E Harvey et al. Neuron. .

Abstract

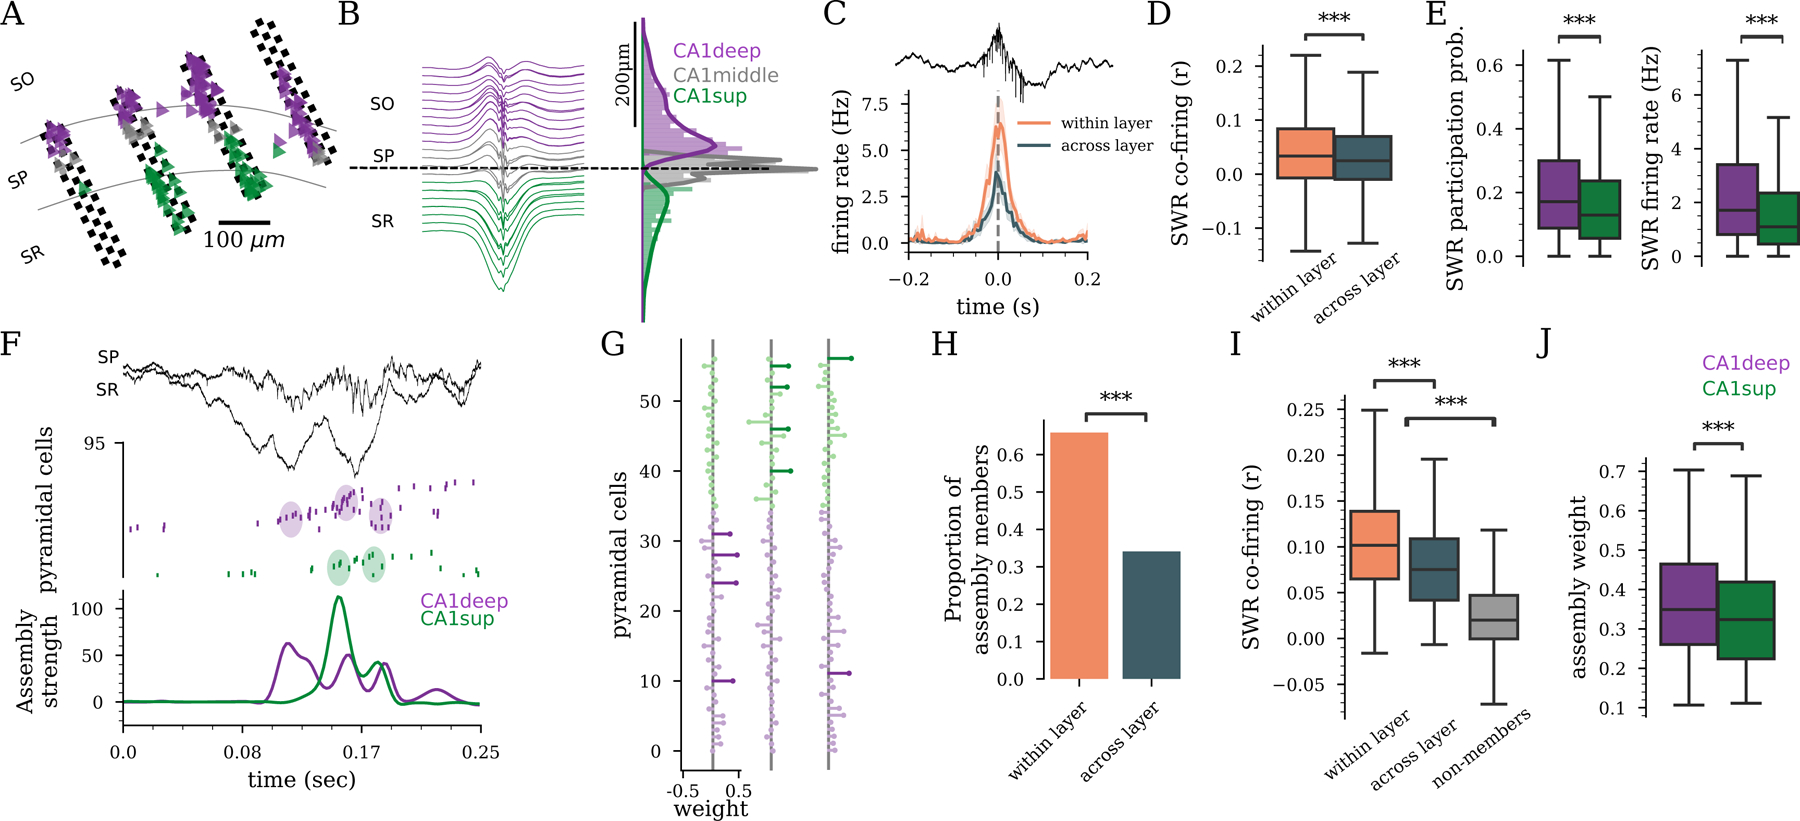
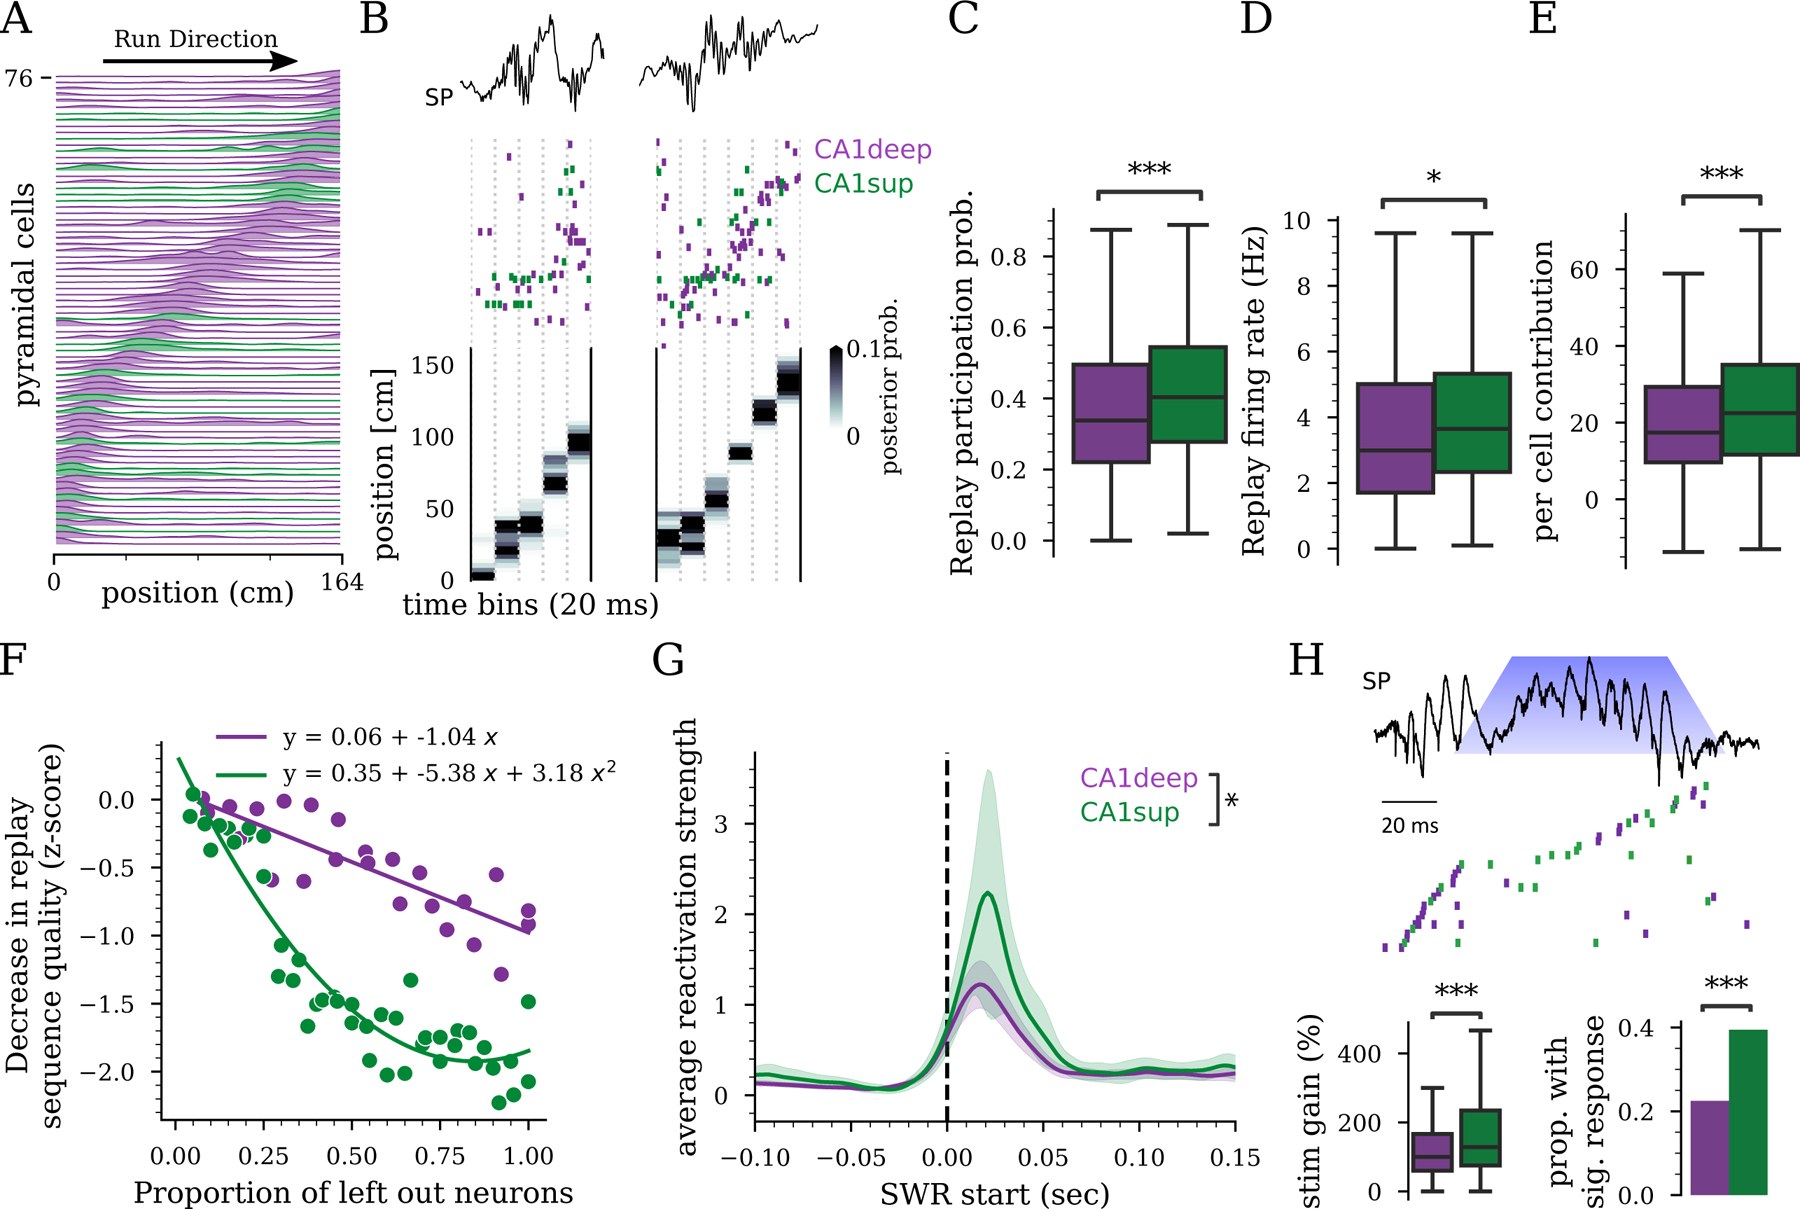
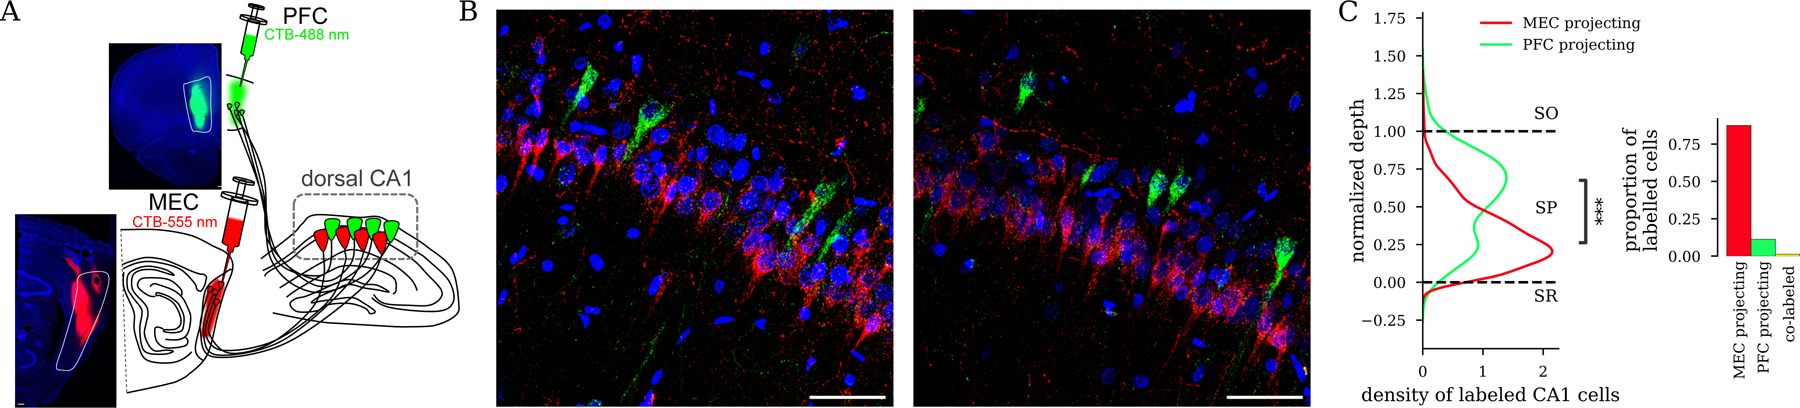
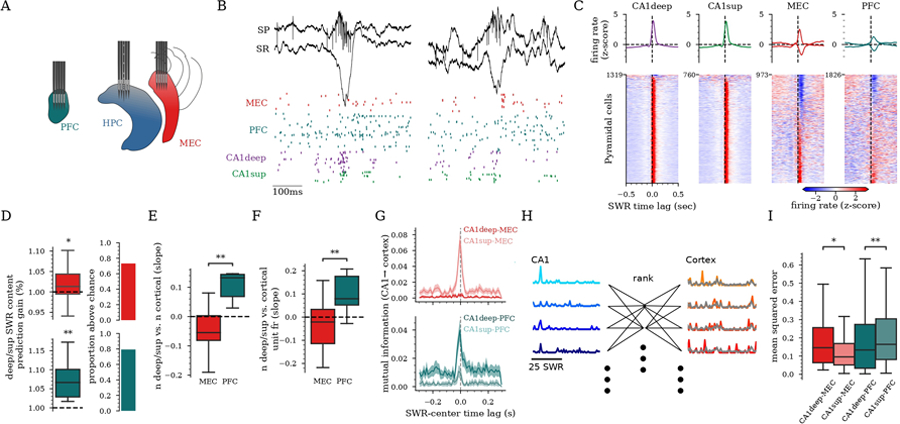
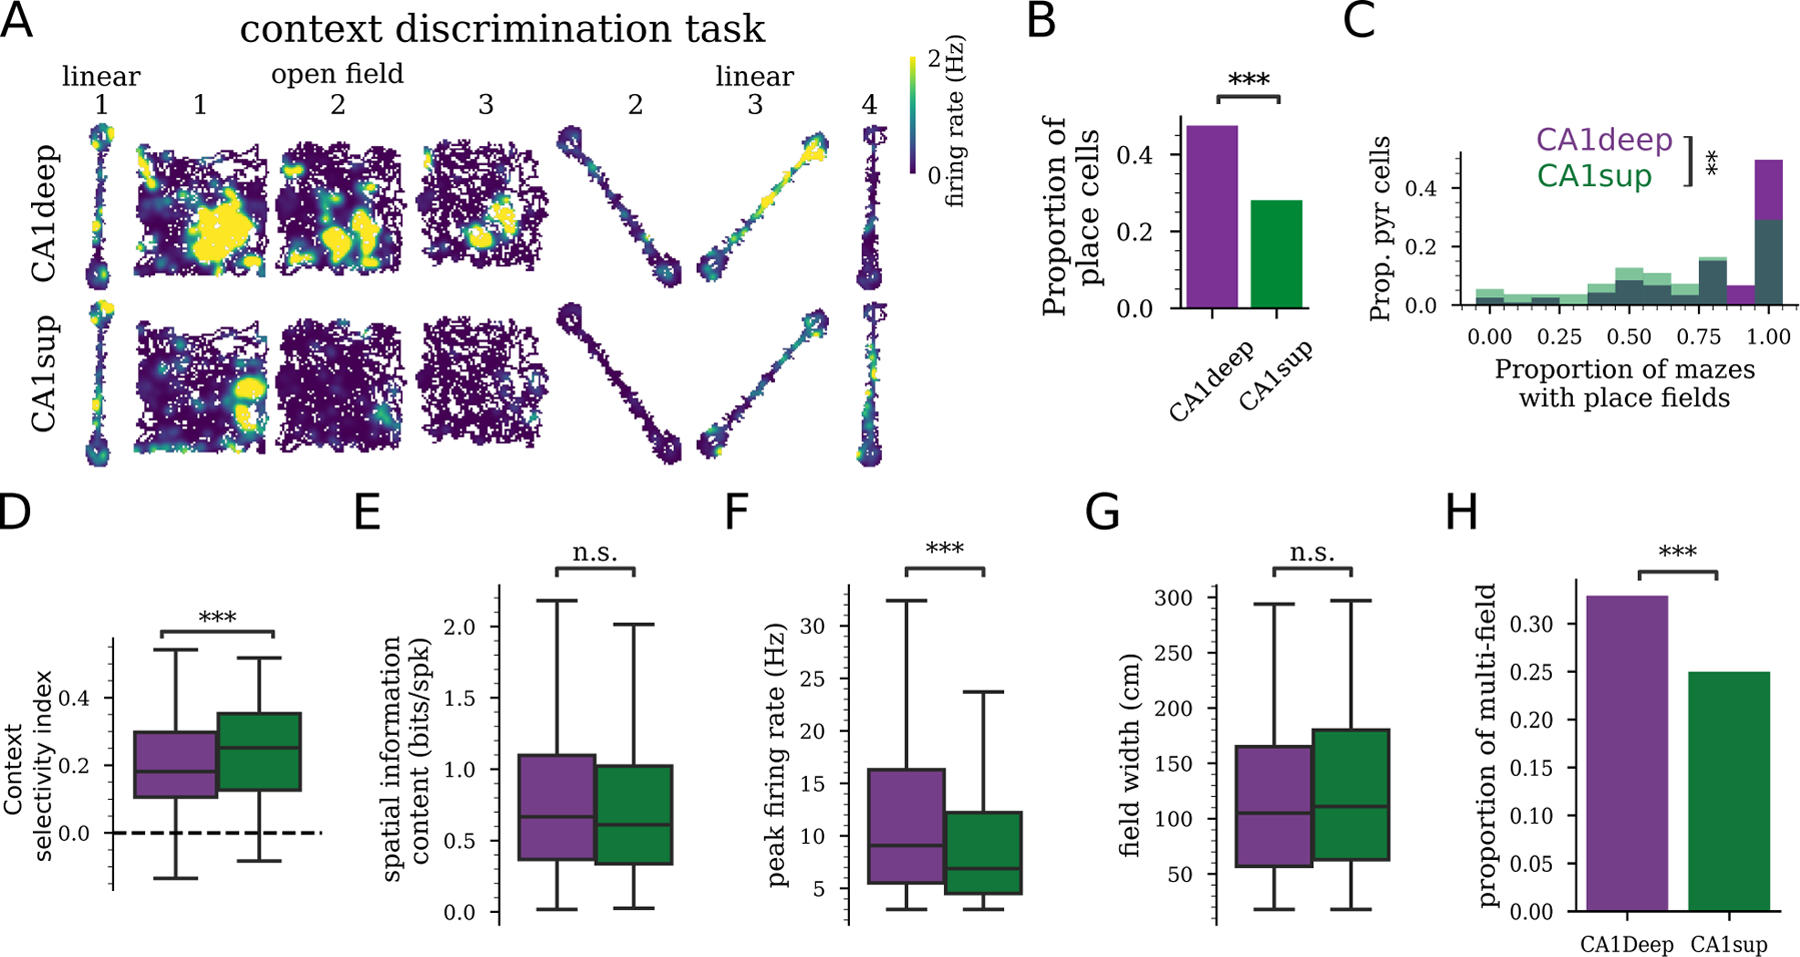
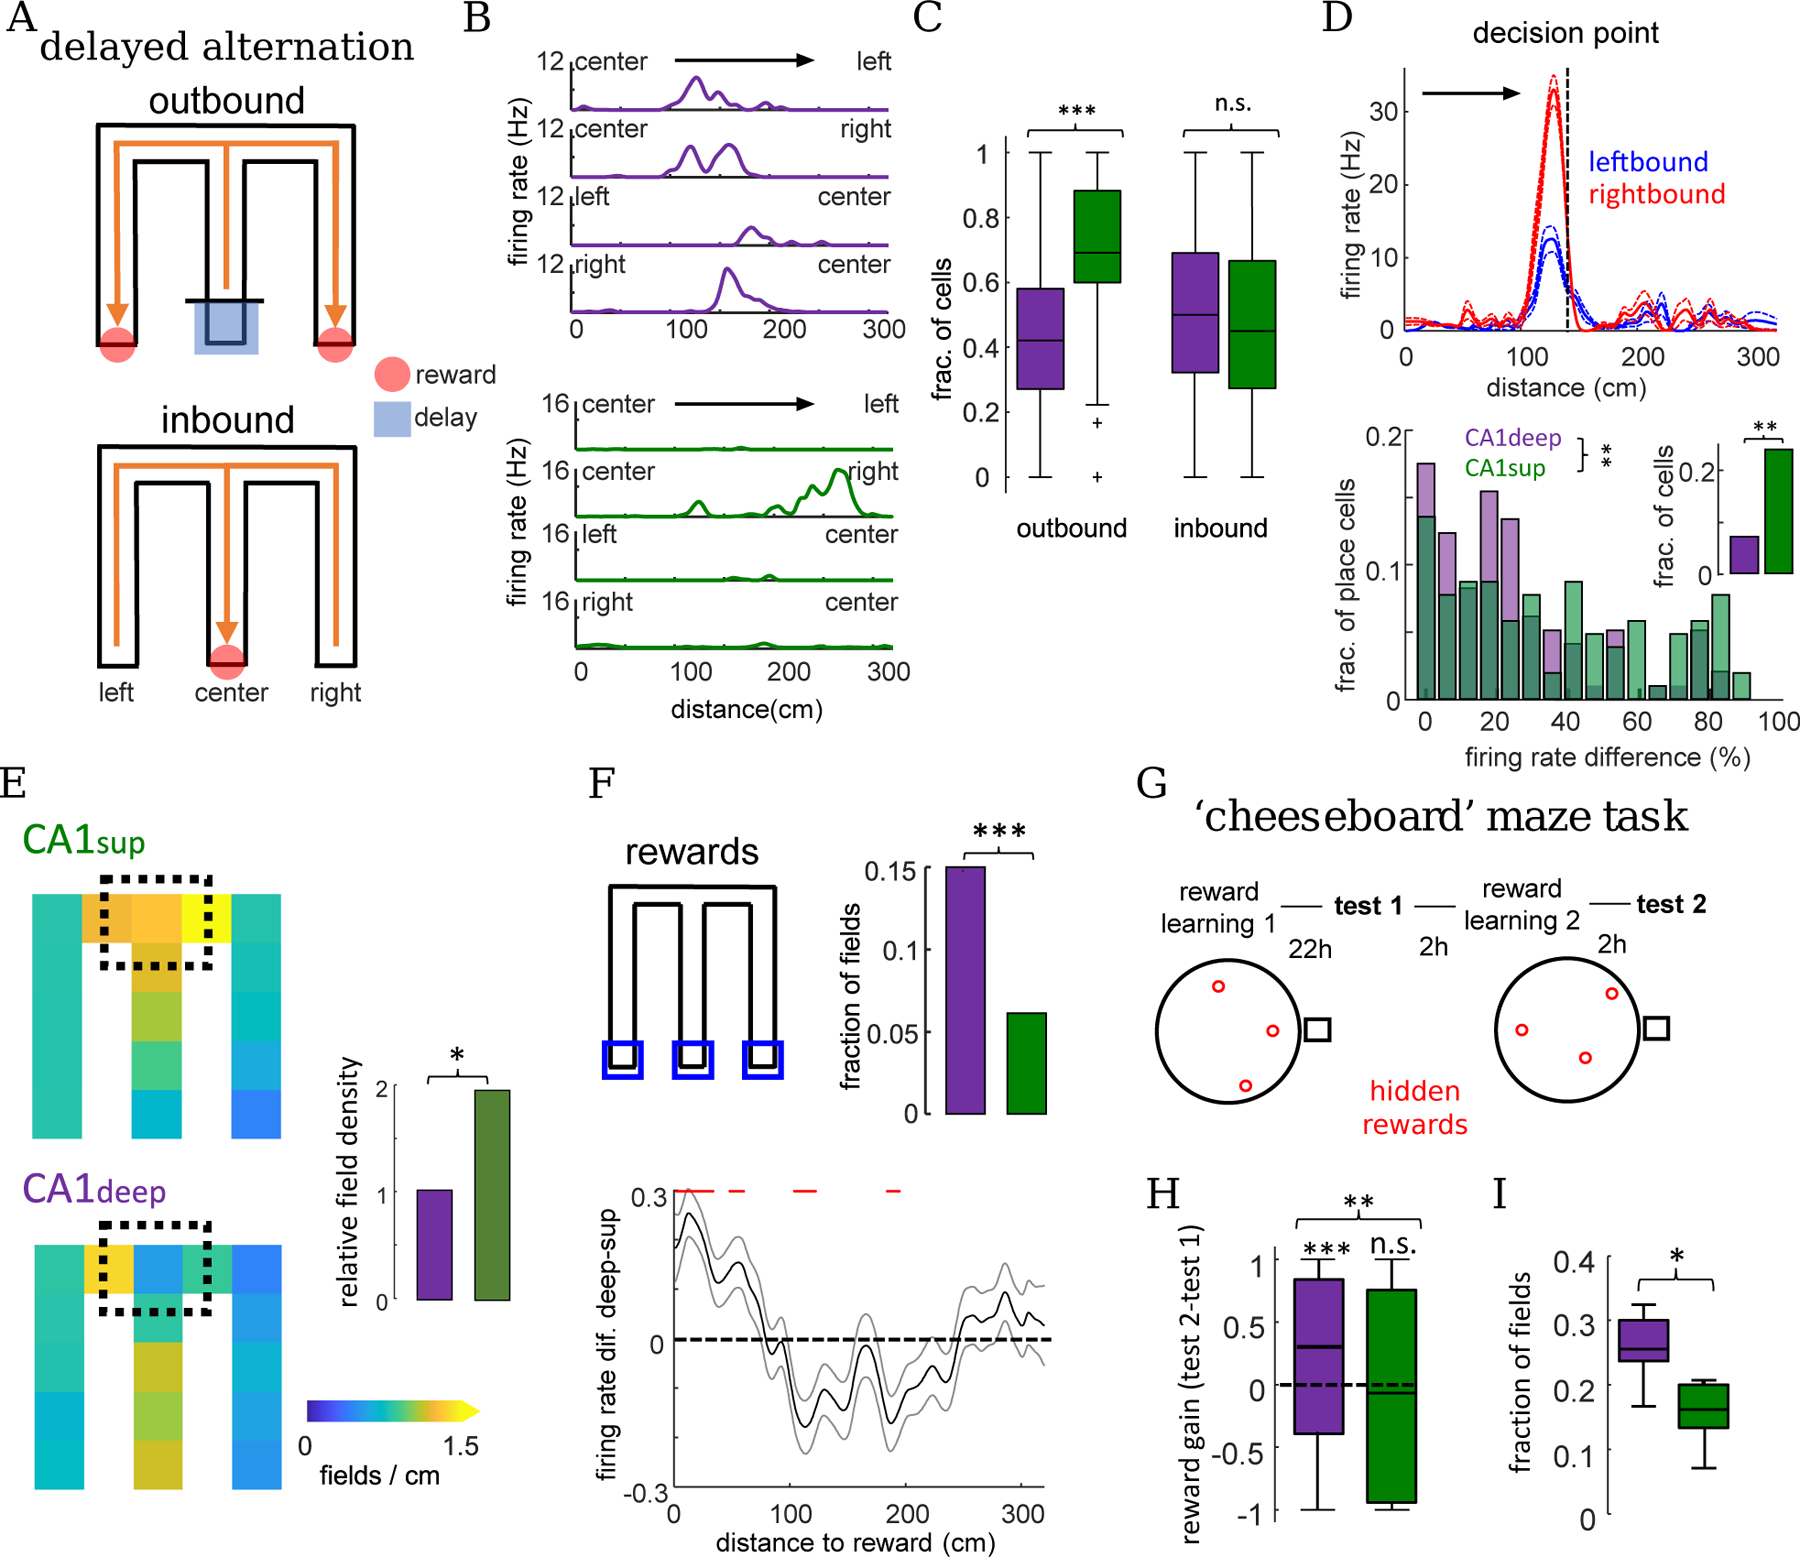
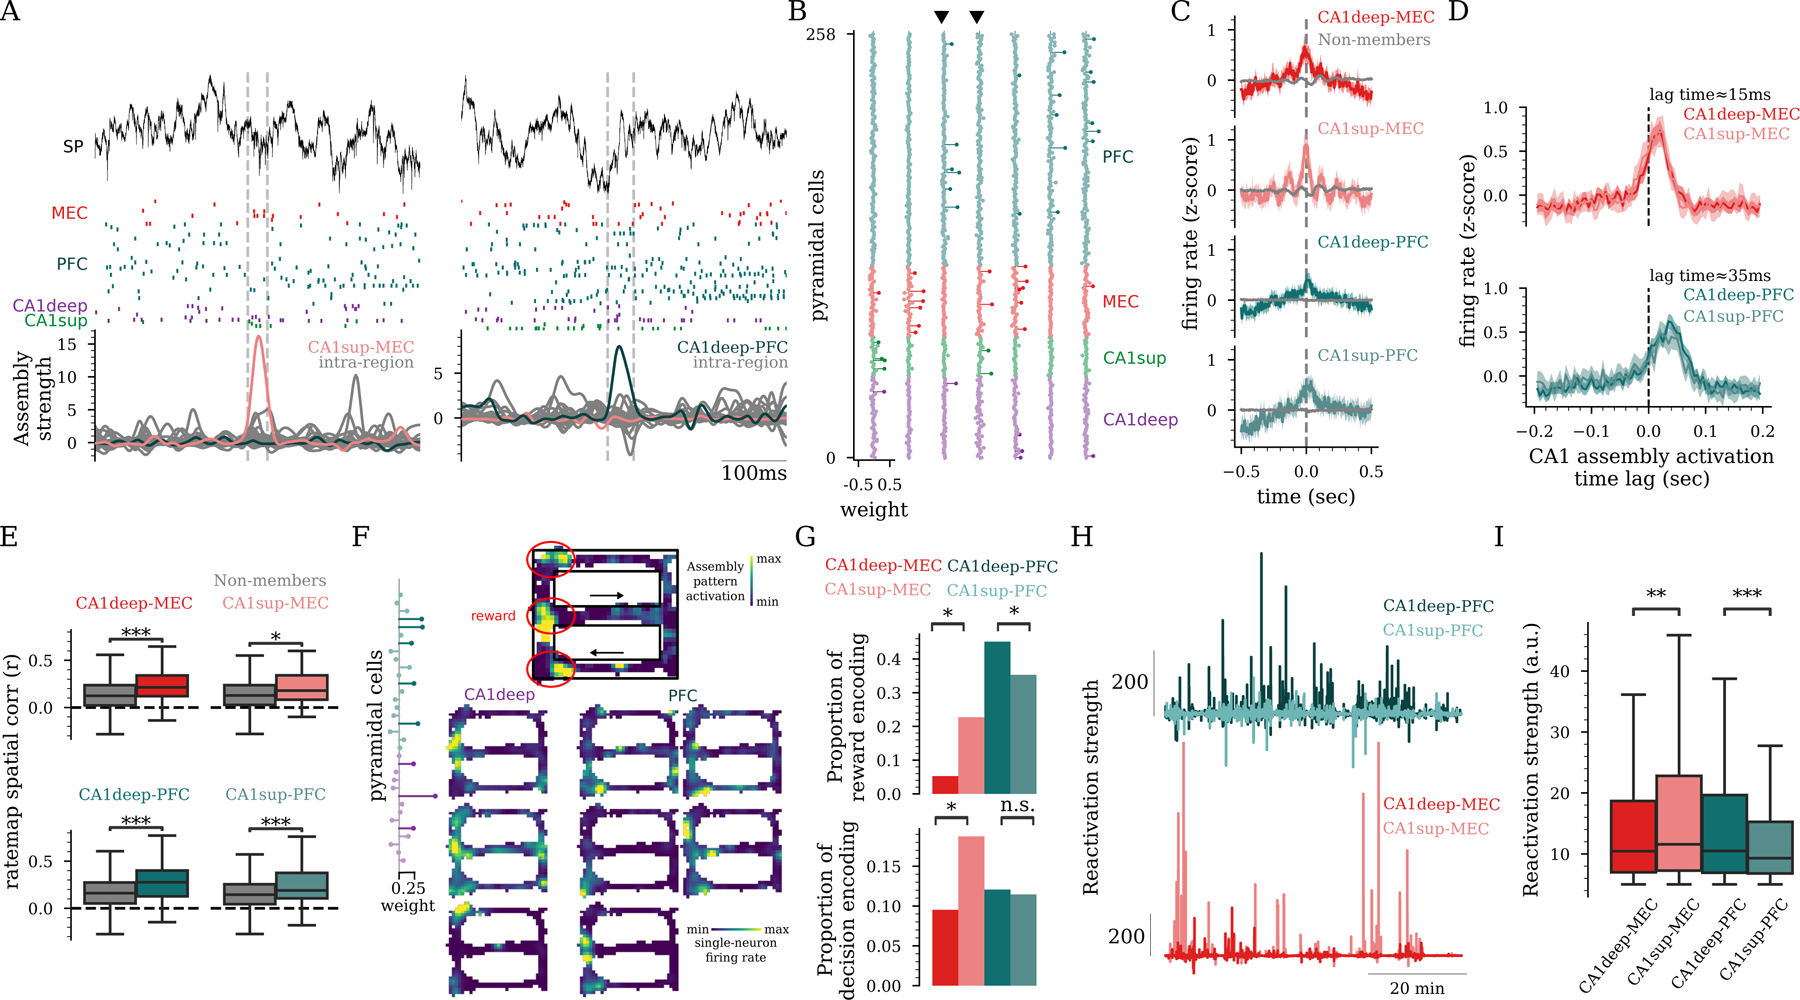
Traditionally considered a homogeneous cell type, hippocampal pyramidal cells have been recently shown to be highly diverse. However, how this cellular diversity relates to the different hippocampal network computations that support memory-guided behavior is not yet known. We show that the anatomical identity of pyramidal cells is a major organizing principle of CA1 assembly dynamics, the emergence of memory replay, and cortical projection patterns in rats. Segregated pyramidal cell subpopulations encoded trajectory and choice-specific information or tracked changes in reward configuration respectively, and their activity was selectively read out by different cortical targets. Furthermore, distinct hippocampo-cortical assemblies coordinated the reactivation of complementary memory representations. These findings reveal the existence of specialized hippocampo-cortical subcircuits and provide a cellular mechanism that supports the computational flexibility and memory capacities of these structures.

Keywords: cell assemblies; entorhinal cortex; hippocampus; memory reactivation; memory replay; oscillations; place cells; prefrontal cortex; sharp-wave ripples.


Conflict of interest statement

Declaration of interests The authors declare no competing interests.

Figures

Figure 1:
Figure 1:. Anatomical organization of hippocampal assembly dynamics.
A) Schematic of a 128-channel probe across CA1 sublayers: stratum oriens (SO), pyramidal layer (SP), stratum radiatum (SR) with an overlay of pyramidal cell’s soma’s (triangles) from deep (purple) to superficial (green). B) Left: Average SWR profile. Right: distribution of CA1deep, CA1middle, and CA1sup pyramidal cells. C) Example SWR cross-correlogram of cells pairs within and across sublayers. D) Within and across sublayer SWR pairwise co-firing (771,414 cell pairs, 0.033 vs. 0.024 median r, P<2×10¹⁶, Linear mixed-effects model (LME)). E) SWR participation probability and firing rate for CA1deep and CA1sup (P=2.33×10⁶/P=1.51×108, LME). F) SWR (LFP on top) with cell firing (middle raster) and activation of a CA1deep and a CA1sup assembly (bottom). Color circles indicate spikes corresponding to peaks in assembly activation. G) Example assembly weights. Length indicates weight. Assembly members are darker. H) Fraction of assemblies in which all members belonged to the same sublayer (’within layer’) or to different ones (’across layer’) (n=436 assemblies, P=2.56×10¹⁹,χ2). I) SWR co-firing of assembly members from the same or different CA1 sublayers and non-member neurons (500,968 cell pairs, P=2.48×10³/P<2×1016, LME). J) Contribution to assembly (weight) for CA1deep and CA1sup member neurons (P=7.23×10⁵, LME). B-J) CA1deep (3,851), CA1middle (2,878), and CA1sup (1,966) pyramidal cells in 49 rats.
Figure 2:
Figure 2:. Anatomical organization of hippocampal memory replay.
A) Place fields on a linear track sorted by the location of the peak firing rate. B) Example raster (middle) during a SWR (CA1 on LFP top) and decoded animal position (bottom) for two replay events. Units in the raster (one per row) were sorted according to the position of their place fields in the maze (A). C) Probability of participation in replay events (CA1deep vs. CA1sup P=1.14×10¹³, GLM, Fig. S2). D) Firing rate in replay events (P=.039, rank-sum test). E) Per cell contribution to replay (CA1deep vs. CA1sup P=3.32×10⁵, rank-sum test). F) Example showing how leaving out CA1deep or CA1sup cells decrease replay sequence quality differently. G) SWR-triggered average reactivation strength in post-task sleep for CA1deep and CA1sup assemblies (P=0.022, rank-sum test, 197 assemblies). The shaded band indicates 95% confidence intervals. H) Top: optogenetically prolonged SWR and cell sequence in delayed alternation memory task . Blue cone indicates when light was delivered (100ms pulse), triggered by the detection of a SWR. Bottom left: Firing rate increase in prolonged SWR vs. baseline (n=467 CA1deep / 289 CA1sup, 5 rats, P=2.52×10⁴, LME). Bottom right: Proportion of CA1deep and CA1sup recruited by stimulation (n=1074 events, P=5.84×10⁷,χ2). C-E,G) n = 685 CA1deep, 248 CA1sup, 12 rats
Figure 3:
Figure 3:. CA1deep and CA1sup have divergent projections to downstream cortical areas.
A) Green and red fluorescent retrograde tracers (Alexa Fluor-CTB conjugates) were injected in PFC and MEC to label hippocampal projecting cells in the same hemisphere. B) Representative histology from the same animal as A with CA1deep-PFC projecting (green) and CA1sup-MEC projecting (red) cells labeled in the dorsal hippocampus. Blue: DAPI, Red: CTB-555, Green: CTB488. C) Quantification of soma location for labeled cells (n=279 PFC projecting / 2,167 MEC projecting / 31 co-labeled cells in 3 rats, P<2×10¹⁶, rank-sum test, PFC-projecting vs. MEC-projecting depth).
Figure 4:
Figure 4:. CA1deep and CA1sup preferentially coordinate with different downstream cortical areas during SWR.
A) Recording schematic of three silicon probes implanted in PFC, dorsal CA1, and MEC of a rat. B) Example unit responses (bottom, each row is one neuron, color-coded by brain region) to SWR (top) in each region. C) Peri-SWR firing rate responses for all pyramidal cells in each region for rats with multi-region implants (n=14 rats, Table S1). Average responses (±95% CI) (top) (positive and negative responses separated for cortex) and individual units (below). D) Left: Prediction gain of the ratio of (CA1deep/CA1sup) for cells active in SWRs calculated from cortical responses vs. shuffle distributions (dashed line) (MEC:P=0.043, PFC:P=2.3×10³, t-test). Right: Proportion of sessions with the prediction accuracy above chance. E-F) Regression slopes between SWR relative content of CA1deep vs. CA1sup cells. E) and number of cortical units that responded (P=1.534×10³, rank-sum), and F) cortical firing rate responses in SWRs (P=4.35×10³, rank-sum). G) Examples of peri-SWR mutual information between cross-region cell pairs (mean±95%CI). H) Schematic of reduced rank regression used to predict neural activity in cortex from neural activity in CA1 during SWRs. Traces on the left and right reflect cell firing during SWRs. I) Mean squared error of predictions of cortical SWR responses from CA1 activity patterns using reduced rank regression (P=0.04 for CA1deep/sup versus MEC, P=1.33×10⁴ for CA1deep/sup vs. PFC, LME). D-F,I) 44 sessions, 9 rats.
Figure 5:
Figure 5:. Differential context coding by CA1deep and CA1sup place cells.
A) Example rate maps for a CA1deep and CA1sup cell in two different mazes across different contexts (different maze locations and cues). B) Proportion of pyramidal cells with at least one place field in a recording session (CA1sup 322/1,146 versus CA1deep 1,183/2,490, P=2.41×1028,χ2). C) Fraction of mazes where a cell expressed a place field was higher for CA1deep than CA1sup (P=4.52×10³, rank-sum). D) Context selectivity index was higher for CA1sup cells compared to CA1deep cells (P=8.34×10⁴). E-H) CA1deep and CA1sup place cell properties from place cell on linear track sessions. E) Place cell spatial information content was not significantly different between CA1deep and CA1sup (P=0.91, LME). F) Place field peak firing rates were higher CA1deep compared to CA1sup (P=4.8×10¹⁰). G) Place field widths were not significantly different between CA1deep and CA1sup (P=0.75). H) The proportion of place cells with more than one detected place field was higher in CA1deep than CA1sup (P=1.19×10³,χ2). B-H) n=2,490CA1deep, 1,146 CA1sup, from 25 rats.
Figure 6:
Figure 6:. Differential context, choice, and reward coding by CA1deep and CA1sup place cells.
A) Depiction of delayed alternation task in M-maze. B) Example rate maps across the four M-maze trajectories for a CA1deep (top) and CA1sup (bottom) place cell. C) Fraction of place cells with fields in either one of two different trajectories in outbound (CA1deep vs CA1sup, P=2.2×10³, rank-sum) and inbound (P=0.91) trials. D) Top: rate maps for a splitter cell for left and right outbound trials. Note different firing rates within its place field in the center arm for left-bound and right-bound trials. Bottom: distribution of firing rate difference for left and right outbound trials for cells with overlapping fields in the central arm (n = 97 CA1deep / 104 CA1sup;P=0.008) and the fraction of splitter cells (inset;P=0.001, Fisher’s test). E) Aggregated place field density maps for CA1deep and CA1sup place cells in outbound trials (n=398 CA1deep / 422 CA1sup fields). Right: place field density around decision point (black square) / density in rest of maze (P=0.02, Fisher’s test) F) Top: Fraction of cells with fields around reward locations (blue squares; n=50 CA1deep / 24 CA1sup fields;P=3.1×10⁴). Bottom: firing rate difference of CA1deep-CA1sup place cells as a function of distance to reward (mean±SEM: the three arms were averaged together). Red lines indicate significant differences (P<0.05, t-test with Bonferroni correction). G) Depiction of ’cheeseboard’ maze task schedule and example reward configurations. H) Increase in firing rate around newly learned reward locations from test 1 to test 2 (P=4.5×10⁵&P=0.4; n=327 CA1deep and 174 CA1sup place cells; sign-rank test, CA1deep vs. CA1sup P=9.6×10⁴, rank-sum). I) Fraction of place fields around reward locations in test 2 (P=0.015, rank-sum). Only one primary place field for each cell was considered for this analysis.
Figure 7:
Figure 7:. Hippocampo-cortical assemblies encode and reactivate complementary task representations.
A) Hippocampal LFP (top), unit firing from MEC, PFC, and CA1 (middle), and assembly activation (bottom) during behavior. Dashed lines mark the activation of hippocampo-cortical assemblies (colored curves). B) Example assembly weights, including hippocampo-cortical assemblies (marked by black triangles) and single-region assemblies. C) Cross-correlograms between spike trains of hippocampo-cortical assembly members (colored curves) showed stronger spike synchrony than for non-members (grey curves) during behavior (Ps<2×10¹⁶). D) Firing of MEC (top) & PFC (bottom) units center around the discharge of CA1 assemblies (mean CA1-MEC lag = 15ms; CA1-PFC lag = 35ms). E) Rate map spatial correlation for assembly members was higher than for non-members (Ps<1.16×10² rank-sum test). F) Example rate maps for a CA1deep-PFC assembly activation (top) and its individual members firing (bottom) in a delayed alternation T-maze task. Note the elevated activation of both the assembly and its individual member neurons around reward locations (red circles) indicate reward locations. G) Fraction of assemblies encoding reward locations (top; CA1deep-MEC vs. CA1sup-MEC P=0.021, χ2, CA1deep-PFC vs. CA1sup-PFC P=0.042) and decision point in the maze (bottom; CA1deep-MEC vs. CA1sup-MEC:P=0.027, χ2, 8 rats from the T-maze task). H) Example assembly reactivation strength during SWRs for representative hippocampo-cortical assemblies. I) Reactivation strengths of hippocampo-cortical assemblies in post-task sleep SWRs (CA1deep-MEC vs. CA1sup-MEC P=2.49×10⁵; CA1deep-PFC vs. CA1sup-PFC P=3.61×10⁵, LME). C-E,I) n = 1,319 CA1deep, 760 CA1sup, 973 MEC, 1,826 PFC pyramidal cells, from 14 rats. C,E,G,I) n = 170 cross-region assemblies out of 1,700 total assemblies.

References

    1. O’Keefe J and Nadel L (1978). The Hippocampus as a Cognitive Map (Oxford: Clarendon Press; ).
    1. Buzsáki G (2015). Hippocampal sharp wave-ripple: A cognitive biomarker for episodic memory and planning. Hippocampus 25, 1073–1188. - PMC - PubMed
    1. Oliva A, Fernández-Ruiz A, Leroy F, and Siegelbaum SA (2020). Hippocampal CA2 sharp-wave ripples reactivate and promote social memory. Nature 587, 264–269. - PMC - PubMed
    1. Wilson M and McNaughton B (1994). Reactivation of hippocampal ensemble memories during sleep. Science 265, 676–679. - PubMed
    1. Pavlides C and Winson J (1989). Influences of hippocampal place cell firing in the awake state on the activity of these cells during subsequent sleep episodes. Journal of Neuroscience 9, 2907–2918. Publisher: Society for Neuroscience Section: Articles. - PMC - PubMed

Publication types

LinkOut - more resources