. 2023 Jun;618(7967):1072-1077.
doi: 10.1038/s41586-023-06191-5. Epub 2023 May 17.

Inhibiting membrane rupture with NINJ1 antibodies limits tissue injury

Affiliations

Inhibiting membrane rupture with NINJ1 antibodies limits tissue injury

Nobuhiko Kayagaki et al. Nature. 2023 Jun.

Abstract

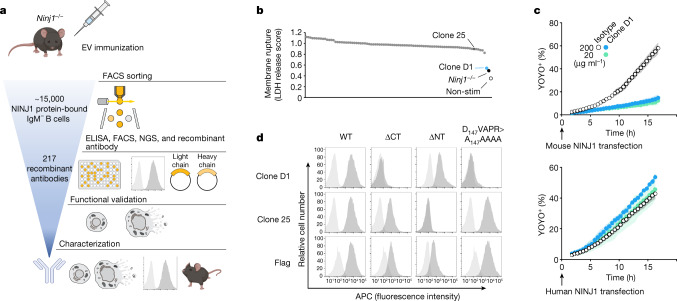
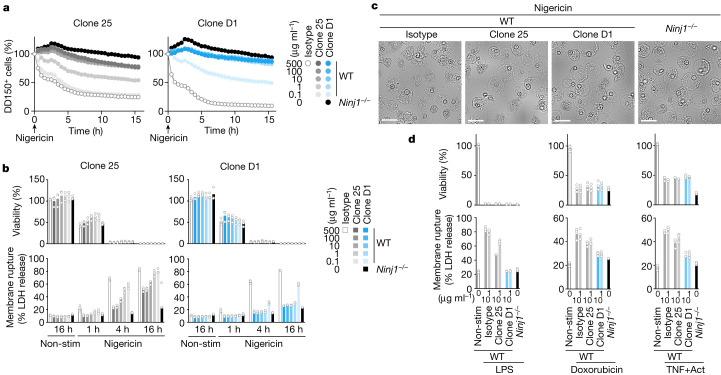
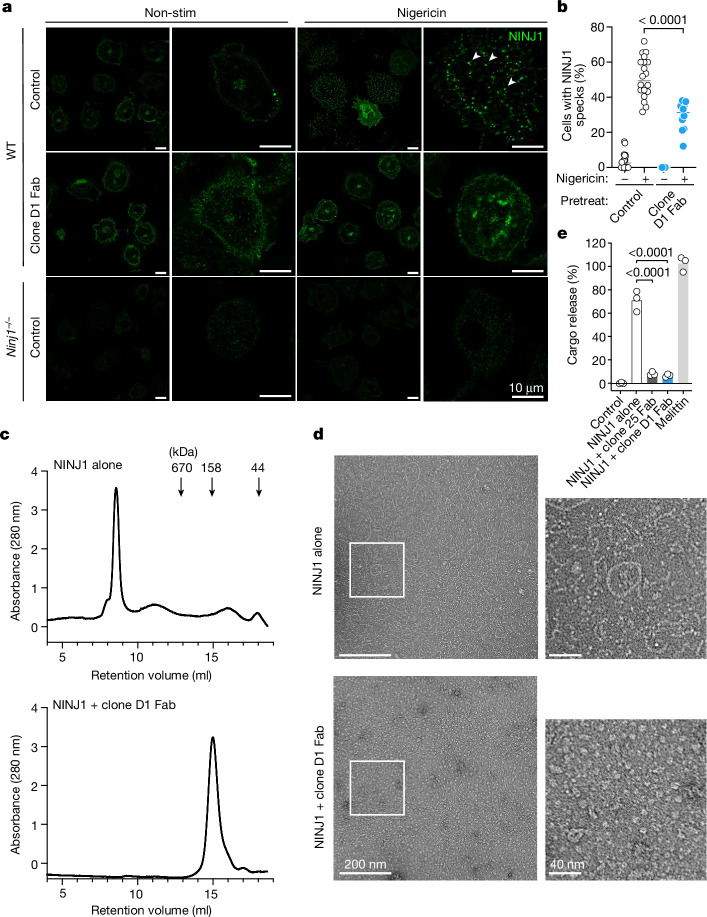
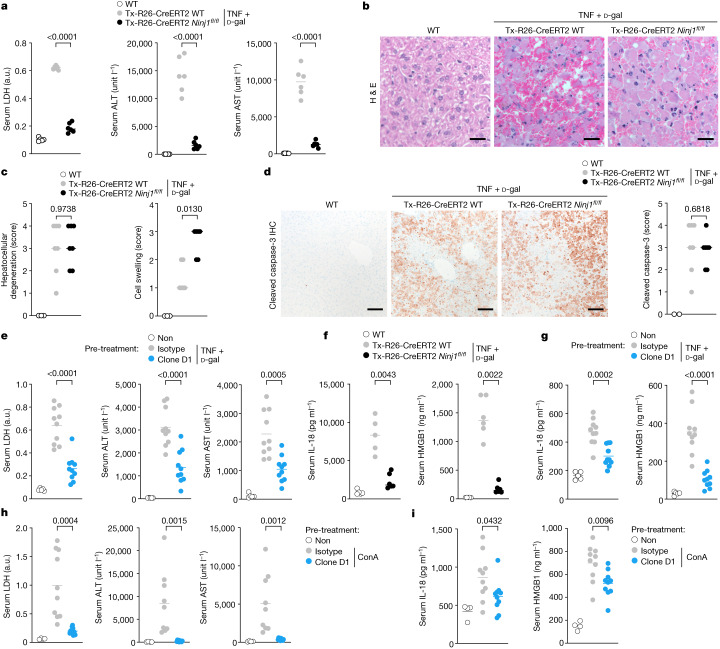
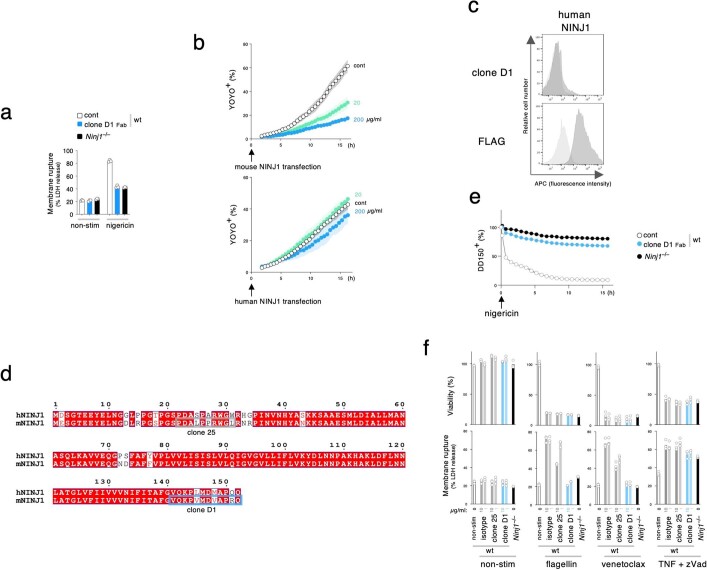
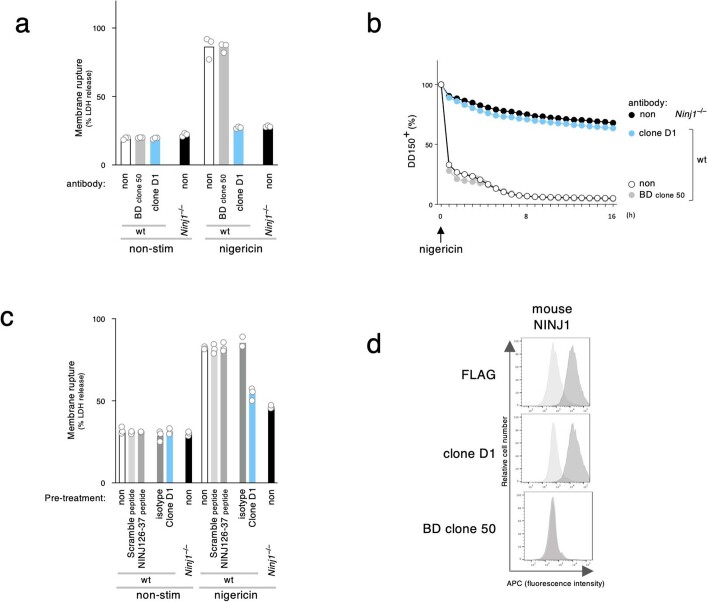
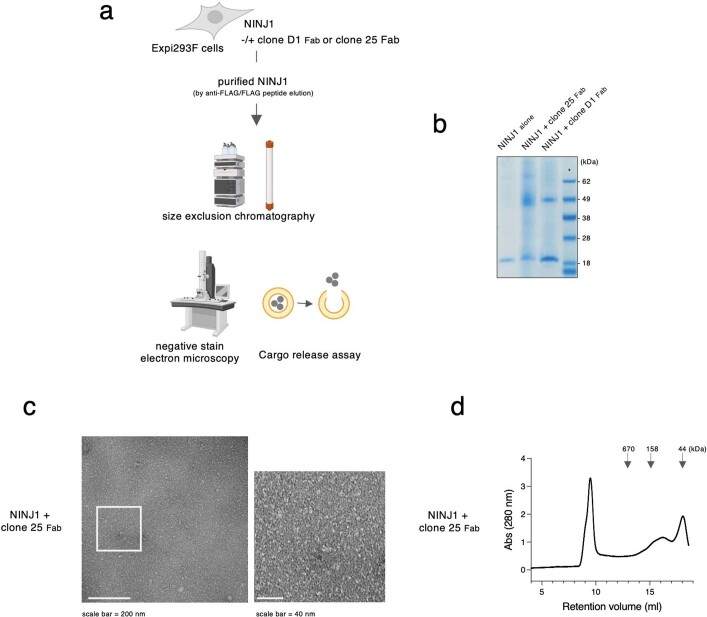
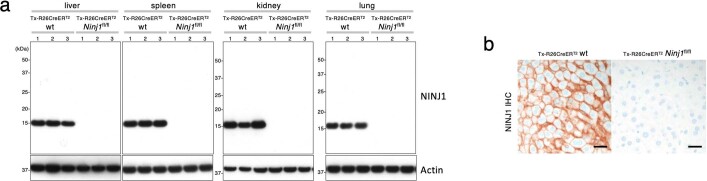
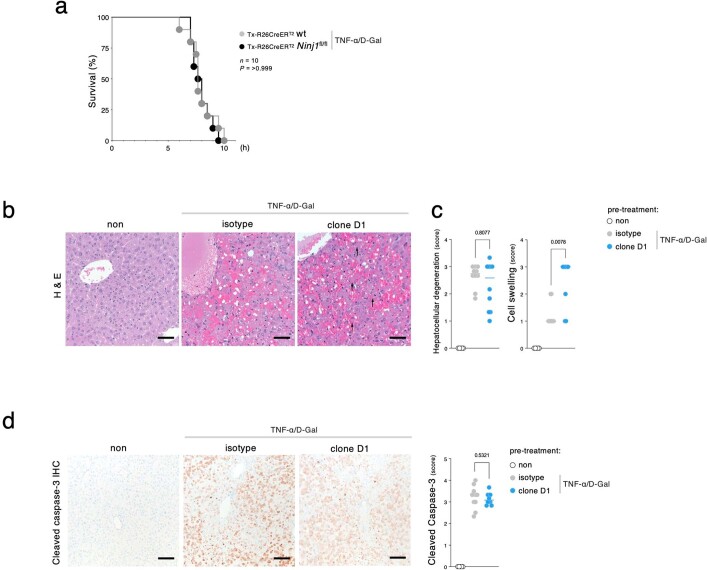
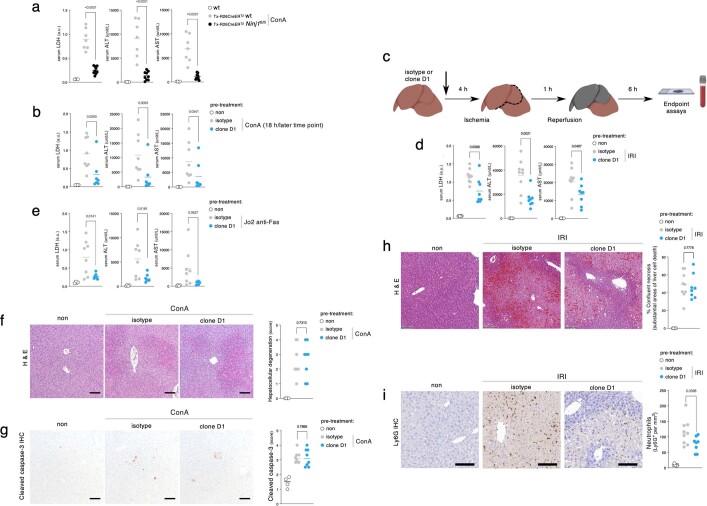
Plasma membrane rupture (PMR) in dying cells undergoing pyroptosis or apoptosis requires the cell-surface protein NINJ11. PMR releases pro-inflammatory cytoplasmic molecules, collectively called damage-associated molecular patterns (DAMPs), that activate immune cells. Therefore, inhibiting NINJ1 and PMR may limit the inflammation that is associated with excessive cell death. Here we describe an anti-NINJ1 monoclonal antibody that specifically targets mouse NINJ1 and blocks oligomerization of NINJ1, preventing PMR. Electron microscopy studies showed that this antibody prevents NINJ1 from forming oligomeric filaments. In mice, inhibition of NINJ1 or Ninj1 deficiency ameliorated hepatocellular PMR induced with TNF plus D-galactosamine, concanavalin A, Jo2 anti-Fas agonist antibody or ischaemia-reperfusion injury. Accordingly, serum levels of lactate dehydrogenase, the liver enzymes alanine aminotransaminase and aspartate aminotransferase, and the DAMPs interleukin 18 and HMGB1 were reduced. Moreover, in the liver ischaemia-reperfusion injury model, there was an attendant reduction in neutrophil infiltration. These data indicate that NINJ1 mediates PMR and inflammation in diseases driven by aberrant hepatocellular death.


Conflict of interest statement

The following authors are employees of Genentech: N.K., I.B.S., K.A., I.D., S.W., Z.L., O.S.K., B.L.L., J.Z., J.L., E.S., W.P.L., K.S., W.L., D.S., T.B., C.C., M.C.J., P.J., K.N., J.D.W., R.L.K. and V.M.D.

Figures

Fig. 1
Fig. 1. Identification of NINJ1-blocking antibody clone D1.
a, Scheme of recombinant antibody screening. EV, extracellular vesicle; FACS, fluorescence-activated cell sorting. b, LDH released from Pam3CSK4-primed wild-type BMDMs after nigericin stimulation for 16 h in the presence of 1 μg ml−1 of indicated antibody (dots represent different antibodies tested). Ninj1−/−, Ninj1−/− BMDMs; non-stim, non-stimulated wild-type BMDMs. The LDH score is the LDH release normalized against the no-antibody control. c, The percentage of YOYO-1+ NINJ1-expressing HEK293T cells when cultured with clone D1 or an isotype control antibody. Data are mean (circles) ± s.d. (shaded area) of three independent replicates. d, Flow cytometry histograms of propidium iodide-negative HEK293T cells surface-stained with anti-NINJ1 or anti-Flag antibodies. Cells are mock-transfected (light grey) or transfected with indicated NINJ1 constructs (dark grey). WT, wild type; ΔCT, NINJ1(Δ142–152); ΔNT, NINJ1(Δ2–73). In c,d, results are representative of three independent experiments.
Fig. 2
Fig. 2. Clone D1 potently inhibits NINJ1-dependent PMR.
a, The release of DD-150 from Pam3CSK4-primed BMDMs after nigericin stimulation. Data are mean (circles) ± s.d. (shaded area) of biological replicates (n = 3 mice); data were generated with bone marrow collected from three mice. b,d, Viability (top) and LDH release (bottom) in BMDM cultures following pyroptosis induction with nigericin (b) or cytoplasmic LPS for 3 h, apoptosis induction with doxorubicin for 6 h or TNF + actinomycin D (Act) for 6 h (d). Pyroptotic stimuli were applied to Pam3CSK4-primed BMDMs. b,d, Bars are the mean of 3 biological replicates (n = 3 mice) as in a. c, Bright-field images of Pam3CSK4-primed BMDMs stimulated with nigericin for 8 h. Scale bar, 25 µm. In ad, results are representative of three independent experiments.
Fig. 3
Fig. 3. Clone D1 attenuates NINJ1 oligomerization.
a, Immunolabelling of endogenous NINJ1 in BMDMs after priming with Pam3CSK4 and then stimulation with nigericin for 45 min in the presence or absence (control) of clone D1 Fab. Arrowheads highlight representative NINJ1 specks. b, Quantification of the percentage of cells bearing NINJ1 specks in a. The small horizontal lines indicate the mean. D1 Fab: n = 10 independent samples; other groups: n = 20 independent samples. Two-tailed t-test, P = 0.0000091. c, SEC traces for purified NINJ1 or the NINJ1–clone D1 Fab complex. Molecular weight standard marker positions are indicated by arrows. Results representative of three independent experiments. d, Negative-stain electron microscopy of NINJ1 or the NINJ1–clone D1 Fab complex in c. e, Liposome cargo release by the NINJ1 or NINJ1–D1 Fab complex in c or NINJ1–clone 25 Fab complex in Extended Data Fig. 3d. Bars show the mean of three independent replicates (circles). Two-tailed Mann–Whitney U-test, P = 0.0000411 (NINJ1 + clone 25 Fab versus NINJ1 alone), P = 0.0000411 (NINJ1 + clone D1 Fab versus NINJ1 alone). 100% cargo release is the total cargo release following addition of 1% cholamidopropyl(dimethylammonio)-2-hydroxy-1-propanesulfonate (CHAPSO).
Fig. 4
Fig. 4. Clone D1 limits NINJ1-dependent PMR and DAMP release in vivo.
a, Mouse serum LDH, ALT and AST. Where indicated, mice were treated with TNF and d-Gal for 7 h. Untreated wild-type, n = 5 mice; tamoxifen-treated groups, n = 6 mice. P value two-tailed unpaired t-test, P = 0.0000000000665 (LDH), P = 0.00000296 (ALT), P = 0.000000000067 (AST). a.u., arbitrary units. b, Representative haematoxylin and eosin-stained liver sections of the mice in a. Scale bars, 25 µm. c, Histological scoring of mouse livers. Untreated wild type: n = 3 mice; tamoxifen-treated groups: n = 7 (left) or 6 (right) mice. Two-tailed Mann–Whitney U-test. d, Left, mouse liver sections with immunolabelling of cleaved caspase-3 (brown). Right, qualitative scoring of cleaved caspase-3 labelling. Untreated wild type: n = 2 mice; tamoxifen-treated groups: n = 7 mice. Two-tailed Mann–Whitney U-test. Scale bars, 100 µm. e,h, Wild-type mouse serum LDH, ALT and AST. Where indicated, mice were dosed with 50 mg kg−1 antibody for 2 h before dosing with TNF plus d-Gal for 6 h (e) or ConA for 8 h (h). Untreated wild type: n = 5 (e) or n = 4 mice (h); wild type dosed with antibodies: n = 10 mice. Two-tailed unpaired t-test. e, P = 0.00000915 (LDH), P = 0.000094 (ALT). f, Serum IL-18 and HMGB1 of mice in a. Untreated wild type: n = 5 mice; tamoxifen-treated Ninj1+/+ Rosa26-creERT2: n = 5 (left), n = 6 (right) mice; tamoxifen-treated Ninj1fl/fl Rosa26-creERT2: n = 6 mice. g, Serum IL-18 and HMGB1 of mice in e. i, Serum IL-18 and HMGB1 of mice in h. Untreated wild-type: n = 5 (g) or n = 4 (i) mice; treated groups: n = 10 mice (g,i). Two-tailed Mann–Whitney U-test (f), two-tailed unpaired t-test (g,i); P = 0.00000682 (g). In a,ei, lines represent the mean and circles represent individual mice; in c,d, lines represent the median and circles represent individual mice. Source data
Extended Data Fig. 1
Extended Data Fig. 1. Clone D1 inhibits PMR.
a, Graphs indicate LDH release in cultures of wild-type BMDMs after priming, and then stimulation with nigericin for 16 h in the presence or absence (cont) of clone D1 Fab. Non-stim, non-stimulated control. Bars indicate the mean. Circles indicate 3 biological replicates. Results representative of 3 independent experiments. b, Graphs indicate the percentage of YOYO-1+ HEK293T NINJ1 expressing cells when cultured with or without (cont) clone D1 Fab. Circles are the mean ± s.d. (shaded area) of 3 independent replicates. Results are representative of 2 independent experiments. c, Flow cytometry histograms of propidium iodide-negative HEK293T cells surface-stained with anti-NINJ1 or anti-FLAG antibodies. Cells are mock transfected (light gray) or transfected with human NINJ1 (dark gray). Results representative of 3 independent experiments. d, Amino acid sequence alignment of human and mouse NINJ1. Predicted epitope of clone 25 (grey box) and clone D1 (blue box) are highlighted. e, Graph shows the release of DD-150 from Pam3CSK4-primed BMDMs in (a) after nigericin stimulation. Data are means (circles) ± s.d. (shaded area). Circles indicate 3 biological replicates (n = 3 animals). Results representative of 3 independent experiments. f, Graphs indicate cell viability (top) and LDH release (bottom) in BMDMs. Non-stim, non-stimulated control. Bars indicate the mean. Circles indicate 3 biological replicates (n = 3 animals). Results representative of 2 independent experiments.
Extended Data Fig. 2
Extended Data Fig. 2. Commercially available anti-NINJ1 antibody.
a,c, Graphs indicate LDH release in cultures of wild-type or Ninj1–/– BMDMs after priming, and then stimulation with nigericin for 4 h in the presence or absence (non) of 10 μg/mL indicated antibodies or 200 nM of peptides. Non-stim, non-stimulated control. Bars indicate the mean. BD clone 50, BD Bioscience anti-Ninjurin clone 50. Circles indicate biological replicates (n = 3 animals); data were generated with bone marrow from 3 different mice. Results representative of 3 independent experiments. b, Graph shows the release of DD-150 from Pam3CSK4-primed wild-type or Ninj1–/– BMDMs after nigericin stimulation in the presence or absence (non) of 10 μg/mL indicated antibodies. Data are means (circles) ± s.d. (shaded area) of biological replicates (n = 3 animals). Results representative of 3 independent experiments. d, Flow cytometry histograms of propidium iodide-negative HEK293T cells surface-stained with indicated antibodies. Cells are mock transfected (light gray) or transfected with mouse NINJ1 (dark gray). Results representative of 3 independent experiments.
Extended Data Fig. 3
Extended Data Fig. 3. Biochemical analysis for NINJ1-anti-NINJ1 Fab complex.
a, Schematic of the procedures in Fig. 3c,d,e, and Extended Data Fig. 3b, c, d. b, Coomassie blue staining of NINJ1 alone (retention volume 8.5-9 ml) and NINJ1-clone D1 Fab complex (retention volume 15-15.5 ml) of Fig. 3c or NINJ1-clone 25 Fab complex of (d) (retention volume 15.5-16 ml). Results representative of 2 independent experiments. c, Negative stain electron microscopy of NINJ1-clone 25 Fab complex. Results representative of 2 independent experiments. d, Size exclusion chromatography traces for purified NINJ1-clone 25 Fab complex. Results representative of 3 independent experiments. Molecular weight standard marker positions are indicated by arrows.
Extended Data Fig. 4
Extended Data Fig. 4. A link between NINJ1 and lower levels of serum AST and ALT in Genome-wide association studies (GWAS).
Regional plot of GWAS (UK Biobank random participants, n = 363, 228), showing correlation of a NINJ1 single nucleotide polymorphism (rs7018885, purple diamond in chromosome 9 locus) with lower serum AST (bottom) or ALT (top). P values were obtained from a two-sided test for the null hypothesis that the effect of genotype (at each single nucleotide polymorphism) on the ALT or AST values in a linear regression model was zero. P values are not adjusted for multiple tests across the genome.
Extended Data Fig. 5
Extended Data Fig. 5. Characterization of tamoxifen-treated Ninj1fl/flRosa26-CreERT2 mice.
a, Immunoblots of mouse tissues at 2 weeks after tamoxifen dosing. Lanes represent different mice. n = 3 mice per genotype. b, Immunolabeling of NINJ1 (brown) in mouse liver sections. Scale bar, 25 µm. Results representative of 3 mice per genotype.
Extended Data Fig. 6
Extended Data Fig. 6. Impact of clone D1 pretreatment on hepatocellular degeneration and caspase-3 cleavage in mice treated with TNF plus D-Gal.
a, Kaplan–Meier survival plots of mice injected with 25 μg kg−1 TNF plus D-Gal. n = 10 mice per group. P value two-tailed log-rank test. Results representative of 3 independent experiments. b, Representative haematoxylin and eosin-stained liver sections of the mice in Fig. 4e. Scale bar, 50 µm. Arrows indicate swollen cells. c, Histological scores of hepatocellular degeneration (left) and liver cell swelling (right) for the mice in Fig. 4e. Untreated wild-type, n = 5 mice; wild-type dosed with antibody, TNF plus D-Gal, n = 10 (left), n = 9 (right) mice. Lines represent the median, circles individual mice. P value two-tailed Mann-Whitney U-test. d, Liver sections from the mice in Fig. 4e after immunolabeling of cleaved caspase-3 (brown). Graph indicates qualitative scoring of cleaved caspase-3 labeling. Untreated wild-type, n = 5 mice; wild-type dosed with isotype control antibody, TNF plus D-Gal, n = 10 mice; Wild-type dosed with clone D1 and TNF plus D-Gal, n = 10 mice. Lines represent the median, circles individual mice. P value two-tailed Mann-Whitney U-test. Scale bar, 100 µm. Source data
Extended Data Fig. 7
Extended Data Fig. 7. Clone D1 limits NINJ1-dependent PMR and inflammation in hepatitis models.
a, Mouse serum LDH, ALT, and AST. Where indicated, mice were dosed for 8 h with ConA. Untreated wild-type, n = 4 mice; tamoxifen-treated Ninj1+/+ Rosa26-CreERT2, n = 7 mice; tamoxifen-treated Ninj1fl/fl Rosa26-CreERT2, n = 9 mice. a.u., arbitrary units. Lines indicate the mean, circles individual mice. P value two-tailed unpaired t-test, P = 0.00000112 (LDH), P = 0.0000427 (ALT), P = 0.0000319 (AST). b,e, Wild-type mouse serum LDH, ALT, and AST. Where indicated, mice were dosed with 50 mg kg−1 antibody for 2 h before dosing with 15 mg kg−1 ConA for 18 h (b) or Jo2 anti-Fas for 5 h (e). Untreated wild-type, n = 5 mice; wild-type dosed with isotype control antibody, n = 8 mice; wild-type dosed with clone D1, n = 7 mice. Lines indicate the mean, circles individual mice. P value two-tailed Mann-Whitney U-test (b) and two-tailed unpaired t-test (e). c, Schematic of the IRI procedure in (d,h,i). d, Wild-type mouse serum LDH, ALT, and AST. Where indicated, mice were dosed with 50 mg kg−1 antibody for 4 h before IRI for 6 h. Untreated sham, n = 6 mice; wild-type dosed with isotype control antibody, n = 9 mice; wild-type dosed with clone D1, n = 8 mice. Lines indicate the mean, circles individual mice. P value two-tailed unpaired t-test. f,g, Liver sections with haematoxylin and eosin-staining (f) and immunolabeling of cleaved caspase-3 (brown) (g) of mice dosed with 50 mg kg−1 antibody for 2 h before dosing ConA for 6 h. Scale bar, 100 µm. Graphs indicate qualitative scoring of hepatocellular degeneration (f) and cleaved caspase-3 labeling (g). Untreated sham, n = 4 mice; wild-type dosed with isotype control antibody, n = 8 mice; wild-type dosed with clone D1, n = 8 mice. Lines indicate the median, circles individual mice. P value two-tailed Mann-Whitney U-test. h,i, Liver sections with representative haematoxylin and eosin (h) and Ly6G (i) staining of the mice in (d). Scale bar, 100 µm. Graphs indicate histological scoring of % confluent necrosis (h) and Ly6G-positive cells (neutrophils) (i). Untreated sham, n = 6 mice; wild-type dosed with isotype control antibody, n = 9 mice; wild-type dosed with clone D1, n = 8 mice. Lines indicate the median, circles individual mice. P value two-tailed unpaired t-test. Source data

References

    1. Kayagaki N, et al. NINJ1 mediates plasma membrane rupture during lytic cell death. Nature. 2021;591:131–136. doi: 10.1038/s41586-021-03218-7. - DOI - PubMed
    1. Araki T, Milbrandt J. Ninjurin, a novel adhesion molecule, is induced by nerve injury and promotes axonal growth. Neuron. 1996;17:353–361. doi: 10.1016/S0896-6273(00)80166-X. - DOI - PubMed
    1. Araki T, Zimonjic DB, Popescu NC, Milbrandt J. Mechanism of homophilic binding mediated by ninjurin, a novel widely expressed adhesion molecule. J. Biol. Chem. 1997;272:21373–21380. doi: 10.1074/jbc.272.34.21373. - DOI - PubMed
    1. Bjanes E, et al. Genetic targeting of Card19 is linked to disrupted NINJ1 expression, impaired cell lysis, and increased susceptibility to Yersinia infection. PLoS Pathog. 2021;17:e1009967. doi: 10.1371/journal.ppat.1009967. - DOI - PMC - PubMed
    1. Ahn BJ, et al. Ninjurin1 deficiency attenuates susceptibility of experimental autoimmune encephalomyelitis in mice. J. Biol. Chem. 2014;289:3328–3338. doi: 10.1074/jbc.M113.498212. - DOI - PMC - PubMed

Publication types

MeSH terms