. 2023 Aug:366:114445.
doi: 10.1016/j.expneurol.2023.114445. Epub 2023 May 15.

PRMT7 can prevent neurovascular uncoupling, blood-brain barrier permeability, and mitochondrial dysfunction in repetitive and mild traumatic brain injury

Affiliations

PRMT7 can prevent neurovascular uncoupling, blood-brain barrier permeability, and mitochondrial dysfunction in repetitive and mild traumatic brain injury

Christina H Acosta et al. Exp Neurol. 2023 Aug.

Abstract

Mild traumatic brain injury (TBI) comprises the largest percentage of TBI-related injuries, with pathophysiological and functional deficits that persist in a subset of TBI patients. In our three-hit paradigm of repetitive and mild traumatic brain injury (rmTBI), we observed neurovascular uncoupling via decreased red blood cell velocity, microvessel diameter, and leukocyte rolling velocity 3 days post-rmTBI via intra-vital two-photon laser scanning microscopy. Furthermore, our data suggest increased blood-brain barrier (BBB) permeability (leakage), with corresponding decrease in junctional protein expression post-rmTBI. Mitochondrial oxygen consumption rates (measured via Seahorse XFe24) were also altered 3 days post-rmTBI, along with disrupted mitochondrial dynamics of fission and fusion. Overall, these pathophysiological findings correlated with decreased protein arginine methyltransferase 7 (PRMT7) protein levels and activity post-rmTBI. Here, we increased PRMT7 levels in vivo to assess the role of the neurovasculature and mitochondria post-rmTBI. In vivo overexpression of PRMT7 using a neuronal specific AAV vector led to restoration of neurovascular coupling, prevented BBB leakage, and promoted mitochondrial respiration, altogether to suggest a protective and functional role of PRMT7 in rmTBI.

Keywords: Bioenergetics; Blood-brain barrier; Cerebral blood flow; Gliosis; Leukocyte rolling; Mitochondrial dysfunction; Protein arginine methyltransferase; Traumatic brain injury.


Conflict of interest statement

Declaration of Competing Interest The authors declare that they have no known competing financial interests or personal relationships that could have appeared to influence the work reported in this paper.

Figures

Fig. 1.
Fig. 1.
rmTBI mice overexpressed with PRMT7-AAV enhanced protein levels. A) Cartoon illustrating the experimental design of PRMT7-AAV overexpression virus (AAV/PHP.eB-hSYN1-GFP.mPRMT7-WPRE) in rmTBI. Mice were injected intravenously 3–4 weeks prior to experimentation, exposed to three repetitive and mild TBI hits, separated by 24 h intervals and assessed at 3 and 7 days post-rmTBI. PRMT7 protein expression (~73 kDa) was significantly elevated in the B) cortex (green bar/black lines) and the C) hippocampus (green bar/black lines) relative to SHAM mice (white bars), measured by capillary-based immunoassay and normalized to total protein. Computer software generated pseudo-blots are presented below each of the corresponding protein graphs where applicable. PRMT7 mRNA expression was also assessed and revealed significant upregulation in the D) cortex and a trending increase in the E) hippocampus (green bar/black lines) relative to SHAM (white bars). Results were expressed as mean ± SEM. *p ≤ 0.05, as compared to age-matched rmTBI mice, evaluated by Student’s t-test. (n = 3–5).
Fig. 2.
Fig. 2.
rmTBI mice were overexpressed with GFP-tagged PRMT7-AAV. PRMT7-AAV overexpression virus (AAV/PHP.eB-hSYN1-GFP.mPRMT7-WPRE) was injected intravenously and analyzed via histology. Vehicle-treated mice were injected with equal volume of Lactated Ringer’s and visualized with confocal microscopy. Vehicle-treated mice did not exhibit GFP-tagged PRMT7-AAV overexpression in histological sections in the cortex A) vehicle B) DAPI stained for nuclei C) composite image. In PRMT7-AAV overexpressed mice, there was robust GFP-tagged PRMT7-AAV expression within the neurons of the D) cortex, E) DAPI for nuclei, F) composite image. The hippocampus revealed the same trend with no GFP expression in the G) vehicle-treated mice, H) DAPI, I) composite, as compared to the J) GFP-PRMT7 AAV treated mice, K) DAPI, L) composite image. Scale bar = 100 μm.
Fig. 3.
Fig. 3.
Brain PRMT7 protein levels and activity (via MMA) were decreased after rmTBI in C57BL/6 J mice, but enhanced with PRMT7-AAV. A) Protein expression of PRMT7 was reduced 3 and 7 days post-rmTBI (blue bars) relative to SHAM (white bar). B) Reduced expression of PRMT7 in rmTBI mice also had reduced levels of mono-methylarginine (MMA = PRMT7 enzymatic end-product) (blue bars) as compared to SHAM (white bar). C) Overexpression of PRMT7 via PRMT7-AAV was confirmed in all AAV groups (green bar/black lines) and was significantly higher as compared to SHAM mice (black line) without PRMT7-AAV. D) Overexpression of PRMT7-AAV resulted in higher PRMT7 activity, as higher MMA (MMA = PRMT7 enzymatic end-product) was present in all AAV groups (green bar/black lines) v. no AAV SHAM group (black line). In Figs. 3 C & D, all data were calculated based on SHAM group represented by a solid black line. Proteins were measured by capillary-based immunoassay and normalized to total protein. Computer software generated pseudo-blots are presented below each of the corresponding protein graphs where applicable. *p ≤ 0.05, **p ≤ 0.001 vs. SHAM, via one-way ANOVA followed by Tukey’s post-hoc analysis. (For interpretation of the references to colour in this figure legend, the reader is referred to the web version of this article.)
Fig. 4.
Fig. 4.
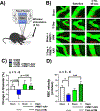
Overexpression of PRMT7-AAV prevented neurovascular uncoupling 3 days post-rmTBI in C57BL/6J mice. A) Neurovascular coupling was evaluated based on vascular tonicity changes in response to whisker stimulation (30 s, 4 Hz) concurrent with two-photon laser scanning microscopy. B) Representative images of cortical microvessel visualization via intravenous FITC-dextran injection (Z = 100 μm depth). The thin-skulled procedure produced a circular cranial window ~2 mm from the bregma and 2 mm from the centerline of the skull. C) Microvessel diameters were measured before/after whisker stimulation in SHAM mice (white bars), 3 days post-rmTBI in mice without (blue bars), SHAM + PRMT7-AAV mice (green bar), and in 3 days post-rmTBI mice + PRMT7-AAV (green bars/black lines). The 3 day rmTBI mice (blue bar) had decreased vessel diameter in response to whisker stimulation contrary to their SHAM counterparts (white bar). Microvessel diameters were increased in rmTBI mice (green bar/black lines) with PRMT7-AAV overexpression to suggest recovery of neurovascular uncoupling. In addition, D) Red blood cell (RBC) velocity was significantly decreased 3 days post-rmTBI (blue bar) relative to SHAM (white bar) but reversed to nominal levels in 3 day rmTBI + PRMT7-AAV (green bar/black lines). *p ≤ 0.05, ***p ≤ 0.001 determined via one-way ANOVA with Tukey’s post-hoc analysis. (For interpretation of the references to colour in this figure legend, the reader is referred to the web version of this article.)
Fig. 5.
Fig. 5.
Overexpression of PRMT7-AAV prevented blood-brain barrier leakage 3 days post-rmTBI in C57BL/6J mice. A) Schematic representation of the experimental paradigm. B) Representative images of FITC used to visualize brain micro vessels and measure leakage into the perivascular space. C) Higher levels of extravascular low molecular weight (40 kDa) FITC were detected in 3 days post-rmTBI mice (blue bar), relative to sham (white bar) and sham PRMT7-AAV (green bar). PRMT7-AAV overexpression was able to rescue BBB leakage as indicated by the significant reduction in FITC extravasation 3 days post-rmTBI (green bar/black lines) relative to 3 day post-rmTBI mice with no virus. Fluorescence intensity was measured 30 min post-injection within the perivascular region of interest (ROI, red box). At least 3–4 ROIs were analyzed per animal. *p ≤ 0.05, ****p ≤ 0.0001, evaluated by one-way ANOVA with Tukey’s post-hoc analysis. (For interpretation of the references to colour in this figure legend, the reader is referred to the web version of this article.)
Fig. 6.
Fig. 6.
Overexpression of PRMT7-AAV enhanced occludin protein levels post-rmTBI in C57BL/6J mice. A) Occludin levels exhibited trending decreases in the cortex at 3 and 7 days post-rmTBI (blue bars) relative to SHAM (white bar). PRMT7-AAV overexpression significantly elevated occludin protein levels (green bar/black lines). B) ZO-1 protein expression was unchanged in the cortex, while no changes in occludin levels were observed in the C) hippocampus. ZO-1 was significantly upregulated in the D) hippocampus at 3 days post-rmTBI with no virus (blue bar) relative to SHAM (white bar). Proteins were measured by capillary-based immunoassay and normalized to total protein. Computer software generated pseudo-blots are presented below each of the corresponding protein graphs when applicable. *p ≤ 0.05, **p ≤ 0.01, as evaluated by two-way ANOVA followed Tukey’s post-hoc analysis. (For interpretation of the references to colour in this figure legend, the reader is referred to the web version of this article.)
Fig. 7.
Fig. 7.
Leukocyte rolling velocity was enhanced in mice overexpressing PRMT 7 (via AAV) 3 days post-rmTBI. Two-photon laser scanning microscopy images of rolling leukocytes in microvessels at different time points are shown with A) a red circle with highlighted dot as the leukocyte and B) typical line-scans (512 lines/s) for the measurement of leukocytes labelled with acridine orange. C) 3 days post-rmTBI mice (blue bar) have significantly decreased leukocyte velocities (mm/s) as compared to aged-matched sham mice (white bar). PRMT7-AAV mice (green bar/black lines) had increased velocities at 3 days post-rmTBI v. 3 days post-rmTBI mice with no virus (blue bar). *p ≤ 0.05, **p ≤ 0.01, ***p ≤ 0.001. Evaluated by one-way ANOVA with Tukey’s post-hoc analysis. (For interpretation of the references to colour in this figure legend, the reader is referred to the web version of this article.)
Fig. 8.
Fig. 8.
Overexpression of PRMT7-AAV improved gliosis in hippocampus. PRMT7-AAV overexpressed mice were assessed for astrogliosis and microgliosis. A) There were trending increases in GFAP protein expression at 3 and 7 days post-rmTBI (blue bars) relative to SHAM (white bar). PRMT7-AAV overexpression revealed strong trending decreases in GFAP expression at 3 and 7 days post-rmTBI (green bar/black lines) relative to 3 and 7 days rmTBI mice with no virus. B) There were trending increases in iba1 levels in 3 and 7 days post-rmTBI mice (blue bars) relative to SHAM (white bar); accompanied by trending decreases in iba1 protein expression in 3 and 7 days + PRMT7-AAV overexpressed rmTBI mice (green bar/black lines) relative to 3 and 7 day rmTBI mice with no virus (blue bars). Proteins were measured by capillary-based immunoassay and normalized to total protein. Computer software generated pseudo-blots are presented below each of the corresponding protein graphs where applicable. *p ≤ 0.05 evaluated by one-way ANOVA with Tukey’s post-hoc analysis. (For interpretation of the references to colour in this figure legend, the reader is referred to the web version of this article.)
Fig. 9.
Fig. 9.
PRMT7-AAV enhanced mitochondrial reserve capacity in the CA1 region of the hippocampus. Oxygen consumption rates were measured at 1, 3 and 7 days post-rmTBI and the results suggest 3 days post-rmTBI had the most robust changes, therefore, we intervened at day 3 with PRMT7-AAV. A) Tracing of oxygen consumption rates (OCR) of each time point SHAM (white) 3 day (blue) SHAM + PRMT7-AAV (green) 3 days post-rmTBI + PRMT7-AAV overexpression (green bar/black lines). B) While we observed no significant changes in maximal respiration, C) reserve capacity was significantly enhanced with overexpression of PRMT7-AAV + 3 days post-rmTBI (green bar/black lines) relative to SHAM (white bar), 3 days post-rmTBI (blue bar), and SHAM + PRMT7-AAV (green bar). In addition, there were no changes in D) proton-leak-linked respiration or E) basal respiration. F) ATP-linked respiration was reduced at 3 days post-rmTBI + PRMT7-AAV (green bar/black lines) relative to 3 days post-rmTBI mice + no virus (blue bar). G) ATP production was significantly decreased at 3 days post-rmTBI + PRMT7-AAV (green bar/black lines) relative to 3 day rmTBI mice + no virus (blue bar). Results were expressed as mean ± SEM. *p ≤ 0.05, evaluated by one-way ANOVA with Tukey’s post-hoc test (n = 4–6). (For interpretation of the references to colour in this figure legend, the reader is referred to the web version of this article.)
Fig. 10.
Fig. 10.
PRMT7-AAV normalized mitochondrial fission and fusion dynamics after rmTBI in C57BL/6 J mice. Fission (DRP1) and fusion (OPA1) mitochondrial markers were assessed in the cortex and hippocampus. A) DRP1 protein levels were unchanged in the cortex, while B) OPA1 protein levels were decreased in the cortex at 7 days post rmTBI (blue bar) relative to SHAM (no virus – white bar), whereas PRMT7-AAV (green bar/black lines) increased OPA1 to nominal levels as compared to 7 days post-rmTBI mice + no virus (blue bars). C) DRP1 levels were lower in the hippocampus at 7 days post rmTBI (blue bar) relative to SHAM (white bar) and PRMT7-AAV enhanced DRP1 levels at 7 days post-rmTBI (green bar/black lines) relative 7 days post-rmTBI + no virus (blue bar). Lastly, D) OPA1 levels were reduced in 7 days rmTBI mice (blue bar) relative to SHAM (white bar) and enhanced to control levels with the administration of PRMT7-AAV (green bar/black lines). Proteins were measured by capillary-based immunoassay and normalized to total protein. Computer software generated pseudo-blots are presented below each of the corresponding protein graphs when applicable. *p ≤ 0.05, **p ≤ 0.01, ***p ≤ 0.001; as evaluated by two-way ANOVA followed by Tukey’s post-hoc analysis.

References

    1. Acosta CH, Clemons GA, Citadin CT, Carr WC, Udo MSB, Tesic V, Lin HW, 2023. A role for protein arginine methyltransferase 7 in repetitive and mild traumatic brain injury. Neurochem. Int 105524 10.1016/j.neuint.2023.105524. - DOI - PMC - PubMed
    1. Agolini E, Dentici ML, Bellacchio E, Alesi V, Radio FC, Torella A, Novelli A, 2018. Expanding the clinical and molecular spectrum of PRMT7 mutations: 3 additional patients and review. Clin. Genet 93 (3), 675–681. 10.1111/cge.13137. - DOI - PubMed
    1. Ahn BY, Jeong MH, Pyun JH, Jeong HJ, Vuong TA, Bae JH, Kang JS, 2022. PRMT7 ablation in cardiomyocytes causes cardiac hypertrophy and fibrosis through beta-catenin dysregulation. Cell. Mol. Life Sci 79 (2), 99. 10.1007/s00018-021-04097-x. - DOI - PMC - PubMed
    1. Babcock KJ, Abdolmohammadi B, Kiernan PT, Mahar I, Cherry JD, Alvarez VE, Huber BR, 2022. Interface astrogliosis in contact sport head impacts and military blast exposure. Acta Neuropathol. Commun 10 (1), 52. 10.1186/s40478-022-01358-z. - DOI - PMC - PubMed
    1. Balasubramanian N, Jadhav G, Sakharkar AJ, 2021. Repeated mild traumatic brain injuries perturb the mitochondrial biogenesis via DNA methylation in the hippocampus of rat. Mitochondrion 61, 11–24. 10.1016/j.mito.2021.09.001. - DOI - PubMed

Publication types

Substances