. 2023 Aug;23(8):1209-1220.
doi: 10.1016/j.ajt.2023.05.005. Epub 2023 May 16.

Increased volume of organ offers and decreased efficiency of kidney placement under circle-based kidney allocation

Affiliations

Increased volume of organ offers and decreased efficiency of kidney placement under circle-based kidney allocation

David C Cron et al. Am J Transplant. 2023 Aug.

Abstract

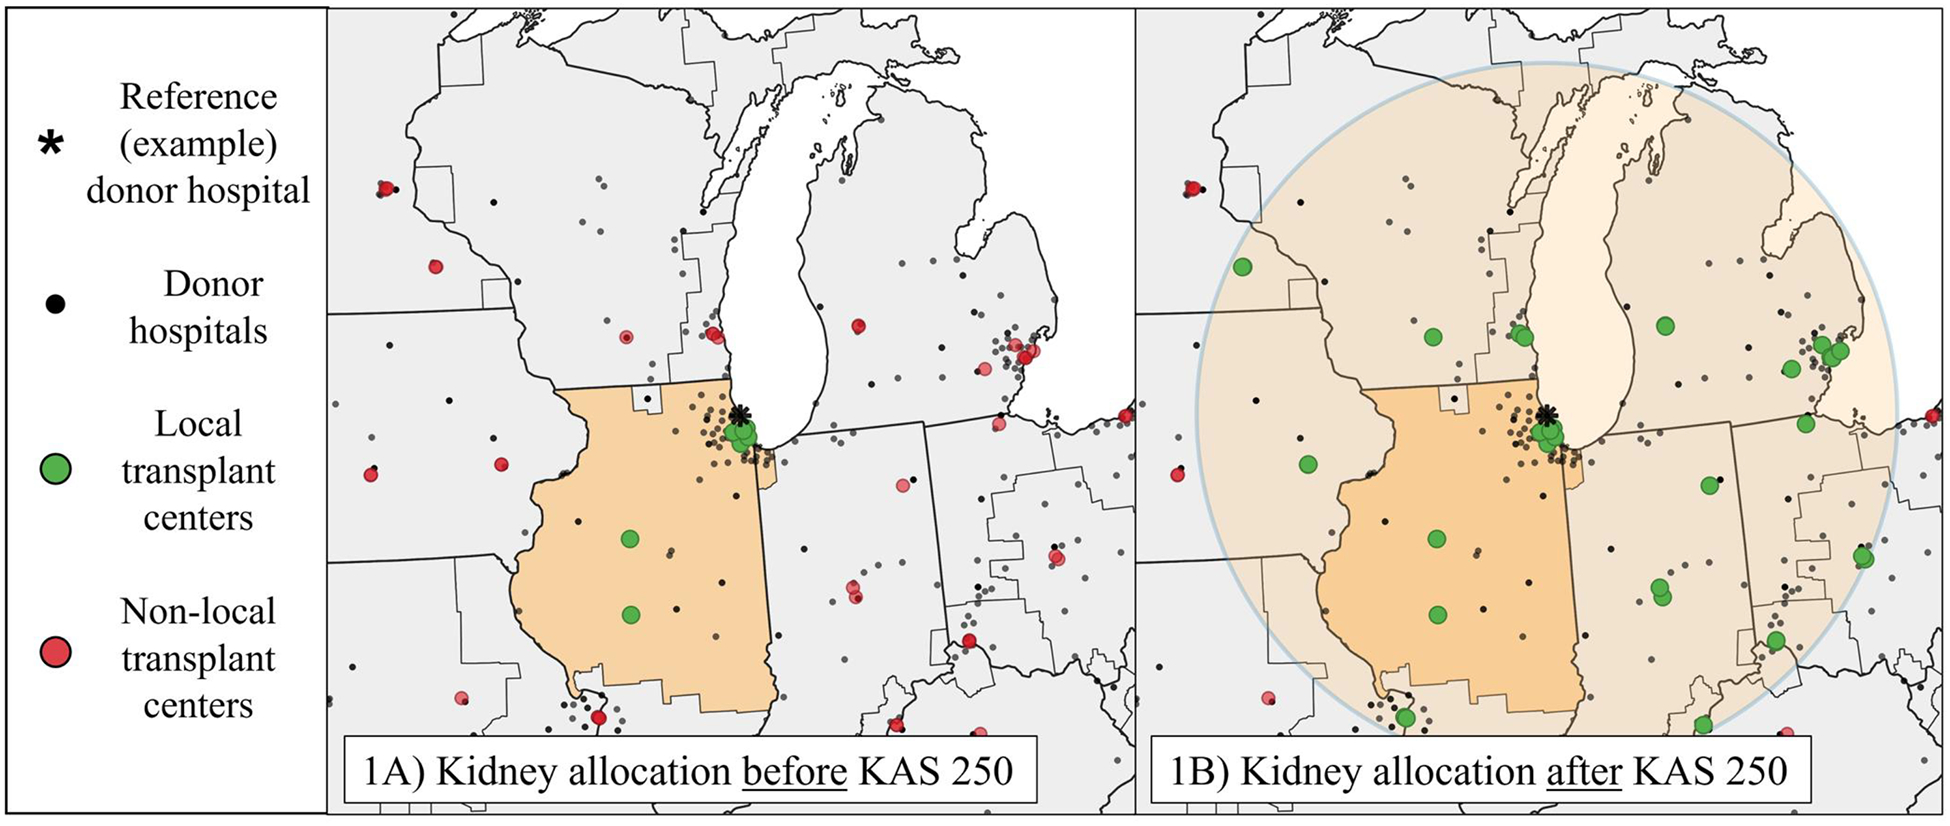
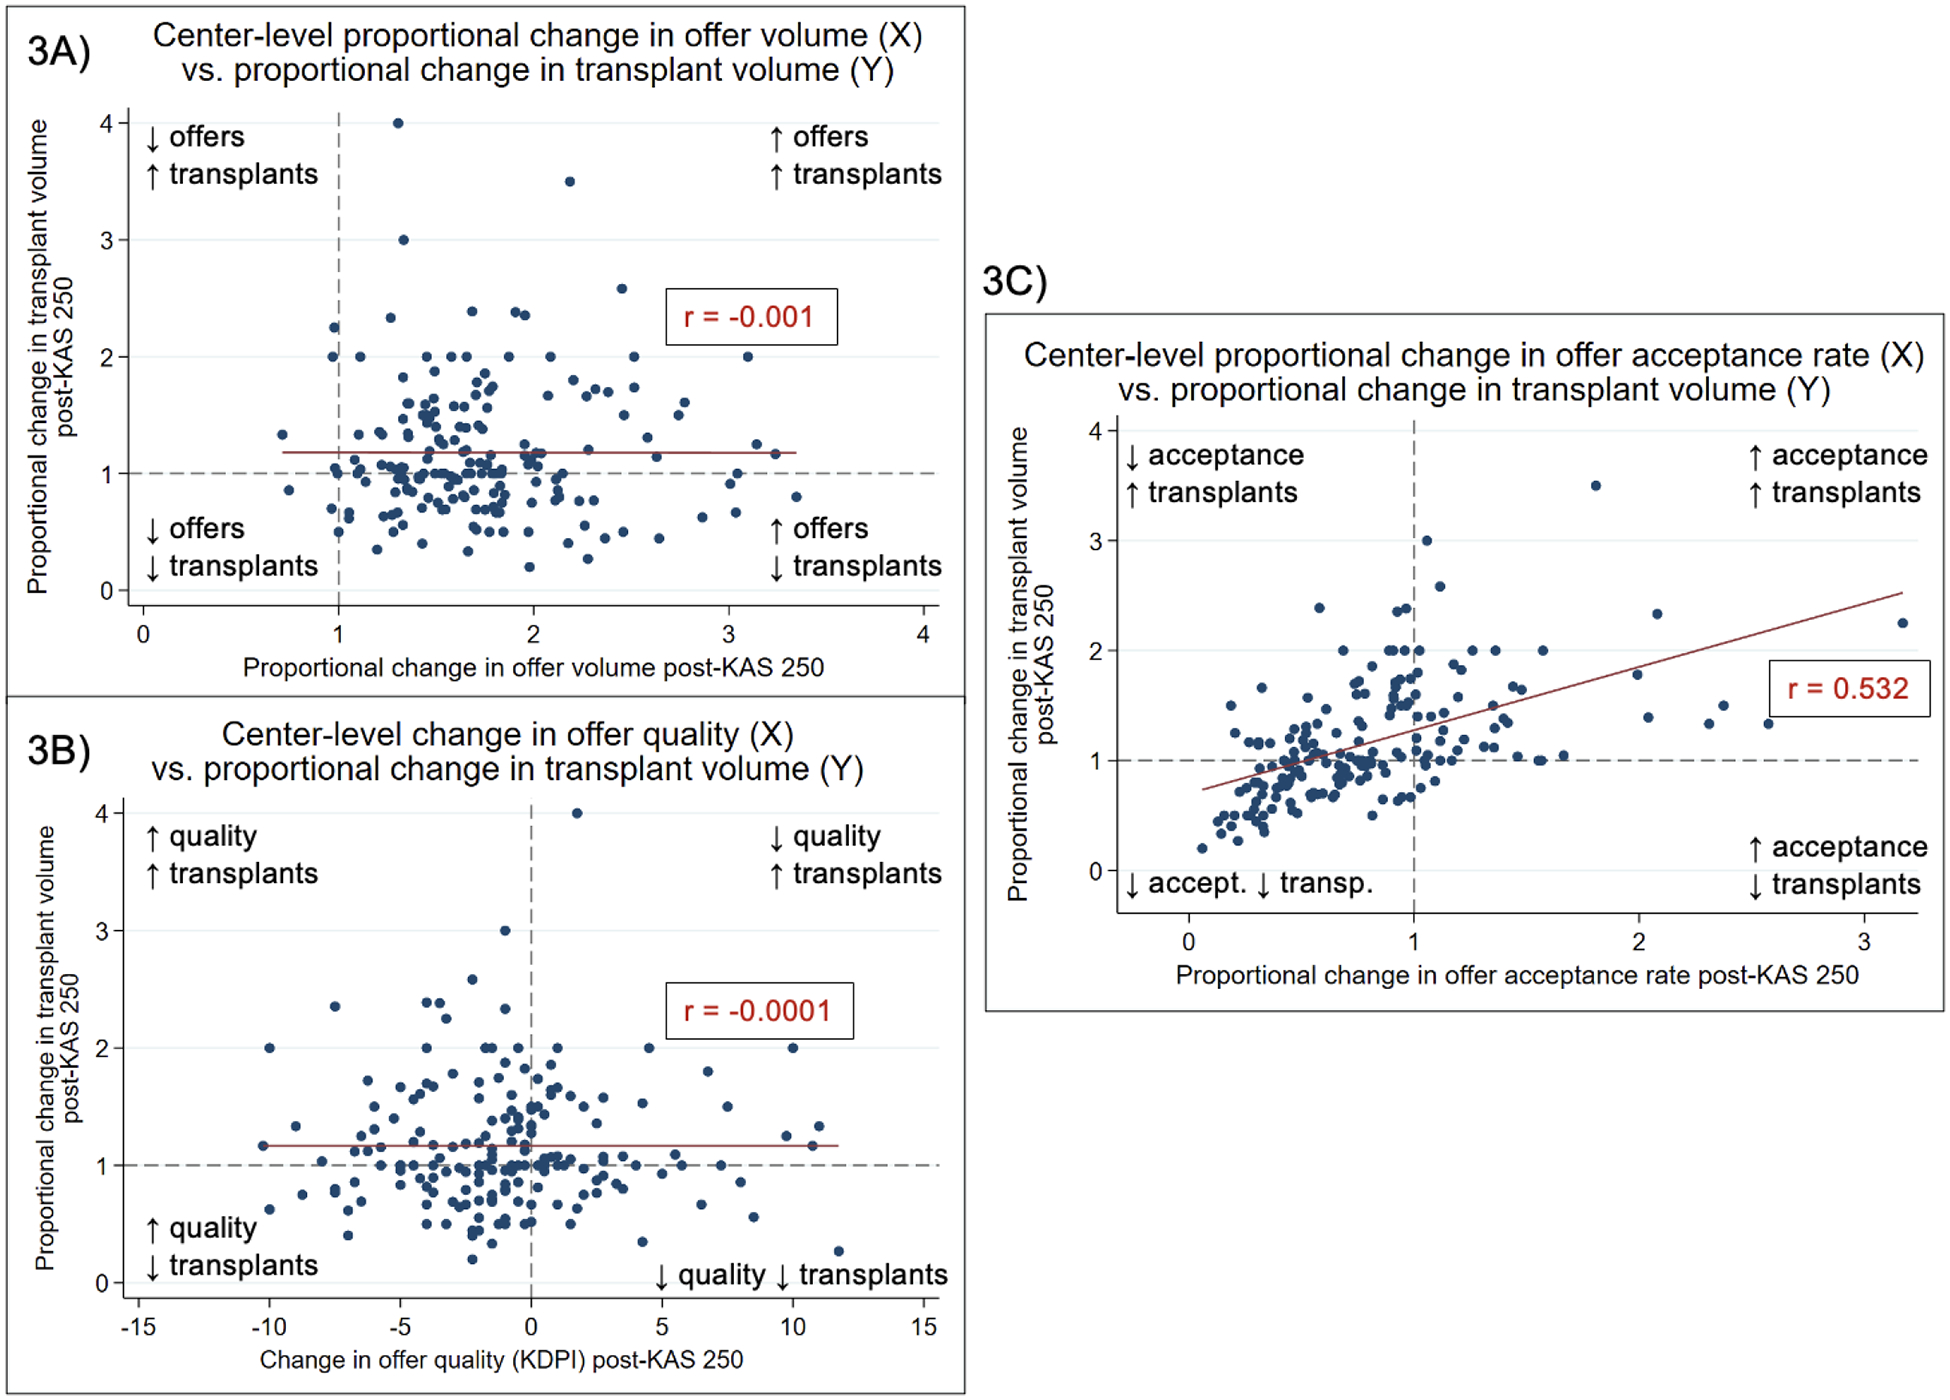
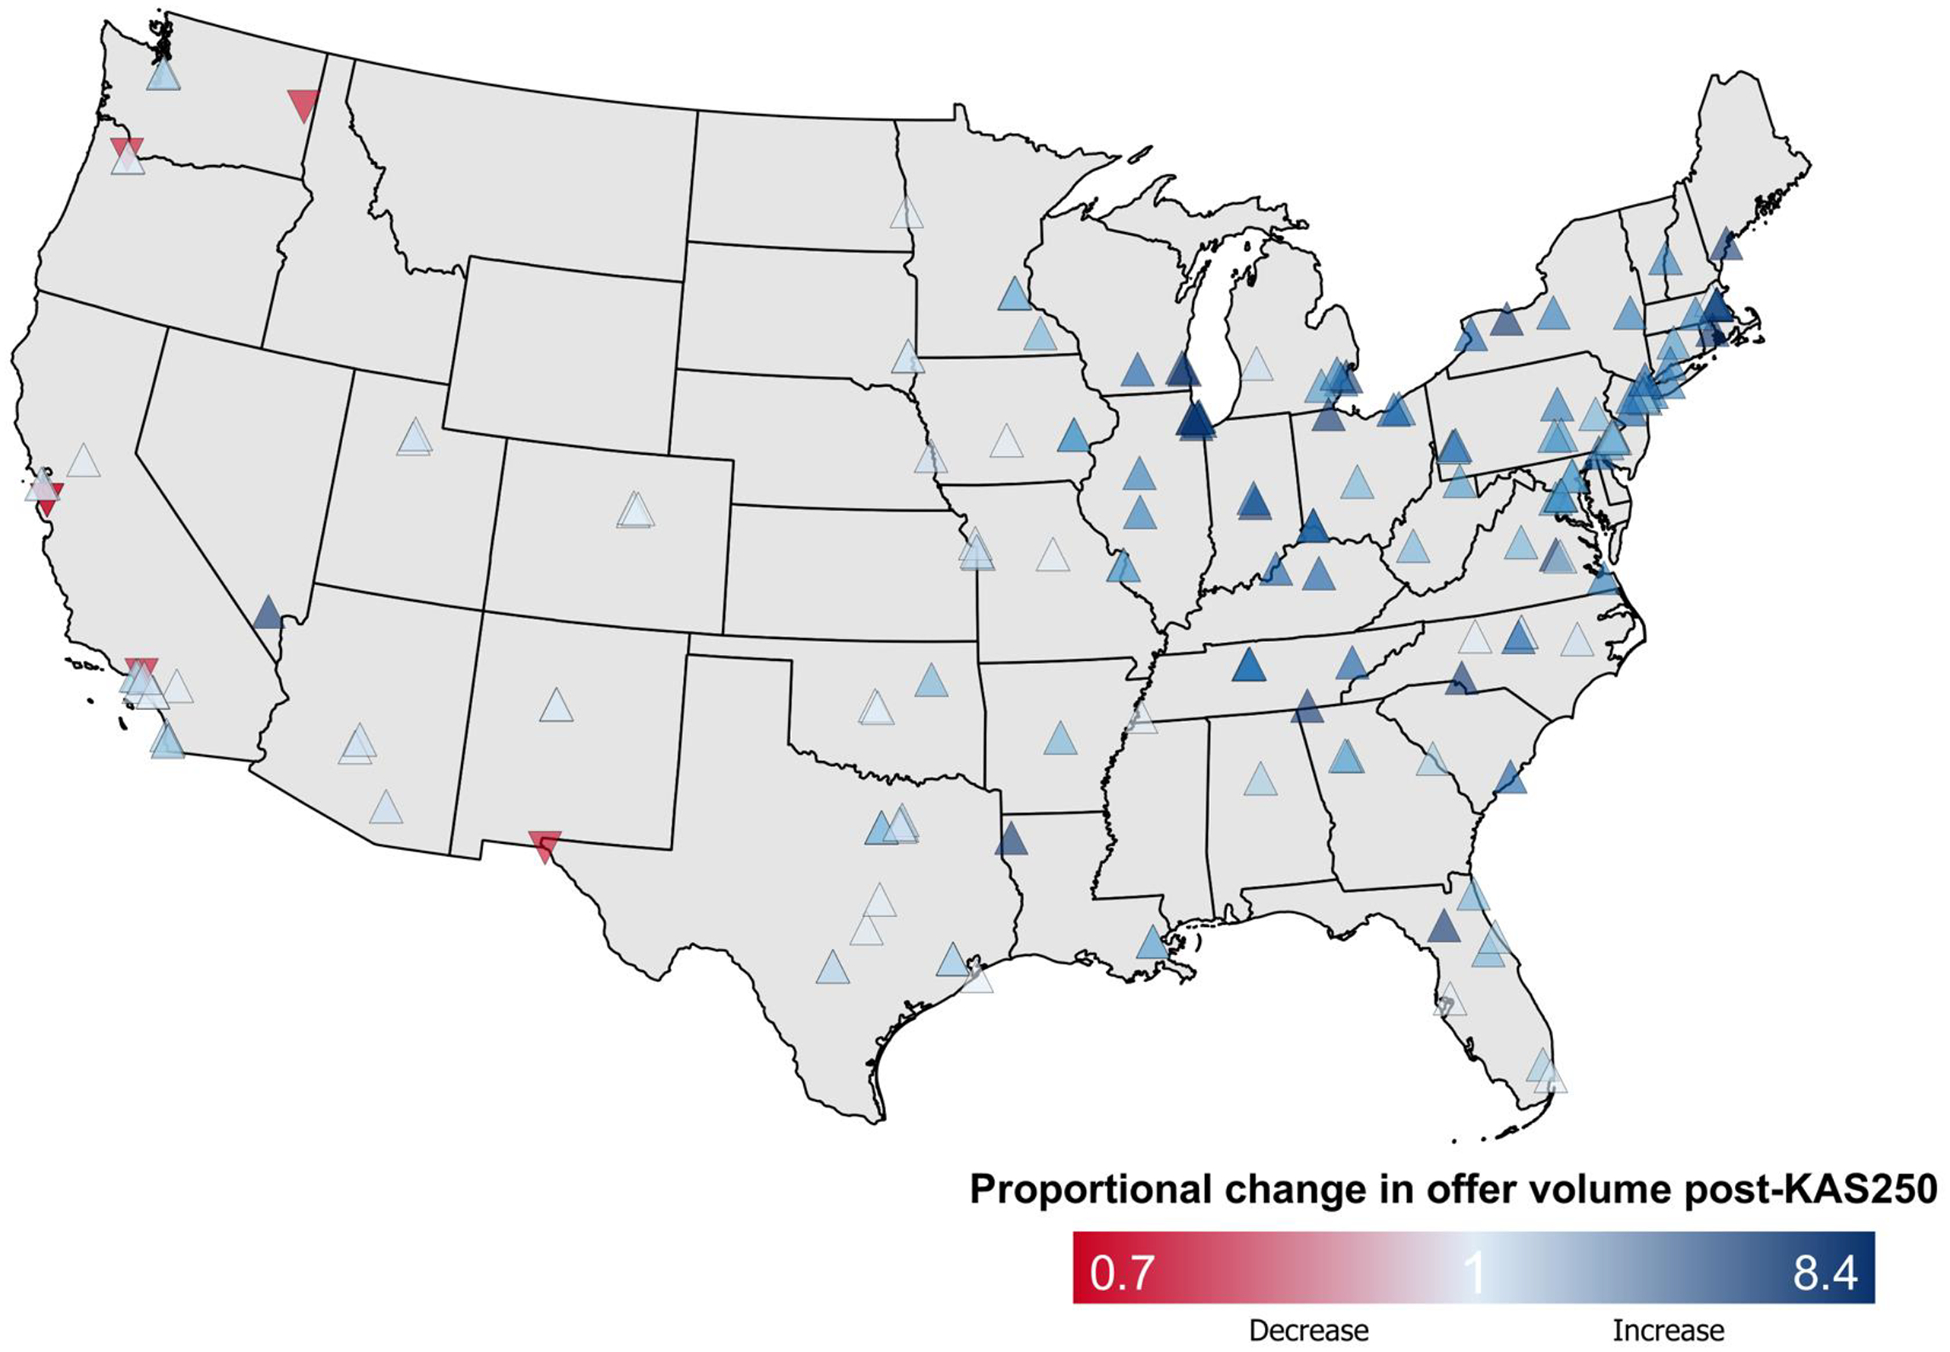
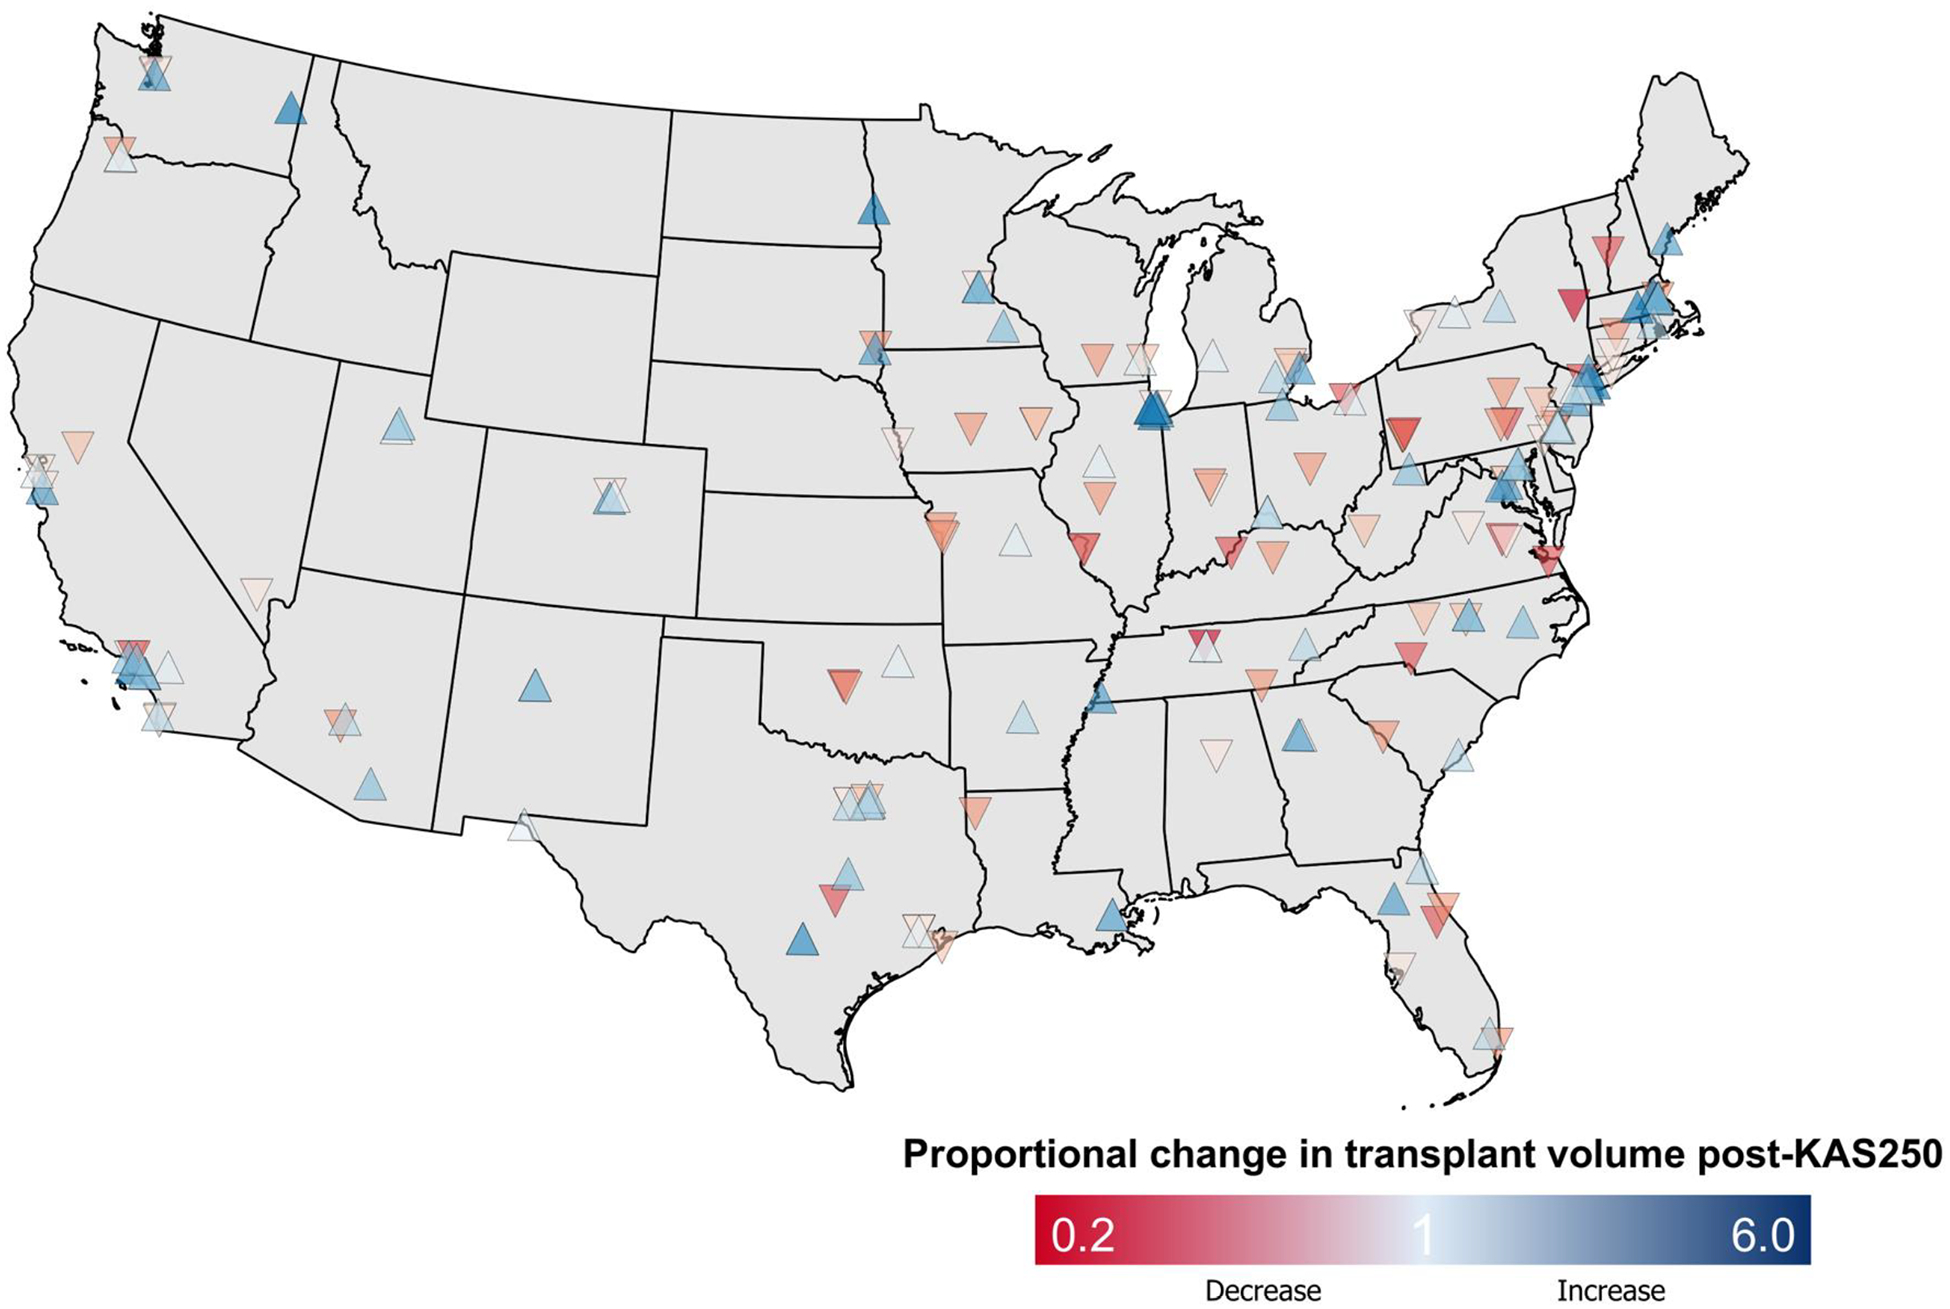
The newest kidney allocation policy kidney allocation system 250 (KAS250) broadened geographic distribution while increasing allocation system complexity. We studied the volume of kidney offers received by transplant centers and the efficiency of kidney placement since KAS250. We identified deceased-donor kidney offers (N = 907,848; N = 36,226 donors) to 185 US transplant centers from January 1, 2019, to December 31, 2021 (policy implemented March 15, 2021). Each unique donor offered to a center was considered a single offer. We compared the monthly volume of offers received by centers and the number of centers offered before the first acceptance using an interrupted time series approach (pre-/post-KAS250). Post-KAS250, transplant centers received more kidney offers (level change: 32.5 offers/center/mo, P < .001; slope change: 3.9 offers/center/mo, P = .003). The median monthly offer volume post-/pre-KAS250 was 195 (interquartile range 137-253) vs. 115 (76-151). There was no significant increase in deceased-donor transplant volume at the center level after KAS250, and center-specific changes in offer volume did not correlate with changes in transplant volume (r = -0.001). Post-KAS250, the number of centers to whom a kidney was offered before acceptance increased significantly (level change: 1.7 centers/donor, P < .001; slope change: 0.1 centers/donor/mo, P = .014). These findings demonstrate the logistical burden of broader organ sharing, and future allocation policy changes will need to balance equity in transplant access with the operational efficiency of the allocation system.

Keywords: allocation policy; broader distribution organ offer; concentric circle; kidney allocation system; kidney offer; kidney transplant; transplant center.


Conflict of interest statement

Declaration of Competing Interest The authors declare the following financial interests/personal relationships which may be considered as potential competing interests: Dr. Adler reports personal fees from Tegus and grants from AHRQ. Dr. Mohan reports personal fees for eGenesis and Kidney International Reports, grants from the NIH and Kidney Transplant Collaborative, serving as chair of the UNOS data advisory committee and as faculty cochair for the ESRD Treatment Choices Learning Collaborative outside of the submitted work. Dr. Husain reported receiving grants personal fees from Fresenius and grants from NIH outside of the submitted work.

Figures

Figure 1A and 1B:
Figure 1A and 1B:. Geographic distribution of deceased-donor kidneys under the previous compared to new kidney allocation systems.
KAS 250 = Kidney Allocation System 250 – the newest policy change to broader sharing. The asterisk indicates a reference donor hospital for this example. Before KAS 250 (1A), donor kidneys originating from that hospital would be allocated “locally first” to transplant centers (green circles, N=9) within that hospital’s donor service area (yellow shaded area). Red circles indicate non-local transplant centers, who would typically only receive kidney offers in this instance if they had been first declined by all local centers. After KAS 250 (1B), kidneys from the reference donor hospital are now allocated “locally first” to any transplant centers (green circles, N=40) within a 250 nautical mile circle around the reference donor hospital. Prioritization is given to centers closest to the donor hospital within the 250 mile circle.
Figures 2A and 2B:
Figures 2A and 2B:. Trends in transplant center-specific deceased-donor kidney offer and transplant volume, and efficiency of kidney placement, relative to implementation of kidney allocation policy change.
KAS 250= Kidney Allocation System 250 – the newest policy change to broader sharing. 2A shows the trend over time in the median number of deceased-donor kidney offers received (blue dots, red trend line), and deceased-donor kidney transplants performed (red dots, blue trend line), per transplant center per month. The dashed vertical line indicates the implementation date of KAS 250 (March 15, 2021). 2B shows the trend over time in the median number of transplant centers to whom a deceased-donor is offered before its first kidney is accepted.
Figures 3A-C:
Figures 3A-C:. Association between center-level changes in deceased-donor kidney transplant volume and kidney offer volume (A), quality of kidneys offered (B), and kidney offer acceptance (C).
KAS 250= Kidney Allocation System 250 – the newest policy change to broader sharing. Each dot indicates one of 185 transplant centers. The y-axis for each plot represents the transplant center-level proportional change in deceased-donor kidney transplant volume in the 9 months after KAS 250 compared to the equivalent 9-month period before KAS 250. The x-axes represent the center-level proportional change in deceased donor kidney offer volume (3A), absolute change in quality of kidney offers received (3B; quality defined by kidney donor profile index, KDPI, with higher numbers indicated lower expected graft longevity), and proportional change in offer acceptance rate (3C) after KAS 250. Outliers were removed from these plots if they were more than 3 standard deviations from the mean (number of centers removed: 2 from 3A, 3 from 3B, 4 from 3C).
Figure 4A:
Figure 4A:. Location of US kidney transplant centers and their proportional change in deceased-donor kidney offer volume after KAS 250.
Alaska, Puerto Rico, and Hawaii are not depicted here; allocation rules are different in these areas. Each arrow represents a transplant center. Upward facing arrows indicate an increase in offer volume after KAS250, with darker blue indicating a greater increase. Downward facing arrows indicate a decrease in offer volume after KAS250, with darker red indicating a greater decrease.
Figure 4B:
Figure 4B:. Location of US kidney transplant centers and their proportional change in deceased-donor kidney transplant volume after KAS 250.
Alaska, Puerto Rico, and Hawaii are not depicted here; allocation rules are different in these areas. Each arrow represents a transplant center. Upward facing arrows indicate an increase in transplant volume after KAS250, with darker blue indicating a greater increase. Downward facing arrows indicate a decrease in transplant volume after KAS250, with darker red indicating a greater decrease.

References

    1. United States Renal Data System. 2020 USRDS Annual Data Report: Epidemiology of kidney disease in the United States. National Institutes of Health, National Institute of Diabetes and Digestive and Kidney Diseases, Bethesda, MD, 2020.
    1. Melanson TA, Hockenberry JM, Plantinga L, et al. New Kidney Allocation System Associated With Increased Rates Of Transplants Among Black And Hispanic Patients. Health Aff (Millwood). 2017;36(6):1078–1085. - PMC - PubMed
    1. Zhang X, Melanson TA, Plantinga LC, et al. Racial/ethnic disparities in waitlisting for deceased donor kidney transplantation 1 year after implementation of the new national kidney allocation system. Am J Transplant. 2018;18(8):1936–1946. - PMC - PubMed
    1. Zhou S, Massie AB, Luo X, et al. Geographic disparity in kidney transplantation under KAS. Am J Transplant. 2018;18(6):1415–1423. - PMC - PubMed
    1. King KL, Husain SA, Mohan S. Geographic Variation in the Availability of Deceased Donor Kidneys per Wait-Listed Candidate in the United States. Kidney international reports. 2019;4(11):1630–1633. - PMC - PubMed

Publication types

LinkOut - more resources