. 2023 Aug;165(2):374-390.
doi: 10.1053/j.gastro.2023.04.038. Epub 2023 May 15.

Apposition of Fibroblasts With Metaplastic Gastric Cells Promotes Dysplastic Transition

Affiliations

Apposition of Fibroblasts With Metaplastic Gastric Cells Promotes Dysplastic Transition

Su-Hyung Lee et al. Gastroenterology. 2023 Aug.

Abstract

Background & aims: Elements of field cancerization, including atrophic gastritis, metaplasia, and dysplasia, promote gastric cancer development in association with chronic inflammation. However, it remains unclear how stroma changes during carcinogenesis and how the stroma contributes to progression of gastric preneoplasia. Here we investigated heterogeneity of fibroblasts, one of the most important elements in the stroma, and their roles in neoplastic transformation of metaplasia.

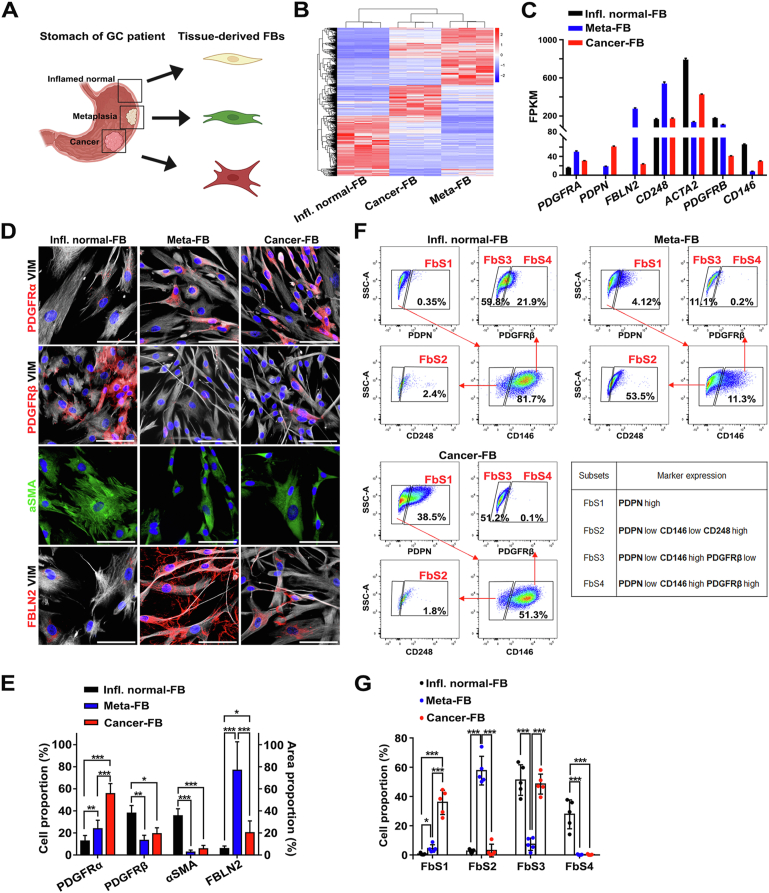
Methods: We used single-cell transcriptomics to evaluate the cellular heterogeneity of mucosal cells from patients with gastric cancer. Tissue sections from the same cohort and tissue microarrays were used to identify the geographical distribution of distinct fibroblast subsets. We further evaluated the role of fibroblasts from pathologic mucosa in dysplastic progression of metaplastic cells using patient-derived metaplastic gastroids and fibroblasts.

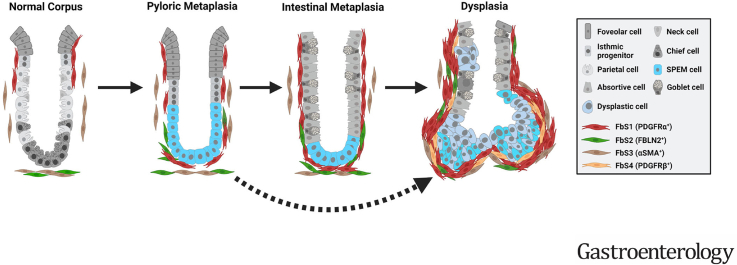
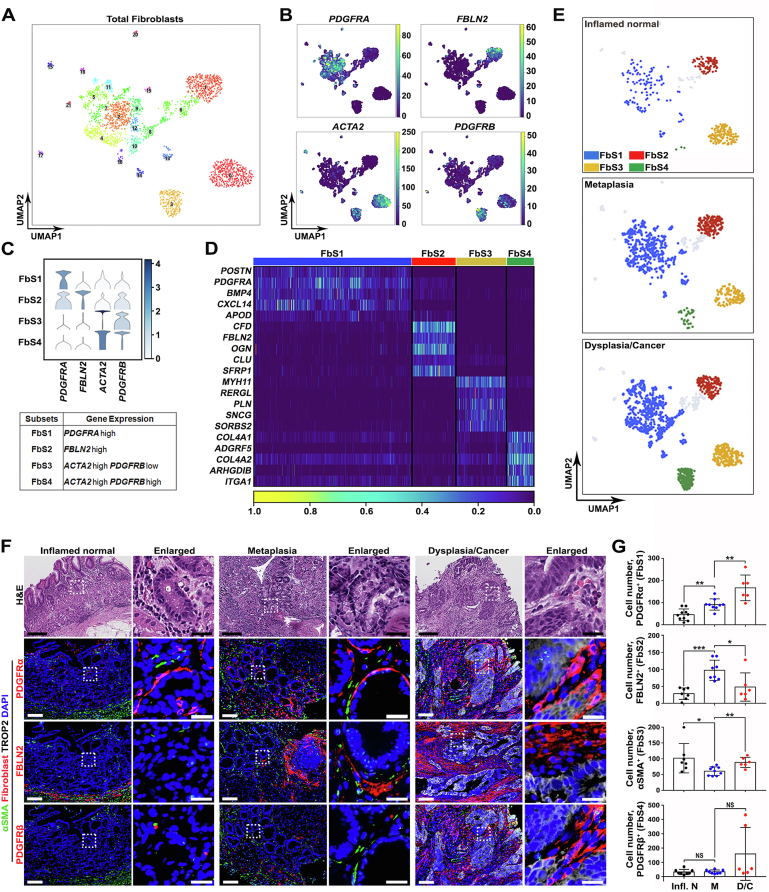
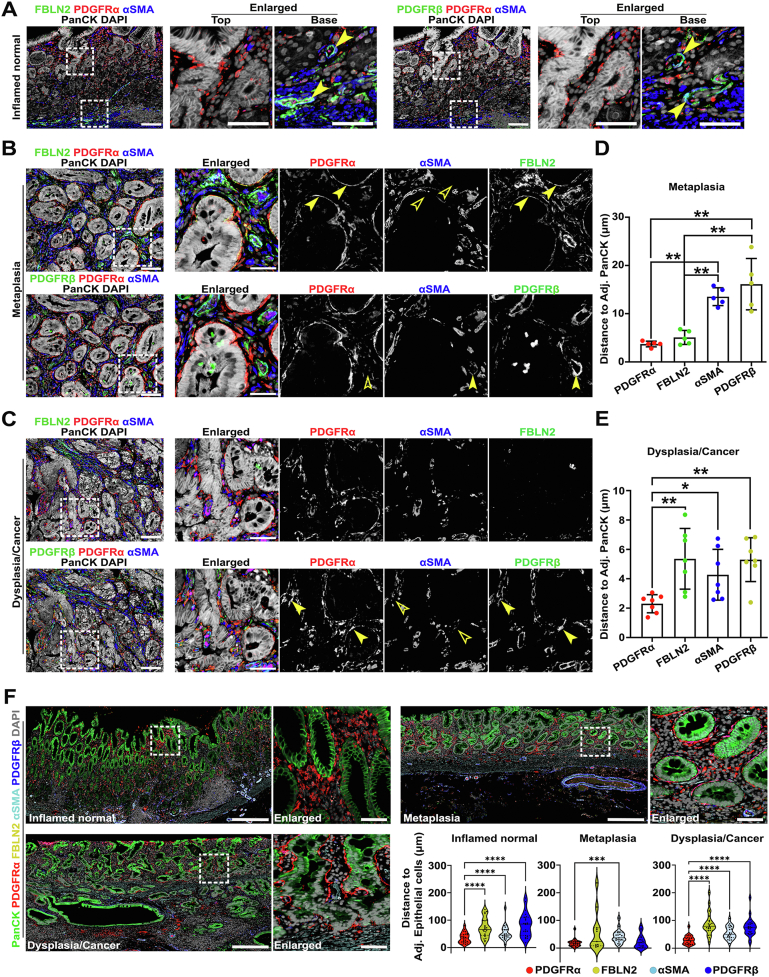
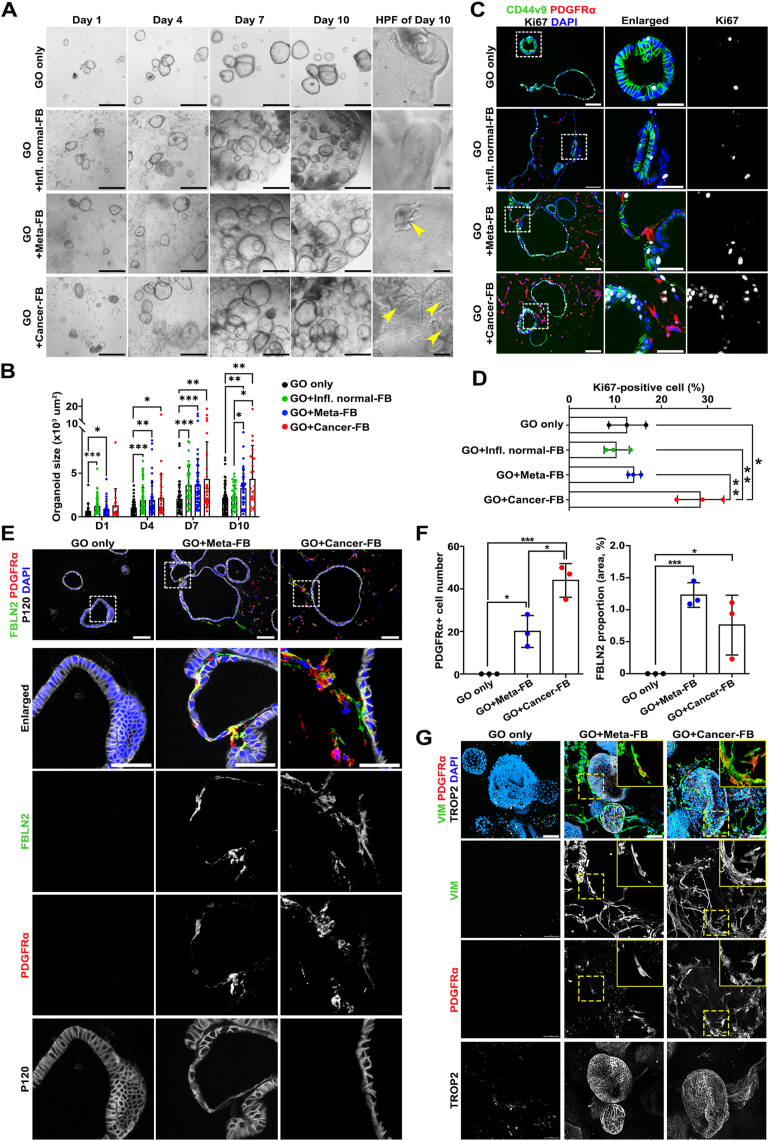
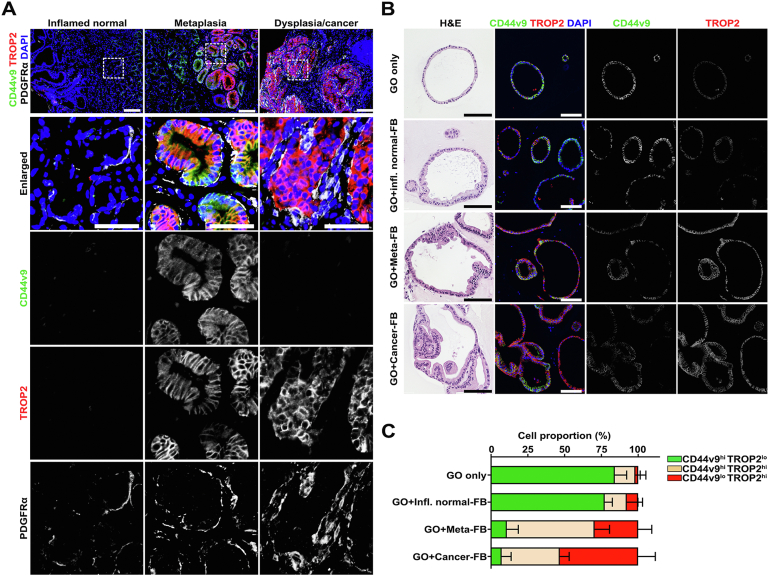
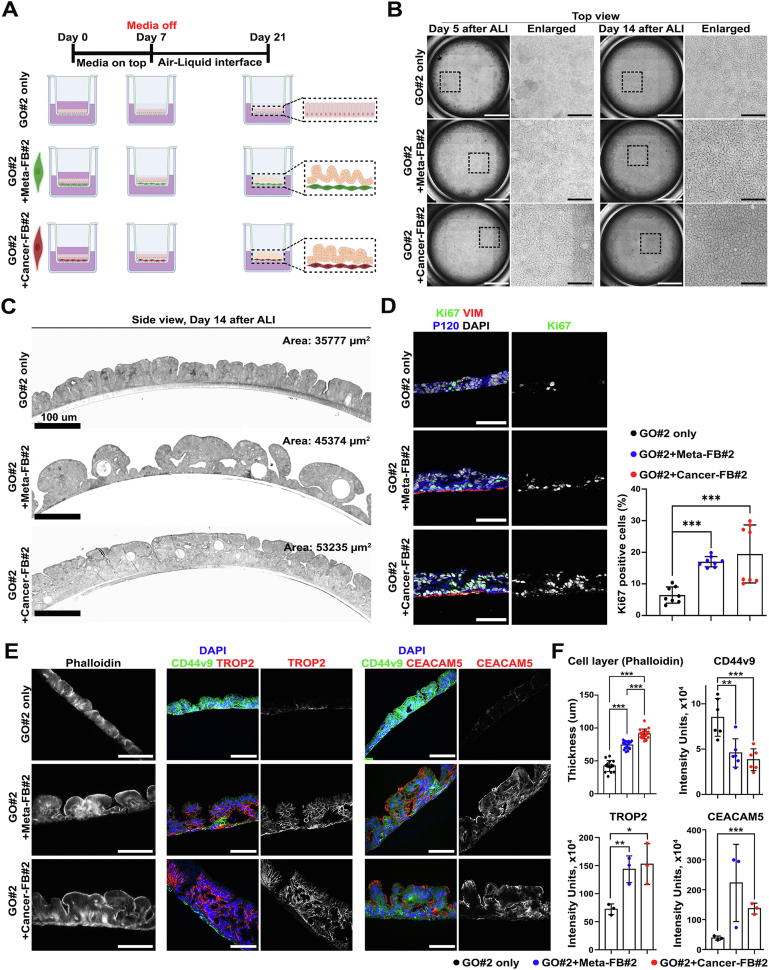
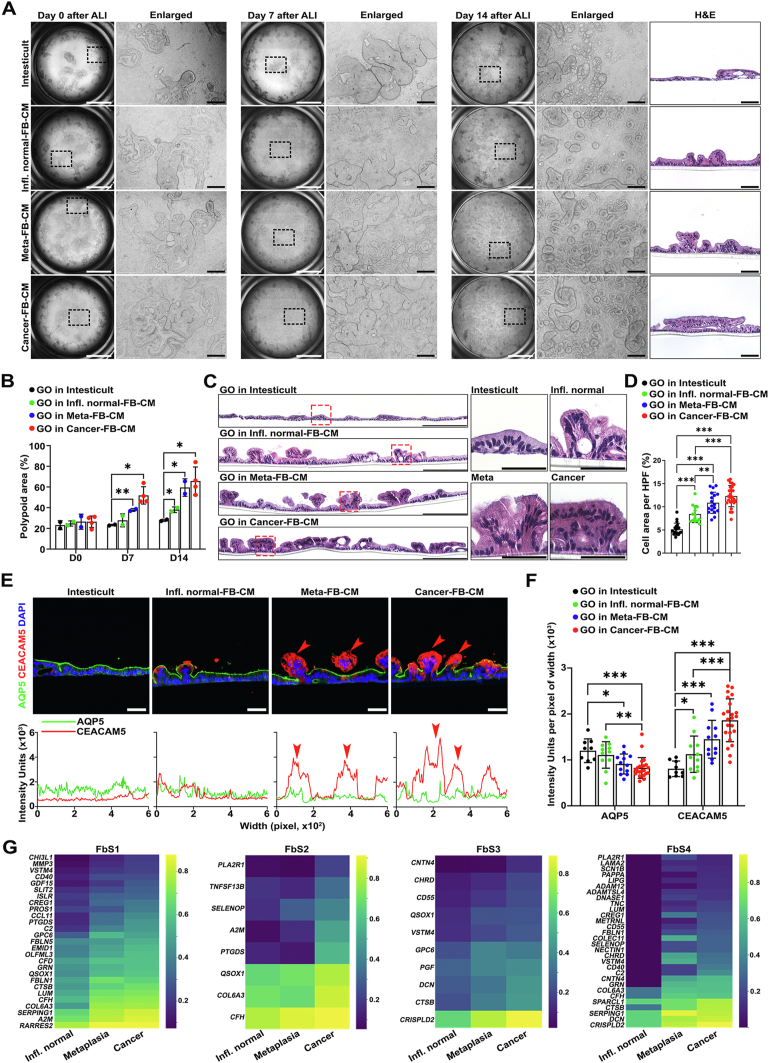
Results: We identified 4 subsets of fibroblasts within stromal cells defined by the differential expression of PDGFRA, FBLN2, ACTA2, or PDGFRB. Each subset was distributed distinctively throughout stomach tissues with different proportions at each pathologic stage. The PDGFRα+ subset expanded in metaplasia and cancer compared with normal, maintaining a close proximity with the epithelial compartment. Co-culture of metaplasia- or cancer-derived fibroblasts with gastroids showing the characteristics of spasmolytic polypeptide-expressing metaplasia-induced disordered growth, loss of metaplastic markers, and increases in markers of dysplasia. Culture of metaplastic gastroids with conditioned media from metaplasia- or cancer-derived fibroblasts also promoted dysplastic transition.

Conclusions: These findings indicate that fibroblast associations with metaplastic epithelial cells can facilitate direct transition of metaplastic spasmolytic polypeptide-expressing metaplasia cell lineages into dysplastic lineages.

Keywords: Fibroblasts; Gastric Carcinogenesis; Metaplasia; PDGFRA; SPEM.


Figures

None
Graphical abstract
Figure 1
Figure 1
scRNA-seq defines 4 different fibroblasts subsets (FbSs) with a distinct geographic distribution. (A) Uniform Manifold Approximation and Projection (UMAP) of 2709 fibroblasts in 21 color-coded clusters. Each dot in the UMAP indicates an individual cell. (B) UMAPs representing expression of selected markers for fibroblasts and myofibroblasts. Based on the marker genes, the total fibroblast population can be divided into 4 subsets. (C) Violin plot of normalized expression of PDGFRA, FBLN2, ACTA2, and PDGFRB in the different subsets; PDGFRAhi FbS1, FBLN2hi FbS2, ACTA2hiPDGFRBlo FbS3, and ACTA2hiPDGFRBhi FbS4. (D) Heatmap of selected genes enriched in each of the 4 FbSs according to scRNA-seq data. Columns indicate single cells. (E) UMAPs color-coded according to pathologic condition, based on the expression of PDGFRA, FBLN2, ACTA2, and PDGFRB. Representative images (F) and quantification (G) of immunofluorescence staining for PDGFRα for FbS1, FBLN2 for FbS2, αSMA for FbS3, PDGFRβ for FbS4, and dysplastic marker TROP2 with nuclear 4′,6-diamidino-2-phenylindole (DAPI) in gastric cancer patient–derived tissue sections of inflamed normal, metaplasia, or dysplasia/cancer regions. Data are presented as mean ± SD (n = 6–10 tissue sections of 7 patients). ∗P < .05; ∗∗P < .01; ∗∗∗P < .001. Scale bar: 100 μm and 20 μm for enlarged.
Figure 2
Figure 2
Multiplexed immunofluorescence staining revealed geographic distribution of FbSs during gastric carcinogenesis. (A–C) Representative images of immunofluorescence staining for PDGFRα for FbS1, FBLN2 for FbS2, αSMA for FbS3, PDGFRβ for FbS4 fibroblasts, and epithelial marker pan-cytokeratin (PanCK) with nuclear 4′,6-diamidino-2-phenylindole (DAPI) in human gastric cancer patientderived tissue sections. (A) Inflamed normal tissue. PDGFRα+ cells are present in the isthmus region of the corpus mucosa. Arrowheads indicate αSMA+ vascular structure with FBLN2 (left panel) or PDGFRβ (right panel) expression. (B) Metaplastic tissue. PDGFRα+ cells are observed in close apposition to metaplastic gland cells. Arrowheads in the upper panel indicate fibroblasts with strong PDGFRα+ staining and weaker FBLN2+ without αSMA expression (empty arrowheads) surrounding metaplastic glands. Arrowheads in the lower panel indicate αSMA+PDGFRβ+ vascular structures without PDGFRα expression (empty arrowheads). (C) Cancer tissue. PDGFRα+ cells are expanded between cancerous glands. Arrowheads in the lower panel indicate PDGFRα+PDGFRβ+ fibroblasts surrounding cancerous epithelial compartment without αSMA expression (empty arrowheads). Scale bar: 100 μm and 50 μm for enlarged. (D, E) Quantification of the distance between epithelial cells and neighboring FbSs in metaplastic (D) and cancer-bearing stomach tissues (E). Data are presented as mean ± SD (n = 5 patients). ∗P < .05; ∗∗P < .01. (F) Representative images and quantification of multiplexed immunofluorescence staining for PDGFRα, FBLN2, αSMA, and PDGFRβ cells and their relationship with epithelial cells (positive for PanCK, CD44v9, or TROP2) with nuclear 4′,6-diamidino-2-phenylindole (DAPI) staining from 3 human tissue microarray slides (n = 24 cores per each pathologic condition). ∗∗∗P < .001; ∗∗∗∗P < .0001. Scale bar: 500 μm and 50 μm for enlarged.
Figure 3
Figure 3
Specific pathologic condition-derived fibroblasts (FBs) have distinctive genetic characteristics and cell composition. (A) Schematic illustration of FB isolation from human gastric cancer (GC) patient samples. (B) Heatmap of differentially expressed genes (DEGs) in inflamed normal- (Infl. Normal-FB), metaplasia- (Meta-FB), and cancer-derived FBs (Cancer-FB). Rows and columns represent individual genes and replicates per each group, respectively. (C) Bar graph representing the normalized counts of selected marker genes in different lesion-derived FBs, confirmed by scRNA-seq data from human patient samples. Representative images (D) and quantification (E) of immunofluorescence staining for the markers for each FB subset in different lesion-derived FBs. Data are presented as mean ± SD (n = 4 independent experiments). ∗P < .05; ∗∗P < .01; ∗∗∗P < .001. Scale bar: 50 μm. Fluorescence-activated cell sorting plots showing the proportion of 4 FB subsets, described in the table, in different lesion-derived FB populations (F) and quantification (G). Data are presented as mean ± SD (n = 5 independent experiments). ∗P < .05; ∗∗∗P < .001.
Figure 4
Figure 4
Three-dimensional co-culture with metaplasia-derived and cancer-derived fibroblast (FB) enhances growth of metaplastic gastroids. (A) Representative brightfield images of gastroids (GOs) cultured for 10 days with or without FBs isolated from inflamed normal-, metaplastic-, or cancer-bearing mucosae. Arrowheads indicate budding formation. Scale bar: 500 μm and 100 μm for high-power field. (B) Quantification of GO size at each time point. Data are presented as mean ± SD (n = 20–90 organoids from 2 independent experiments). ∗P < .05; ∗∗P < .01; ∗∗∗P < .001. (C) Representative images of immunofluorescence staining for metaplasia marker CD44v9, PDGFRα for FbS1, and Ki67 for proliferative activity with nuclear 4′,6-diamidino-2-phenylindole (DAPI). (D) Quantification of proliferative GO cells. Data are presented as mean ± SD (n = 3 independent experiments). ∗P < .05; ∗∗P < .01. Representative images (E) and quantification (F) of immunofluorescence staining for FBLN2 for FbS2, PDGFRα for FbS1 and epithelial membrane marker P120 with nuclear DAPI. Data are presented as mean ± SD (n = 3 independent experiments). ∗P < .05; ∗∗∗P < .001. (G) Representative images of whole-mount staining for vimentin (VIM) for pan-FBs, PDGFRα for FbS1, and dysplasia marker TROP2 with nuclear DAPI. Boxes are enlarged insets showing VIM+PDGFRα+ FbS1 close by GOs.
Figure 5
Figure 5
Recruited metaplasia-derived and cancer-derived fibroblasts facilitate dysplastic progression in metaplastic gastroids (GOs). (A) Immunofluorescence staining in human stomach sections for metaplasia marker CD44v9, dysplasia marker TROP2, and FbS1 marker PDGFRα with nuclear 4′,6-diamidino-2-phenylindole (DAPI). Scale bar: 100 μm and 50 μm for enlarged. Representative images of immunofluorescence staining in GO sections for metaplasia marker CD44v9 and dysplasia marker TROP2 (B) and quantification of positive GO cells for each marker (C). Scale bar: 100 μm.
Figure 6
Figure 6
ALI co-culture demonstrates that metaplasia (Meta)- or cancer-derived fibroblasts (FBs) can induce dysplastic transition in precancerous metaplastic cells. (A) Schematic illustration of ALI co-culture of metaplastic gastroids (GOs) with Meta- or cancer-derived FBs for a total of 21 days (created with BioRender.com). Representative brightfield images (top view; B) and confocal images of plastic sections stained with toluidine blue (side view; C) of ALI co-culture of metaplastic GO cells with Meta- or cancer-derived FBs, both from patient 2. Scale bar: 2000 μm and 500 μm for enlarged. Note the multiple-layered disorganized cells after co-culture with Meta- or cancer-derived FBs in (C). (D) Representative images of immunofluorescence staining for proliferation marker Ki67, fibroblast marker vimentin (VIM), and epithelial membrane marker P120 with nuclear 4′,6-diamidino-2-phenylindole (DAPI) and quantification of Ki67-positive cells. Data are presented as mean ± SD (n = 8 images from 2 different sections). ∗∗∗P <.001. (E) Representative images of immunofluorescence staining for phalloidin to identify cell borders, metaplasia marker CD44v9, and dysplasia markers TROP2 or CEACAM5 with nuclear DAPI. Scale bar: 100 μm. Note the loss of CD44v9 and the gain of TROP2 and CEACAM5 expression when GO cells were cultured in the presence of Meta- or cancer-derived FBs. (F) Quantification of the thickness of GO cell layer determined by phalloidin staining and extent of protein marker expression measured by intensity units. Data are presented as mean ± SD (n = 5 or 3 of different sections for phalloidin or other markers, respectively). ∗P < .05; ∗∗P < .01; ∗∗∗P < .001.
Figure 7
Figure 7
ALI culture with fibroblast (FB)-derived conditioned media (CM) demonstrates that secreted factors from FBs can induce dysplastic transition in metaplastic (Meta) cells. (A) Representative brightfield images of ALI co-culture of Meta gastroid cells in CM from inflamed normal- (Infl. normal-), Meta-, or cancer-derived FBs at each time point, all from patient 2. Paired H&E images show morphologic differences in polyp formation. Scale bars: 2000 μm and 200 μm for enlarged or 100 μm for H&E. (B) Quantification of the proportion of projected area from the base of filters shown in (A). Data are presented as mean ± SD (n = 2 independent experiments composed of CM from inflamed normal-, Met-, or cancer-derived FBs from patient 2 and cancer-derived FB from patient 1). ∗P < 0.05; ∗∗P < 0.01. (C) Representative H&E images of an entire filter of each ALI culture condition. Red boxes are enlarged on the right side, demonstrating morphologic alterations and different cell density in the polyps for each condition. Scale bars: 200 μm and 50 μm for enlarged. (D) Quantification of the area occupied with gastroid cells under high-power fields. Data are presented as mean ± SD (n = 2 independent experiments). ∗∗P < 0.01; ∗∗∗P < .001. (E) Representative images of immunofluorescence staining for metaplasia marker AQP5 and dysplasia marker CEACAM5 with nuclear 4′,6-diamidino-2-phenylindole (DAPI) and matched profiling of the expression of 2 markers. Arrowheads indicate polyps expressing CEACAM5. Scale bars: 50 μm. (F) Quantification of the staining shown in (E), presenting total expression levels for the 2 markers in each condition. Data are presented as mean ± SD (n = 2 independent experiments). ∗P < .05; ∗∗P < .01; ∗∗∗P < .001. (G) Heatmaps of up-regulated genes in each FB subset from metaplasia- or cancer-bearing tissues compared with the same subset from inflamed normal tissues, derived from the candidate genes described in Supplementary Figure 13B–E.

References

    1. Correa P. Human gastric carcinogenesis: a multistep and multifactorial process-first American Cancer Society Award Lecture on Cancer Epidemiology and Prevention. Cancer Res. 1992;52:6735–6740. - PubMed
    1. Tan P., Yeoh K.G. Genetics and molecular pathogenesis of gastric adenocarcinoma. Gastroenterology. 2015;149:1153–1162.e3. - PubMed
    1. Correa P. A human model of gastric carcinogenesis. Cancer Res. 1988;48:3554–3560. - PubMed
    1. Schmidt P.H., Lee J.R., Joshi V., et al. Identification of a metaplastic cell lineage associated with human gastric adenocarcinoma. Lab Invest. 1999;79:639–646. - PubMed
    1. Shao L., Li P., Ye J., et al. Risk of gastric cancer among patients with gastric intestinal metaplasia. Int J Cancer. 2018;143:1671–1677. - PubMed

Publication types