Collagen X Is Dispensable for Hypertrophic Differentiation and Endochondral Ossification of Human iPSC-Derived Chondrocytes
- PMID: 37197316
- PMCID: PMC10184020
- DOI: 10.1002/jbm4.10737
Collagen X Is Dispensable for Hypertrophic Differentiation and Endochondral Ossification of Human iPSC-Derived Chondrocytes
Abstract
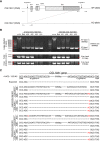
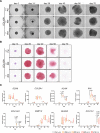
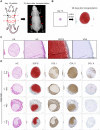
Collagen X is a non-fibril collagen produced by hypertrophic chondrocytes and was believed to associate with the calcification process of growth plate cartilage. The homozygous loss of Col10a1 gene in mice, however, demonstrated no remarkable effects on growth plate formation or skeletal development. To investigate the role of collagen X in human chondrocytes, we established human induced pluripotent stem cells (hiPSCs) with heterozygous (COL10A1 +/-) or homozygous (COL10A1 -/-) deletions of COL10A1 gene using the dual sgRNA CRISPR/Cas9 system. Several mutant clones were established and differentiated into hypertrophic chondrocytes by a previously reported 3D induction method. No remarkable differences were observed during the differentiation process between parental and mutant cell lines, which differentiated into cells with features of hypertrophic chondrocytes, indicating that collagen X is dispensable for the hypertrophic differentiation of human chondrocytes in vitro. To investigate the effects of collagen X deficiency in vivo, chondrocyte pellets at the proliferating or prehypertrophic stage were transplanted into immunodeficient mice. Proliferating pellet-derived tissues demonstrated the zonal distribution of chondrocytes with the transition to bone tissues mimicking growth plates, and the proportion of bone tended to be larger in COL10A1 -/- tissues. Prehypertrophic pellet-derived tissues produced trabecular bone structures with features of endochondral ossification, and there was no clear difference between parental- and mutant-derived tissues. A transcriptome analysis of chondrocyte pellets at the hypertrophic phase showed a lower expression of proliferating-phase genes and a higher expression of calcification-phase genes in COL10A1 -/- pellets compared with parental cell pellets. These in vitro and in vivo data suggested that collagen X is dispensable for the hypertrophic differentiation and endochondral ossification of human iPSC-derived chondrocytes, though it may facilitate the differentiation process. Thus, COL10A1 -/- iPSC lines are useful for investigating the physiological role of collagen X in chondrocyte differentiation. © 2023 The Authors. JBMR Plus published by Wiley Periodicals LLC on behalf of American Society for Bone and Mineral Research.
Keywords: BONE MATRIX; CHONDROCYTE AND CARTILAGE BIOLOGY; COLLAGEN; DISEASES AND DISORDERS OF/RELATED TO BONE; GROWTH PLATE.
© 2023 The Authors. JBMR Plus published by Wiley Periodicals LLC on behalf of American Society for Bone and Mineral Research.
Figures


Similar articles
-
Identification and characterization of the novel Col10a1 regulatory mechanism during chondrocyte hypertrophic differentiation.Cell Death Dis. 2014 Oct 16;5(10):e1469. doi: 10.1038/cddis.2014.444. Cell Death Dis. 2014. PMID: 25321476 Free PMC article.
-
SOX9 governs differentiation stage-specific gene expression in growth plate chondrocytes via direct concomitant transactivation and repression.PLoS Genet. 2011 Nov;7(11):e1002356. doi: 10.1371/journal.pgen.1002356. Epub 2011 Nov 3. PLoS Genet. 2011. PMID: 22072985 Free PMC article.
-
Targeting Runx2 expression in hypertrophic chondrocytes impairs endochondral ossification during early skeletal development.J Cell Physiol. 2012 Oct;227(10):3446-56. doi: 10.1002/jcp.24045. J Cell Physiol. 2012. PMID: 22223437 Free PMC article.
-
Collagen type X expression and chondrocyte hypertrophic differentiation during OA and OS development.Am J Cancer Res. 2024 Apr 15;14(4):1784-1801. doi: 10.62347/JWGW7377. eCollection 2024. Am J Cancer Res. 2024. PMID: 38726262 Free PMC article. Review.
-
Interaction of growth factors regulating chondrocyte differentiation in the developing embryo.Osteoarthritis Cartilage. 2001;9 Suppl A:S109-17. Osteoarthritis Cartilage. 2001. PMID: 11680674 Review.
Cited by
-
Modeling vascular dynamics at the initial stage of endochondral ossification on a microfluidic chip using a human embryonic-stem-cell-derived organoid.Regen Ther. 2024 Dec 4;28:90-100. doi: 10.1016/j.reth.2024.11.018. eCollection 2025 Mar. Regen Ther. 2024. PMID: 39703814 Free PMC article.
-
Cell Therapy Approaches for Articular Cartilage Regeneration.Organogenesis. 2023 Dec 31;19(1):2278235. doi: 10.1080/15476278.2023.2278235. Epub 2023 Nov 14. Organogenesis. 2023. PMID: 37963189 Free PMC article. Review.
References
LinkOut - more resources
Full Text Sources
Molecular Biology Databases
Research Materials
