

Semiautomated segmentation of lower extremity MRI reveals distinctive subcutaneous adipose tissue in lipedema: a pilot study
- PMID: 37197375
- PMCID: PMC10185105
- DOI: 10.1117/1.JMI.10.3.036001
Semiautomated segmentation of lower extremity MRI reveals distinctive subcutaneous adipose tissue in lipedema: a pilot study
Abstract
Purpose: Lipedema is a painful subcutaneous adipose tissue (SAT) disease involving disproportionate SAT accumulation in the lower extremities that is frequently misdiagnosed as obesity. We developed a semiautomatic segmentation pipeline to quantify the unique lower-extremity SAT quantity in lipedema from multislice chemical-shift-encoded (CSE) magnetic resonance imaging (MRI).
Approach: Patients with lipedema () and controls () matched for age and body mass index (BMI) underwent CSE-MRI acquired from the thighs to ankles. Images were segmented to partition SAT and skeletal muscle with a semiautomated algorithm incorporating classical image processing techniques (thresholding, active contours, Boolean operations, and morphological operations). The Dice similarity coefficient (DSC) was computed for SAT and muscle automated versus ground truth segmentations in the calf and thigh. SAT and muscle volumes and the SAT-to-muscle volume ratio were calculated across slices for decades containing 10% of total slices per participant. The effect size was calculated, and Mann-Whitney test applied to compare metrics in each decade between groups (significance: two-sided ).
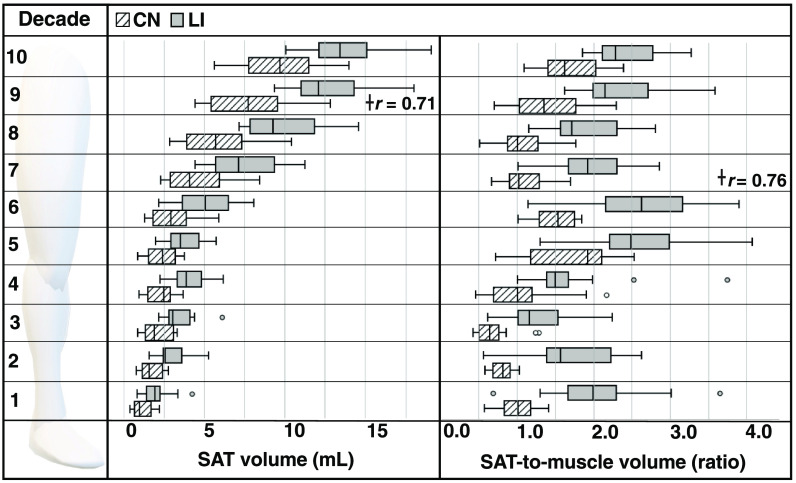
Results: Mean DSC for SAT segmentations was 0.96 in the calf and 0.98 in the thigh, and for muscle was 0.97 in the calf and 0.97 in the thigh. In all decades, mean SAT volume was significantly elevated in participants with versus without lipedema (), whereas muscle volume did not differ. Mean SAT-to-muscle volume ratio was significantly elevated () in all decades, where the greatest effect size for distinguishing lipedema was in the seventh decade approximately midthigh ().
Conclusions: The semiautomated segmentation of lower-extremity SAT and muscle from CSE-MRI could enable fast multislice analysis of SAT deposition throughout the legs relevant to distinguishing patients with lipedema from females with similar BMI but without SAT disease.
Keywords: body composition; chemical-shift-encoded magnetic resonance imaging; lipedema; musculoskeletal segmentation; whole-body magnetic resonance imaging.
© 2023 The Authors.
Figures


Similar articles
-
The effect of a low-carbohydrate diet on subcutaneous adipose tissue in females with lipedema.Front Nutr. 2024 Nov 7;11:1484612. doi: 10.3389/fnut.2024.1484612. eCollection 2024. Front Nutr. 2024. PMID: 39574523 Free PMC article.
-
Tissue Sodium Content is Elevated in the Skin and Subcutaneous Adipose Tissue in Women with Lipedema.Obesity (Silver Spring). 2018 Feb;26(2):310-317. doi: 10.1002/oby.22090. Epub 2017 Dec 27. Obesity (Silver Spring). 2018. PMID: 29280322 Free PMC article.
-
Subcutaneous Adipose Tissue Edema in Lipedema Revealed by Noninvasive 3T MR Lymphangiography.J Magn Reson Imaging. 2023 Feb;57(2):598-608. doi: 10.1002/jmri.28281. Epub 2022 Jun 3. J Magn Reson Imaging. 2023. PMID: 35657120 Free PMC article.
-
Visceral adiposity and inflammatory bowel disease.Int J Colorectal Dis. 2021 Nov;36(11):2305-2319. doi: 10.1007/s00384-021-03968-w. Epub 2021 Jun 9. Int J Colorectal Dis. 2021. PMID: 34104989 Review.
-
Ketogenic Diet: A Nutritional Therapeutic Tool for Lipedema?Curr Obes Rep. 2023 Dec;12(4):529-543. doi: 10.1007/s13679-023-00536-x. Epub 2023 Nov 4. Curr Obes Rep. 2023. PMID: 37924422 Free PMC article. Review.
Cited by
-
The effect of a low-carbohydrate diet on subcutaneous adipose tissue in females with lipedema.Front Nutr. 2024 Nov 7;11:1484612. doi: 10.3389/fnut.2024.1484612. eCollection 2024. Front Nutr. 2024. PMID: 39574523 Free PMC article.
-
Sex Differences in Fat Distribution and Muscle Fat Infiltration in the Lower Extremity: A Retrospective Diverse-Ethnicity 7T MRI Study in a Research Institute Setting in the USA.Diagnostics (Basel). 2024 Oct 10;14(20):2260. doi: 10.3390/diagnostics14202260. Diagnostics (Basel). 2024. PMID: 39451583 Free PMC article.
References
-
- Herbst K. L., et al. , “Lipedema fat and signs and symptoms of illness, increase with advancing stage,” Arch. Med. 7, 1–8 (2015).
Grants and funding
LinkOut - more resources
Full Text Sources
Research Materials
