. 2023 Aug;129(2):249-265.
doi: 10.1038/s41416-023-02282-2. Epub 2023 May 17.

Targeting metabolism by B-raf inhibitors and diclofenac restrains the viability of BRAF-mutated thyroid carcinomas with Hif-1α-mediated glycolytic phenotype

Affiliations

Targeting metabolism by B-raf inhibitors and diclofenac restrains the viability of BRAF-mutated thyroid carcinomas with Hif-1α-mediated glycolytic phenotype

Marianna Aprile et al. Br J Cancer. 2023 Aug.

Abstract

Background: B-raf inhibitors (BRAFi) are effective for BRAF-mutated papillary (PTC) and anaplastic (ATC) thyroid carcinomas, although acquired resistance impairs tumour cells' sensitivity and/or limits drug efficacy. Targeting metabolic vulnerabilities is emerging as powerful approach in cancer.

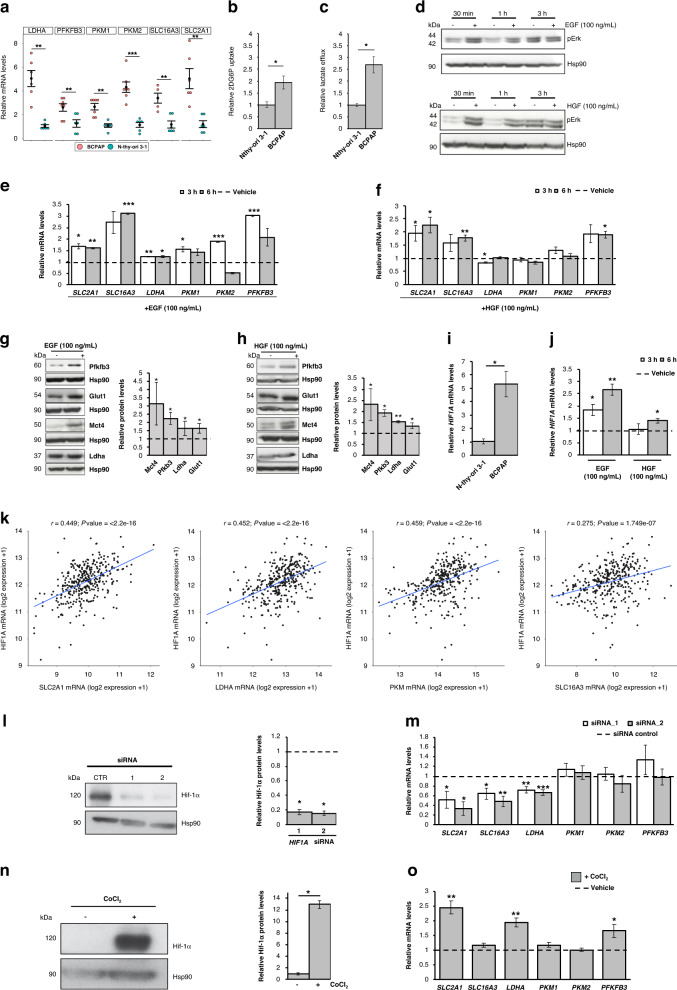
Methods: In silico analyses identified metabolic gene signatures and Hif-1α as glycolysis regulator in PTC. BRAF-mutated PTC, ATC and control thyroid cell lines were exposed to HIF1A siRNAs or chemical/drug treatments (CoCl2, EGF, HGF, BRAFi, MEKi and diclofenac). Genes/proteins expression, glucose uptake, lactate quantification and viability assays were used to investigate the metabolic vulnerability of BRAF-mutated cells.

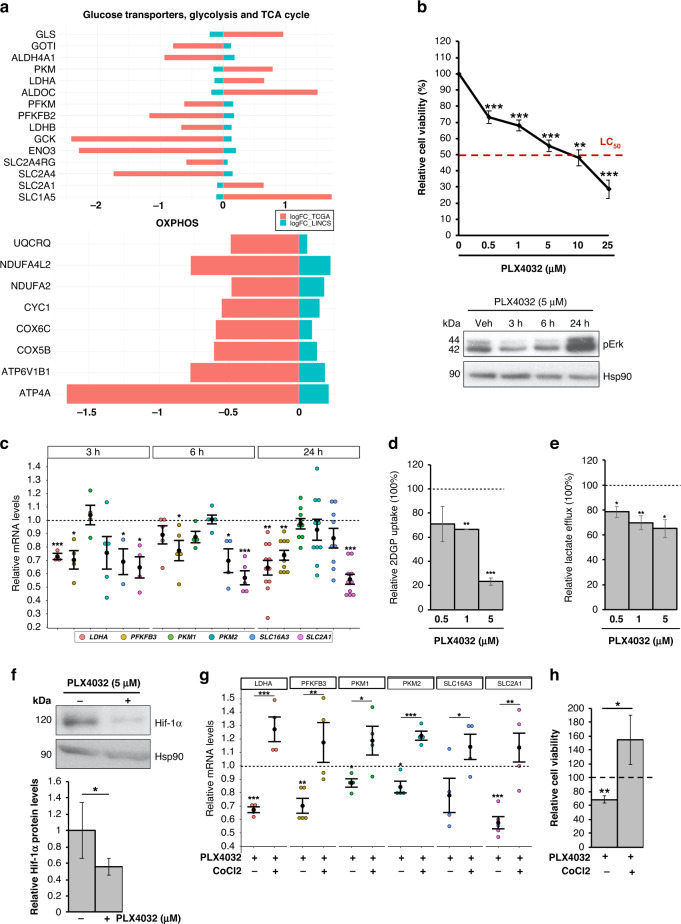
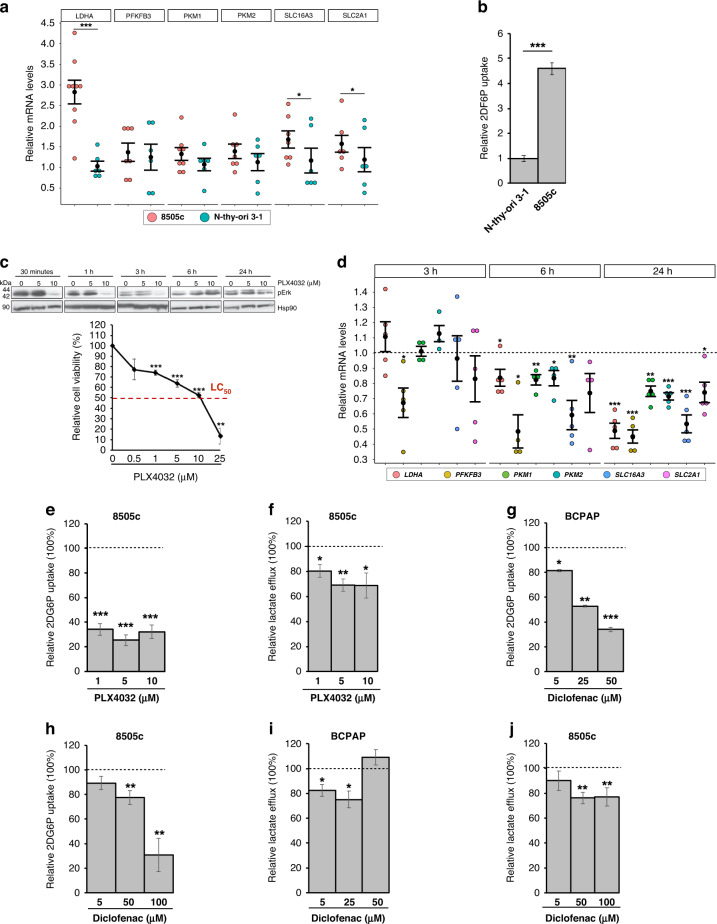
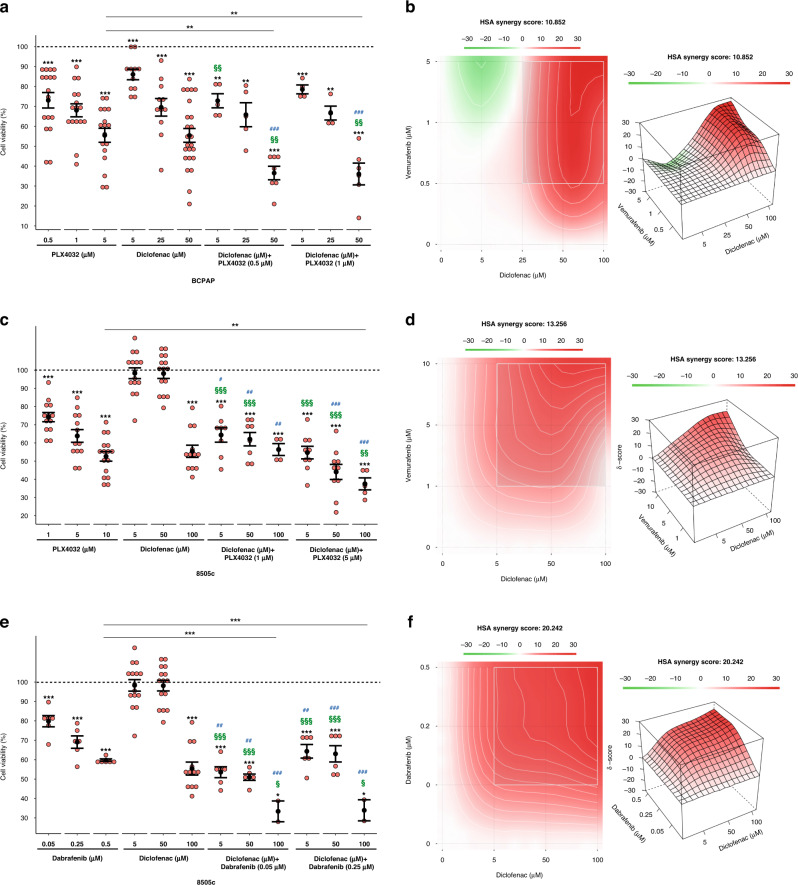
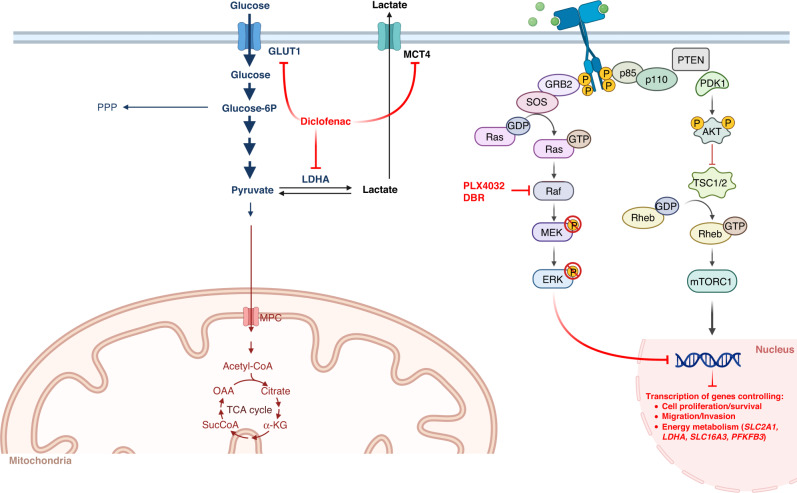
Results: A specific metabolic gene signature was identified as a hallmark of BRAF-mutated tumours, which display a glycolytic phenotype, characterised by enhanced glucose uptake, lactate efflux and increased expression of Hif-1α-modulated glycolytic genes. Indeed, Hif-1α stabilisation counteracts the inhibitory effects of BRAFi on these genes and on cell viability. Interestingly, targeting metabolic routes with BRAFi and diclofenac combination we could restrain the glycolytic phenotype and synergistically reduce tumour cells' viability.

Conclusion: The identification of a metabolic vulnerability of BRAF-mutated carcinomas and the capacity BRAFi and diclofenac combination to target metabolism open new therapeutic perspectives in maximising drug efficacy and reducing the onset of secondary resistance and drug-related toxicity.


Conflict of interest statement

The authors declare no competing interests.

Figures

Fig. 1
Fig. 1. BRAF-like PTC subtype displays a specific signature of metabolic genes.
a Left panel. Heatmap showing normalised expression data (RNA-Seq from THCA; n = 398) of genes flagged as “metabolism” or “metabolism-related” (PhosphoSitePlus database) in BRAF- (green) vs RAS-like (red) PTCs. Right panel. The enrichment score curve (in green) of genes belonging to the “Metabolic pathway” obtained as output of the Gene Set Enrichment Analysis (GSEA) on the genes differentially expressed (P value=0.0052; P-adjusted=0.0104) between BRAF- and RAS-like tumours (THCA cohort, TCGA). The vertical black lines indicate gene position in the ranked list, whereas horizontal bars in graded colour (upregulated in red; downregulated in blue) indicate the rank-ordered, non-redundant list of genes. b Violin plots illustrating normalised expression values (log2 scale) of SLC2A1, SLC2A3 and SLC2A4 – encoding glucose transporters —in BRAF- (n = 327) and RAS-like (n = 71) PTCs (THCA cohort). *FDR ≤ 0.05, **FDR ≤ 0.01, ***FDR ≤ 0.001. c Box plots displaying normalised expression values (log2 scale) of SLC2A4RG—encoding the main transcription regulator of Glut4—in BRAF-like (BRAFV600E and RET/PTC) and RAS-like tumours. *FDR ≤ 0.05. d Scatter plot of normalised expression data (log2 scale) showing the correlation trend between SLC2A4 and SLC2A4RG overall THCA cohort (generated in cBioPortal); Spearman’s correlation: 0.39 (P = 3.98e-19), Pearson’s correlation: 0.41 (P = 3.01e-21). e Heatmaps showing normalised expression data of genes involved in upper and lower glycolysis in the BRAF- (green) vs RAS-like (red) PTCs.
Fig. 2
Fig. 2. PTC subtypes do not display marked differences in DNA methylation of glucose transporters and glycolytic genes.
a Scatter plot of expression and methylation data (logFC; THCA datasets) of genes differentially expressed between BRAF- and RAS-like PTCs. Four distinct clusters of genes have been identified (clockwise from upper left) as altered in BRAF-like tumours: hypermethylated and downregulated (cluster 1); hypermethylated and overexpressed (cluster 2); hypomethylated and overexpressed (cluster 3); hypomethylated and downregulated (cluster 4). b Heatmap showing normalised expression data (RNA-Seq datasets from THCA cohort; n = 398) of genes encoding glucose transporters and glycolysis-related proteins (selected according to KEGG database) in BRAF- (green) vs RAS-like (red) PTCs. ce Scatter plots showing the correlation—by linear regression analysis—between normalised expression (log2 scale) and methylation data (logFC; THCA cohort) of 9 selected genes differentially expressed between PTC subtypes. These genes were selected as showing a good (0.30 > r < 0.49) or strong (0.5 > r < 0.7) correlation (Pearson’s coefficient) and distinguished in significantly hypomethylated and overexpressed (c), hypermethylated and downregulated in BRAF-like subtype (d) and highly correlated, but not differentially methylated, between tumour subtypes (e).
Fig. 3
Fig. 3. Identification of transcription factors potentially contributing to the metabolic rewiring in BRAF-like PTCs.
a Heatmap showing the enrichment of predicted transcription factors’ binding sites in the putative promoters (window of 1 kb up- and downstream the transcription start site, TSS) of metabolic genes differentially expressed between BRAF- and RAS-like PTCs. Red squares indicate higher enrichment scores for TFs’ predicted binding. b Heatmap showing Pearson’s coefficients between the expression values of top-ranked TFs—having the highest number of predicted binding sites in the promoter of metabolic genes—and the glucose transporters and other glycolytic genes differentially expressed between BRAF- and RAS-like PTCs (THCA cohort). c Box plot comparing normalised HIF1A expression values (log2 scale) in BRAF-, RAS-like PTCs and in healthy thyroid samples. ***FDR ≤ 0.001. d, e Box plots comparing normalised MYC (D) and MYCN (E) expression values (log2 scale) in BRAF-mutated, RET/PTC, RAS-like PTCs and in healthy thyroid samples (THCA cohort). *FDR ≤ 0.05, **FDR ≤ 0.01.
Fig. 4
Fig. 4. BRAF-mutated PTC cells display a glycolytic phenotype mediated by Hif-1α.
a Relative mRNA quantification (qPCR) of selected metabolic genes in BCPAP compared to normaloid thyroid cell line (Nthy-ori 3-1). Data are reported as mean ± SEM vs Nthy-ori 3-1 cells of at least six independent experiments. PPIA was used as reference gene. **P value ≤0.01 and ***P value ≤0.001. b Relative colorimetric detection of 2-DG6P uptake in BCPAP compared to Nthy-ori 3-1 cells. Corrected values (pmol) were normalised for the related AUC and data are reported as mean ± SEM of at least four independent experiments. *P value ≤ 0.05. c Relative colorimetric detection of l-lactic acid content in the cell culture supernatant of BCPAP compared to Nthy-ori 3-1 cells. Lactate concentration (mmol/L) was normalised for the related AUC and data are reported as mean ± SEM of at least four independent experiments. *P value ≤0.05. d Representative autoradiographs of the western blot analysis for pErk in Nthy-ori 3-1 treated or not with Egf (upper panel) or Hgf (lower panel) 100 ng/mL at multiple time points. Hsp90 was used as a loading control. e, f Relative mRNA quantification (qPCR) of selected metabolic genes in Nthy-ori-3-1 cells upon EGF (100 ng/mL; e) and HGF (100 ng/mL; f) treatment (3, 6 h). Data are reported as mean ± SEM vs control cells (vehicle-treated; dotted line) of three independent experiments. PPIA was used as reference gene. *P value ≤0.05, **P value ≤0.01 and ***P value ≤0.001. g, h Representative autoradiographs of the western blot analysis for selected metabolic enzymes and transporters (i.e., Pfkfb3, Glut1, Mct4 and Ldha) in Nthy-ori 3-1 treated or not with EGF (g) or HGF (h) 100 ng/mL at multiple time points. Hsp90 was used as a loading control. Bar graphs (right part of each panel) report relative protein levels normalised on Hsp90 expression (pixel density analysis of western blots). Data are reported as mean ± SEM vs control cells (i.e., treated with the vehicle) of three independent experiments. *P value ≤0.05, **P value ≤0.01. i, j Relative mRNA quantification (qPCR) of HIF1A gene in BCPAP vs Nthy-ori 3-1 (i) and in BCPAP treated with EGF and HGF (100 ng/Ml, j) for 3 and 6 h vs control cells (i.e., treated with the vehicles; dotted line). Data are reported as mean ± SEM of three independent experiments. PPIA was used as a reference. *P value ≤0.05 and **P value ≤0.01. k Scatter plot of normalised expression data (log2 scale) showing the correlation—by linear regression analysis—of HIF1A and selected glycolysis-related genes in THCA cohort (expression data downloaded from cBioPortal). Pearson correlation coefficient (r) and P value (P) are shown. l Representative autoradiographs of western blot analysis (left panel) of Hif-1α protein levels in BCPAP transfected with two different HIF1A siRNAs. Hsp90 was used as a loading control. Bar graphs (right panel) report relative Hif-1α levels normalised on Hsp90 expression (pixel density analysis of western blots). Data are reported as mean ± SEM vs control cells (i.e., BCPAP transfected with scrambled siRNAs; dotted line) of three independent experiments. *P value ≤0.05. m Relative mRNA quantification (qPCR) of selected metabolic genes upon HIF1A silencing in BCPAP. Data are reported as mean ± SEM vs control cells (scrambled siRNAs; dotted line) of at least three independent experiments. PPIA was used as reference. *P value ≤0.05, **P value ≤0.01 and ***P value ≤0.001. n Representative autoradiographs of western blot analysis (left panel) of Hif-1α protein levels in BCPAP treated with CoCl2 (250 µM, 24 h). Hsp90 was used as a loading control. Bar graphs (right panel) report relative Hif-1α levels normalised on Hsp90 expression (pixel density analysis of western blots). Data are reported as mean ± SEM vs control cells (i.e., treated with the vehicle) of three independent experiments. *P value ≤0.05. o Relative mRNA quantification (qPCR) of selected metabolic genes in BCPAP treated with CoCl2 (250 µM, 24 h). Data are reported as mean ± SEM vs control cells (BCPAP treated with the vehicle; dotted line) of at least four independent experiments. PPIA was used as a reference. *P value ≤0.05 and **P value ≤0.01.
Fig. 5
Fig. 5. BRAFi counteract the glycolytic phenotype and Hif-1α-modulated transcription signature of BRAF-mutant PTC cells.
a Bar graphs indicate the expression levels (logFC) of genes involved in energy metabolism—i.e., glucose transport, glycolysis, TCA cycle (upper panel) and OXPHOS (lower panel)—and differentially expressed between BRAF- and RAS-like tumours, whose expression is reverted upon treatment with vemurafenib (blue bars) in multiple BRAF-mutated tumour cell lines from the LINCS 1000 Project. TCGA data (THCA cohort) for the same genes are indicated as red bars (logFC). b Relative cell viability (percentage; upper panel) in BCPAP cells upon treatment with PLX4032 treatment (0.5, 1, 5, 10 and 25 µM)—a vemurafenib analogue—for 72 h. Red dotted line indicates the median lethal concentration (lethal concentration 50%, LC50). Data are reported as mean ± SEM vs control cells (i.e., BCPAP treated with Veh; set to 100% of viability) of at least four independent experiments. **P value ≤0.01 and ***P value ≤0.001. Representative autoradiographs (lower panel) of western blot analysis of Erk phosphorylation (i.e., pErk) levels in BCPAP treated with PLX4032 (5 µM; 3, 6 and 24 h). Hsp90 was used as a loading control. c Relative mRNA quantification (qPCR) of selected metabolic genes in BCPAP treated with PLX4032 (5 µM; 3, 6 and 24 h). Data are reported as mean ± SEM vs control cells (i.e., treated with the vehicle; dotted line) of at least four independent experiments. *P value ≤0.05, **P value ≤0.01 and ***P value ≤0.001. d Relative colorimetric detection of total 2-DG6P uptake in BCPAP treated with different concentrations of PLX4032 for 72 h. Corrected values (pmol) were normalised for the related AUC and data are reported as mean ± SEM of at least three independent experiments. The effect of each treatment was estimated as the percentage of glucose uptake of control cells (i.e., BCPAP treated with the vehicle, set to 100%; dotted line). **P value ≤0.01 and ***P value ≤0.01. e Relative colorimetric detection of l-lactic acid content in cell culture supernatant of BCPAP treated with different concentrations of PLX4032 for 72 h. Lactate concentration (mmol/L) was normalised for the related AUC and data are reported as mean ± SEM of at least four independent experiments. The effect of each treatment was estimated as the percentage of lactate secreted by control cells (i.e., BCPAP treated with the vehicle, set to 100%; dotted line). *P value ≤0.05 and **P value ≤0.01. f Representative autoradiographs of western blot analysis (upper panel) of Hif-1α protein levels in BCPAP treated with PLX4032 (5 µM; 24 h). Hsp90 was used as a loading control. Bar graphs (lower panel) report relative Hif-1α levels normalised on Hsp90 expression (pixel density analysis of western blots). Data are reported as mean ± SEM vs control cells (i.e., BCPAP treated with the vehicle) of three independent experiments. *P value ≤ 0.05. g Relative mRNA quantification (qPCR) of selected metabolic genes in BCPAP upon PLX4032 treatment (5 µM) alone—vs cells treated with the vehicle—or in combination with CoCl2 (125 µM)—vs cells treated with CoCl2 alone—for 24 h. Data are reported as mean ± SEM vs control cells (dotted line) of at least four independent experiments. PPIA was used as reference. *P value ≤0.05, **P value ≤0.01 and ***P value ≤0.001. h Relative cell viability in BCPAP upon PLX4032 treatment (5 µM) alone—vs cells treated with the vehicle—or in combination with CoCl2 (125 µM)—vs cells treated with CoCl2 alone—for 72 h. Data are reported as mean ± SEM vs control cells (dotted line, set to 100% of viability) of four independent experiments. *P value ≤0.05 and **P value ≤0.01.
Fig. 6
Fig. 6. BRAF-mutated PTC and ATC cells display a similar glycolytic phenotype modulated by BRAFi and diclofenac.
a Relative mRNA quantification (qPCR) of selected metabolic genes in 8505c compared to Nthy-ori 3-1. Data are reported as mean ± SEM vs Nthy-ori 3-1 cells of at least six independent experiments. PPIA was used as reference. *P value ≤0.05 and ***P value ≤0.001. b Relative colorimetric detection of total 2-DG6P uptake in 8505c compared to Nthy-ori 3-1 cells. Corrected values (pmol) were normalised for the related AUC and data are reported as mean ± SEM of at least four independent experiments. ***P value ≤0.01. c Representative autoradiographs of western blot analysis (upper panel) of Erk phosphorylation (i.e., pErk) levels in 8505c cells treated with PLX4032 (5 µM and 10 µM; 30 min, 1, 3, 6 and 24 h). Hsp90 was used as a loading control. Relative cell viability (percentage; lower panel) in 8505c cells upon treatment with PLX4032 treatment (0.5, 1, 5, 10 and 25 µM)—a vemurafenib analogue—for 72 h. Red dotted line indicates the median lethal concentration (lethal concentration 50%, LC50). Data are reported as mean ± SEM vs control cells (i.e., BCPAP treated with the vehicle; set to 100% of viability) of at least four independent experiments. **P value ≤0.01, ***P value ≤0.001. d Relative mRNA quantification (qPCR) of selected metabolic genes in 8505c treated with PLX4032 (10 µM; 3, 6 and 24 h). Data are reported as mean ± SEM vs control cells (i.e., 8505c treated with the vehicle; dotted line) of at least four independent experiments. *P value ≤0.05, **P value ≤0.01 and ***P value ≤0.001. e Relative colorimetric detection of total 2-DG6P uptake in 8505c treated with different concentrations of PLX4032 for 72 h. Corrected values (pmol) were normalised for the related AUC and data are reported as mean ± SEM of at least four independent experiments. The effect of each treatment was estimated as the percentage of glucose uptake of control cells (i.e., 8505c treated with the vehicle, set to 100%; dotted line). **P value ≤0.01 and ***P value ≤0.01. f Relative colorimetric detection of l-lactic acid content in cell culture supernatant of 8505c treated with different concentrations of PLX4032 for 72 h. Lactate concentration (mmol/L) was normalised for the related AUC and data are reported as mean ± SEM of at least four independent experiments. The effect of each treatment was estimated as the percentage of lactate secreted by control cells (i.e., 8505c treated with the vehicle, set to 100%; dotted line). *P value ≤0.05 and **P value ≤0.01. g, h Relative colorimetric detection of total 2-DG6P uptake in BCPAP (g) and 8505c (h) treated with different concentrations of diclofenac for 72 h. Corrected values (pmol) were normalised for the related AUC and data are reported as mean ± SEM of at least three independent experiments. The effect of each treatment was estimated as the percentage of glucose uptake of control cells (i.e., cells treated with the vehicle, set to 100%; dotted line). *P value ≤0.05, **P value ≤0.01 and ***P value ≤ 0.01. i, j Relative colorimetric detection of l-lactic acid content in cell culture supernatant of BCPAP (i) and 8505c (j) treated with different concentrations of diclofenac for 72 h. Lactate concentration (mmol/L) was normalised for the related AUC and data are reported as mean ± SEM of at least four independent experiments. The effect of each treatment was estimated as the percentage of lactate secreted by control cells (i.e., cells treated with the vehicle, set to 100%; dotted line). *P value ≤0.05 and **P value ≤0.01.
Fig. 7
Fig. 7. The combination of BRAFi and diclofenac synergistically reduces the cell viability of BRAF-mutated PTC and ATC cells.
a Relative cell viability in BCPAP cells upon single (PLX4032 and diclofenac) and combined treatment with the two drugs at different doses for 72 h. Data are reported as mean ± SEM vs control cells (i.e., BCPAP treated with the vehicles—indicated as dotted line—are set to 100% of viability) of at least four independent experiments. **P value ≤0.01 and ***P value ≤0.001 vs control cells or BCPAP treated with the maximum dose of PLX4032 (5 µM). ###P value ≤0.001 vs BCPAP treated with the same doses of PLX4032 alone. §§P value ≤ 0.01 vs BCPAP treated with the same doses of diclofenac alone. b Heatmap showing—in 2D (left panel) and 3D (right panel)—the HSA synergy scores (i.e., positive values in red denote synergy), analysed by SynergyFinder tool, for the combination of PLX4032 and diclofenac in BCPAP. c Relative cell viability in 8505c cells upon single (PLX4032 and diclofenac) and combined treatment with the two drugs at different doses for 72 h. Data are reported as mean ± SEM vs control cells (i.e., 8505c treated with the vehicles—indicated as dotted line—are set to 100% of viability) of at least four independent experiments. ***P value ≤0.001 vs control cells or 8505c treated with the maximum dose of PLX4032 (10 µM). #P value ≤0.05, ##P value ≤0.01 and ###P value ≤0.001 vs 8505c treated with the same doses of PLX4032 alone. §§P value ≤0.01 and §§§P value ≤0.01 vs 8505c treated with the same doses of diclofenac alone. d Heatmap showing—in 2D (left panel) and 3D (right panel)—the HSA synergy scores (i.e., positive values in red denote synergy), analysed by SynergyFinder tool, for the combination of PLX4032 and diclofenac in 8505c. e Relative cell viability in 8505c cells upon single (dabrafenib or diclofenac) and combined treatment with the two drugs at different doses for 72 h. Data are reported as mean ± SEM vs control cells (i.e., 8505c treated with the vehicles—indicated as dotted line—are set to 100% of viability) of at least three independent experiments. *P value ≤0.05 and ***P value ≤0.001 vs control cells or 8505c treated with the maximum dose of DBR (0.5 µM). ##P value ≤0.01 and ###P value ≤0.001 vs 8505c treated with the same doses of dabrafenib alone. §P value ≤0.05 and §§§P value ≤0.01 vs 8505c treated with the same doses of diclofenac alone. f Heatmap showing—in 2D (left panel) and 3D (right panel)—the HSA synergy scores (i.e., positive values in red denote synergy), analysed by SynergyFinder tool, for the combination of dabrafenib and diclofenac in 8505c.
Fig. 8
Fig. 8. Schematic model of BRAFi and diclofenac effects on metabolic processes.
Schematic representation of the possible molecular mechanism underlying the synergism between diclofenac and vemurafenib/dabrafenib (PLX4032 and DBR) in BRAF-mutated papillary and anaplastic thyroid carcinomas. Created with Biorender.com.

Similar articles

Cited by

References

    1. Cancer Genome Atlas Research Network. Integrated genomic characterization of papillary thyroid carcinoma. Cell. 2014;159:676–90. doi: 10.1016/j.cell.2014.09.050. - DOI - PMC - PubMed
    1. Costa V, Esposito R, Ziviello C, Sepe R, Bim LV, Cacciola NA, et al. New somatic mutations and WNK1-B4GALNT3 gene fusion in papillary thyroid carcinoma. Oncotarget. 2015;6:11242–51. doi: 10.18632/oncotarget.3593. - DOI - PMC - PubMed
    1. Kroemer G, Pouyssegur J. Tumor cell metabolism: cancer’s Achilles’ heel. Cancer Cell. 2008;13:472–82. doi: 10.1016/j.ccr.2008.05.005. - DOI - PubMed
    1. Pavlova NN, Thompson CB. The emerging hallmarks of cancer metabolism. Cell Metab. 2016;23:27–47. doi: 10.1016/j.cmet.2015.12.006. - DOI - PMC - PubMed
    1. Fendt SM, Frezza C, Erez A. Targeting metabolic plasticity and flexibility dynamics for cancer therapy. Cancer Discov. 2020;10:1797–807. doi: 10.1158/2159-8290.CD-20-0844. - DOI - PMC - PubMed

Publication types