. 2023 Aug;43(6):3047-3060.
doi: 10.1007/s10571-023-01351-7. Epub 2023 May 17.

Acute and Chronic Macrophage Differentiation Modulates TREM2 in a Personalized Alzheimer's Patient-Derived Assay

Affiliations

Acute and Chronic Macrophage Differentiation Modulates TREM2 in a Personalized Alzheimer's Patient-Derived Assay

Nicoleta-Carmen Cosma et al. Cell Mol Neurobiol. 2023 Aug.

Abstract

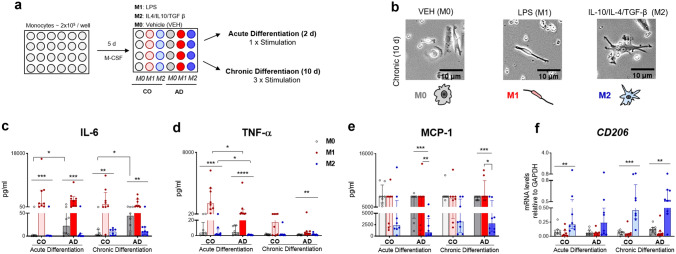
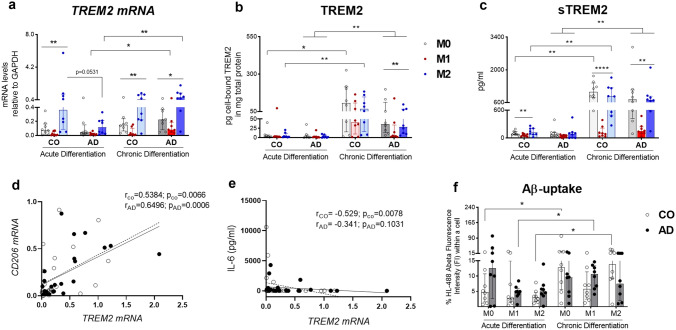
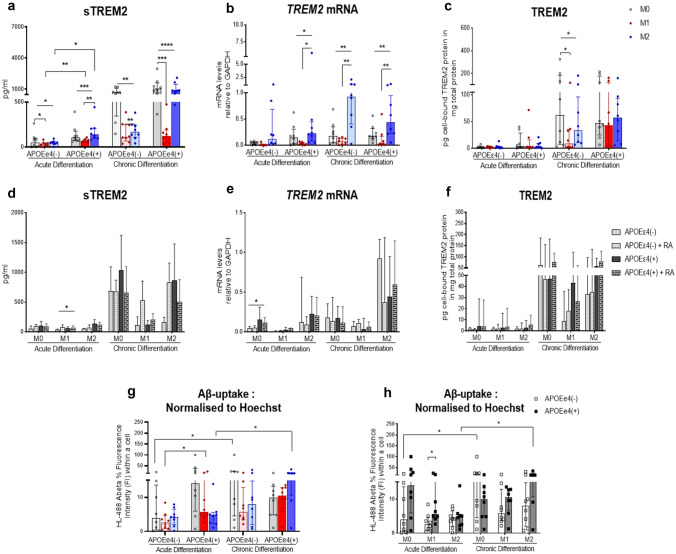
Neuroinflammation plays a pivotal role in the pathogenesis of Alzheimer`s disease (AD). Brain macrophage populations differentially modulate the immune response to AD pathology according to the disease stage. Triggering receptor expressed on myeloid cells 2 (TREM2) is known to play a protective role in AD and has been postulated as a putative therapeutic target. Whether, and to which extent TREM2 expression can be modulated in the aged macrophage population of the brain is unknown, emphasizing the need for a human, patient-specific model. Using cells from AD patients and matched controls (CO) we designed an assay based on monocyte-derived macrophages to mimic brain-infiltrating macrophages and to assess the individualized TREM2 synthesis in vitro. We systematically assessed the effects of short-term (acute-2 days) and long-term (chronic-10 days) M1- (LPS), M2- (IL-10, IL-4, TGF-β), and M0- (vehicle) macrophage differentiation on TREM2 synthesis. Moreover, the effects of retinoic acid (RA), a putative TREM2 modulator, on individualized TREM2 synthesis were assessed. We report increased TREM2 synthesis after acute M2- compared to M1-differentiation in CO- but not AD-derived cells. Chronic M2- and M0-differentiation however resulted in an increase of TREM2 synthesis in both AD- and CO-derived cells while chronic M1-differentiation increased TREM2 in AD-derived cells only. Moreover, chronic M2- and M0-differentiation improved the amyloid-β (Aβ) uptake of the CO-derived whereas M1-differentiation of the AD-derived cells. Interestingly, RA-treatment did not modulate TREM2. In the age of personalized medicine, our individualized model could be used to screen for potential drug-mediated treatment responses in vitro. Triggering receptor expressed on myeloid cells 2 (TREM2) has been postulated as a putative therapeutic target in Alzheimer's disease (AD). Using cells from AD patients and matched controls (CO), we designed a monocyte-derived macrophages (Mo-MФs) assay to assess the individualized TREM2 synthesis in vitro. We report increased TREM2 synthesis after acute M2- compared to M1- macrophage differentiation in CO- but not AD-derived cells. Chronic M2- and M0- differentiation however resulted in an increase of TREM2 synthesis in both AD- and CO-derived cells while chronic M1-differentiation increased TREM2 in AD-cells only.

Keywords: LOAD; Monocyte-derived macrophages; Patient-derived personalized assay; Retinoic acid; TREM2.


Conflict of interest statement

The authors declare no competing interests.

Figures

Fig. 1
Fig. 1
Acute and chronic Mo-MФs differentiation to M1-, M2-, and M0- macrophages a Experimental design: Mo-MФs were polarized for the total periods of 7 and 15 days with M-CSF, of which, respectively, the last 2 (acute) and 10 days (chronic) under differentiation to M1 (LPS), M2 (IL-4, IL10, TGF- β), and M0 (unstimulated) macrophages. b Morphology of the Mo-MФs after chronic differentiation observed with a Zeiss Axiovert 10 Inverted Microscope and captured with SWIFT Cam SC500 5.1 MP. Magnification = 25x, scale bar = 10 µm. c IL-6 and d TNF-α cytokine secretion; e MCP-1 secretion and (f) CD206 mRNA expression levels in acute and chronic differentiated Mo-MФs from patients with AD (n = 8) and CO (n = 8). mRNA levels measured with RT-qPCR, normalized to GAPDH. Dots represent individual participant values. Closed bars and symbols represent M0 (light gray for CO; dark gray for AD), M1 (light red for CO; dark red for AD), and M2 (light blue for CO; dark blue for AD) macrophages, respectively. Friedman's ANOVA tests with Dunn's post hoc multiple comparison tests performed to analyze the within-group differences and pairwise comparison of groups was performed with Mann Whitney tests (unpaired groups) (*p < 0.05, **p < 0.01, ***p < 0.001)
Fig. 2
Fig. 2
Impact of acute and chronic M1-, M2-, and M0- macrophage differentiation on TREM2 synthesis and Aβ uptake a TREM2 mRNA, b cell-bound TREM2 and c sTREM2 levels in Mo-MФs cultures from AD patients (n = 8) and CO (n = 8). Correlation between TREM2 mRNA expression and d CD206 mRNA; and e IL-6 secretion in pooled Mo-MФs (including M0, M1, and M2) from AD patients (n = 24) and CO (n = 24) after chronic differentiation. Closed symbols with solid line represent AD while open symbols with line with dashes represent CO. The Spearman correlation test was used for correlation analysis where r represents the correlation coefficient. f Aβ-uptake by Mo-MФs from patients with AD (n = 8) and CO (n = 8). mRNA (normalization GAPDH) expression and protein secretion levels were measured with RT-qPCR and bead-based immunoassay, respectively. Cell-bound TREM2 protein levels are shown relative to total protein measured with BCA assay. Dots represent individual participant values. ac Closed bars and symbols represent M0 (light gray for CO; dark gray for AD), M1 (light red for CO; dark red for AD), and M2 (light blue for CO; dark blue for AD) macrophages, respectively. f Open bars and symbols represent controls (CO) or closed bars and symbols AD (black). Friedman's ANOVA tests with Dunn's post hoc multiple comparison tests performed to analyze the within-group differences and pairwise comparison of groups was performed with Wilcoxon test (paired-) or Mann Whitney tests (unpaired groups) (*p < 0.05, **p < 0.01, ***p < 0.001)
Fig. 3
Fig. 3
Retinoic acid (RA) does not modulate TREM2 synthesis in response to the acute and chronic Mo-MФs differentiation a RA stimulation performed 24 h after Mo-MФs differentiation to M1 (LPS), M2 (IL-4, IL10, TGF- β), or M0 (VEH, unstimulated) macrophages. RA-stimulation effect on b sTREM2, c TREM2 mRNA and d cell-bound TREM2 protein levels in Mo-MФs cultures from AD (n = 8) and CO (n = 8)-derived cells in acute and chronic differentiation. Cell-bound TREM2 protein levels shown relative to total protein measured with BCA assay. Dots represent individual participant values. Closed bars without pattern represent CO (gray) and AD (black) and open bars with pattern represent CO + RA (gray) and AD + RA (black). The most relevant statistically significant differences between groups are shown by Kruskal–Wallis tests with Dunn's post hoc multiple comparison tests (*p < 0.05, **p < 0.01, ***p < 0.001)
Fig. 4
Fig. 4
APOEε4 effect on TREM2 synthesis in the absence or presence of RA-stimulation a sTREM2, b TREM2 mRNA and c cell-bound TREM2 protein levels in Mo-MФs cultures from APOEε4(+) (n = 8) and APOEε4(−) (n = 8)- derived cells. Dots represent individual participant values. Closed bars and symbols represent M0 (light gray for APOEε4(−); dark gray for APOEε4(+)), M1 (light red for APOEε4(−); dark red for APOEε4(+)), and M2 (light blue for APOEε4(-); dark blue for APOEε4(+)) macrophages, respectively. RA-stimulation effect on d sTREM2, e TREM2 mRNA and f cell-bound TREM2 protein levels in Mo-MФs cultures after acute and chronic differentiation. Closed bars without pattern represent APOEε4(−) (gray) and APOEε4(+) (black) and open bars with pattern represent APOEε4(−) + RA (gray) and APOEε4(+) + RA (black). g and h Measurement of Aß-uptake by Mo-MФs from patients with APOEε4(+) (n = 8) and APOEε4(−) (n = 8). Fluorescence intensity in Mo-MФs cultures monitored with a microplate reader. mRNA (normalization GAPDH) expression and protein/secretion levels were measured with RT-qPCR and bead-based immunoassay, respectively. Cell-bound TREM2 protein levels are shown relative to total protein measured with the BCA assay. For the group comparison, open bars and symbols represent controls APOEε4 (−) or closed bars and symbols APOEε4 (+) (black). Friedman's ANOVA tests were performed to analyze the within-group differences, while Kruskal–Wallis tests with Dunn's post hoc multiple comparison tests were used to analyze differences between groups. Pairwise comparison of groups was performed with Wilcoxon test (paired-) or Mann Whitney tests (unpaired groups) (*p < 0.05, **p < 0.01, ***p < 0.001)

References

    1. Bettcher BM, Tansey MG, Dorothée G, Heneka MT (2021) Peripheral and central immune system crosstalk in Alzheimer disease: a research prospectus. Nat Rev Neurol 17(11):689–701. 10.1038/s41582-021-00549-x - PMC - PubMed
    1. Byers DE, Wu K, Dang-Vu G, Jin X, Agapov E, Zhang X, Battaile JT, Schechtman K, Yusen R, Pierce RA, Holtzman MJ (2018) Triggering receptor expressed on myeloid cells-2 expression tracks With M2-like macrophage activity and disease severity in COPD. Chest 153(1):77–86. 10.1016/J.CHEST.2017.09.044 - PMC - PubMed
    1. Calvin CM, de Boer C, Raymont V, Gallacher J, Koychev I (2020) Prediction of Alzheimer’s disease biomarker status defined by the “ATN framework” among cognitively healthy individuals: results from the EPAD longitudinal cohort study. Alzheimer’s Res Therapy 12(1):143. 10.1186/S13195-020-00711-5/FIGURES/3 - PMC - PubMed
    1. Casati M, Ferri E, Gussago C, Mazzola P, Abbate C, Bellelli G, Mari D, Cesari M, Arosio B (2018) Increased expression of TREM2 in peripheral cells from mild cognitive impairment patients who progress into Alzheimer’s disease. Eur J Neurol 25(6):805–810. 10.1111/ENE.13583 - PubMed
    1. Cella M, Buonsanti C, Strader C, Kondo T, Salmaggi A, Colonna M (2003) Impaired differentiation of osteoclasts in TREM-2–deficient individuals. J Exp Med 198(4):645–651. 10.1084/JEM.20022220 - PMC - PubMed