. 2023 May;5(5):765-776.
doi: 10.1038/s42255-023-00774-2. Epub 2023 May 17.

Salvage of ribose from uridine or RNA supports glycolysis in nutrient-limited conditions

Affiliations

Salvage of ribose from uridine or RNA supports glycolysis in nutrient-limited conditions

Owen S Skinner et al. Nat Metab. 2023 May.

Abstract

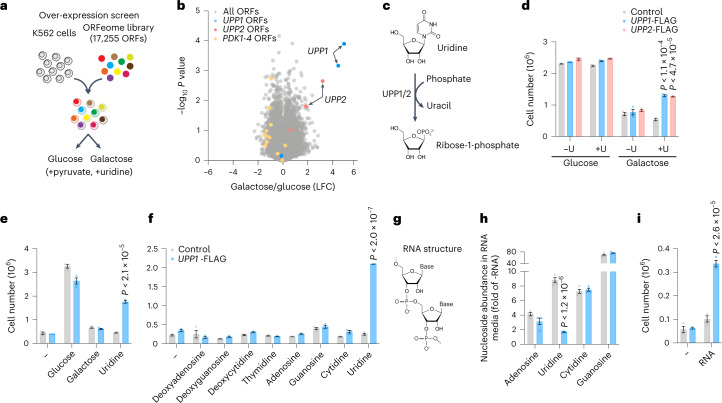
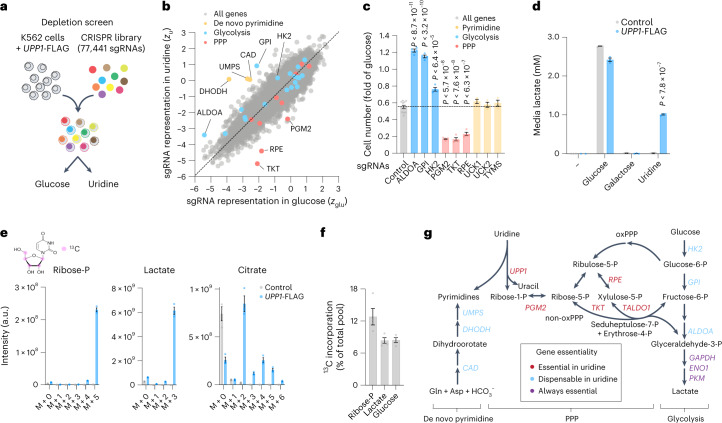
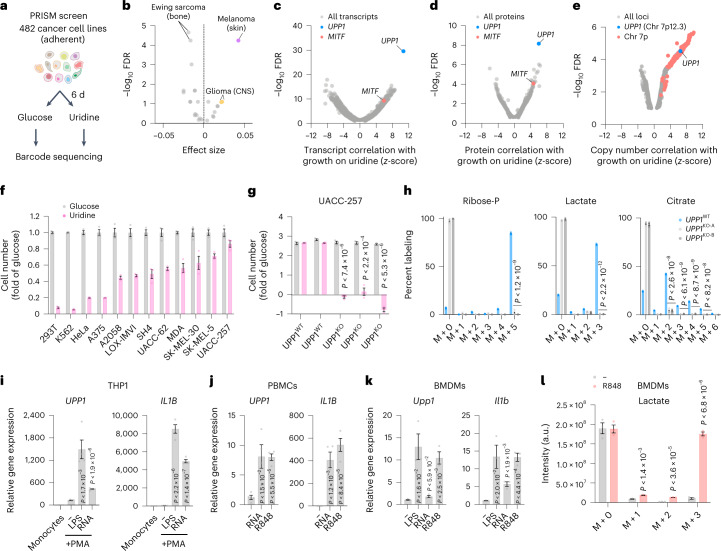
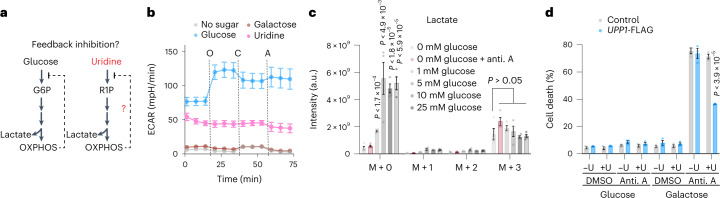
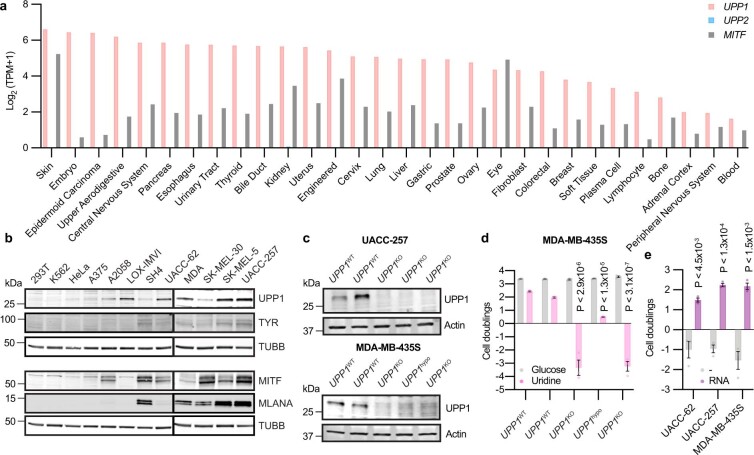
Glucose is vital for life, serving as both a source of energy and carbon building block for growth. When glucose is limiting, alternative nutrients must be harnessed. To identify mechanisms by which cells can tolerate complete loss of glucose, we performed nutrient-sensitized genome-wide genetic screens and a PRISM growth assay across 482 cancer cell lines. We report that catabolism of uridine from the medium enables the growth of cells in the complete absence of glucose. While previous studies have shown that uridine can be salvaged to support pyrimidine synthesis in the setting of mitochondrial oxidative phosphorylation deficiency1, our work demonstrates that the ribose moiety of uridine or RNA can be salvaged to fulfil energy requirements via a pathway based on: (1) the phosphorylytic cleavage of uridine by uridine phosphorylase UPP1/UPP2 into uracil and ribose-1-phosphate (R1P), (2) the conversion of uridine-derived R1P into fructose-6-P and glyceraldehyde-3-P by the non-oxidative branch of the pentose phosphate pathway and (3) their glycolytic utilization to fuel ATP production, biosynthesis and gluconeogenesis. Capacity for glycolysis from uridine-derived ribose appears widespread, and we confirm its activity in cancer lineages, primary macrophages and mice in vivo. An interesting property of this pathway is that R1P enters downstream of the initial, highly regulated steps of glucose transport and upper glycolysis. We anticipate that 'uridine bypass' of upper glycolysis could be important in the context of disease and even exploited for therapeutic purposes.


Conflict of interest statement

V.K.M. is a paid scientific advisor to 5AM Ventures. O.S.S. was a paid consultant for Proteinaceous Inc. D.E.F. has a financial interest in Soltego, a company developing salt-inducible kinase inhibitors for topical skin-darkening treatments that might be used for a broad set of human applications. The interests of D.E.F. were reviewed and are managed by Massachusetts General Hospital and Partners HealthCare in accordance with their conflict-of-interest policies. The remaining authors declare no competing interests.

Figures

Fig. 1
Fig. 1. Uridine phosphorylase activity supports growth on uridine or RNA.
a, Schematic overview of the ORF proliferation screen. b, Volcano plot representation of the screen hits after 21 d of growth in medium containing 25 mM glucose or 25 mM galactose, 0.2 mM uridine and 1 mM sodium pyruvate (n = 2). LFC, log2 (fold change). P values were calculated using a two-sided Student’s t-test. Statistics were not adjusted for multiple comparisons. c, Reaction catalysed by UPP1 and UPP2 proteins. df, Cell growth assays of K562 control cells and K562 cells expressing UPP1-FLAG or UPP2-FLAG in pyruvate-free media in the presence of: 25 mM glucose or 25 mM galactose or 0.2 mM uridine (±U; n = 3 replicate wells, P < 1.1 × 10−4 and P < 4.7 × 10−5; d), 10 mM of either glucose, galactose or uridine (n = 3, P < 2.1 × 10−5; e) or 5 mM of the indicated nucleosides (n = 3, P < 2.0 × 10−7; f). Data are shown as the mean ± s.e.m. with two-sided t-test relative to control cells. g, Schematic of RNA highlighting its ribose groups. h, Intracellular abundance of the four nucleoside precursors of RNA in control or UPP1-FLAG-expressing K562 cells grown in sugar-free medium supplemented with 0.5 mg ml−1 purified yeast RNA after 24 h. Data are expressed as fold changes of sugar-free medium (n = 4, P < 1.2 × 10−6) and shown as the mean ± s.e.m. with two-sided t-test relative to control. i, Cell growth assays of control or UPP1-FLAG-expressing K562 cells in sugar-free medium supplemented with 0.5 mg ml−1 of purified yeast RNA (n = 3, P < 2.6 × 10−5). Data are shown as the mean ± s.e.m. with two-sided t-test relative to control cells. All growth assays, metabolomics and screens included 4 mM l-glutamine and 10% dialysed FBS. Source data
Fig. 2
Fig. 2. Uridine-derived ribose contributes to the pentose phosphate pathway and glycolysis.
a, Schematic of a genome-wide CRISPR–Cas9 depletion screen comparing the proliferation of UPP1-FLAG-expressing K562 cells in sugar-free medium containing 10 mM glucose or uridine after 21 d (n = 2), in the absence of supplemental pyruvate and uridine. b, Gene-level analysis of a genome-wide CRISPR–Cas9 screen in glucose versus uridine reported as z-scores relative to non-cutting controls in glucose (zglu) and uridine (zu; n = 10,442 expressed genes, n = 2 replicates). c, Differential sensitivity of UPP1-FLAG-expressing K562 cells treated with the indicated sgRNAs targeting enzymes of upper glycolysis (n = 4, P < 8.7 × 10−11, P < 3.2 × 10−10, P < 6.4 × 10−5), the PPP (n = 4, P < 5.7 × 10−8, P < 7.6 × 10−8, P < 2.1 × 10−5, P < 6.3 × 10−7) or the salvage of uridine for pyrimidine synthesis (n = 3) in glucose versus uridine, expressed as the fold change of glucose and compared to control sgRNAs (n = 11). Data are shown as the mean ± s.e.m. after 4–5 d. P values were calculated using a two-sided Student’s t-test relative to control sgRNAs. Statistics were not adjusted for multiple comparisons. d, Lactate determination in medium containing 10 mM glucose, galactose or uridine (sugar-free) after 3 h (n = 3 replicate wells, P < 7.8 × 10−7). Data are shown as the mean ± s.e.m. with two-sided t-test relative to control cells. e, Labelling with 13C5-uridine ([1′,2′,3′,4′,5′-13C5]uridine; labelled carbon atoms in the ribose of uridine are indicated in magenta) and 13C5-uridine tracer analysis of representative intracellular metabolites from the PPP, glycolysis and the TCA cycle in control or UPP1-FLAG-expressing K562 cells (n = 3). Data are shown as the mean ± s.e.m. and are corrected for natural isotope abundance. f, 13C5-uridine tracer analysis of liver metabolites 30 min after intraperitoneal injection in overnight fasted mice with 0.4 g per kg body weight shown as the percentage of 13C-labelled intermediates compared to the total pool. Data are shown as the mean ± s.e.m. and are corrected for natural isotope abundance (n = 4 mice). g, Schematic of uridine-derived ribose catabolism integrating gene essentiality results in glucose versus uridine. Gln, glutamine; Asp, aspartate. All growth assays and metabolomics experiments included 4 mM (DMEM) l-glutamine and 10% dialysed FBS. a.u., arbitrary units. Source data
Fig. 3
Fig. 3. Capacity for glycolysis from uridine is governed by lineage and transcriptional control of UPP1/UPP2 gene expression.
a, Schematic of the PRISM screen with 482 cancer cells lines grown for 6 d in sugar-free medium complemented with 10 mM glucose or uridine (n = 2). b, Lineage analysis (n = 22 lineages) highlighting growth on uridine as compared to glucose. False discovery rates (FDRs) were calculated using a Benjamini–Hochberg algorithm correcting for multiple comparisons. c,d, Correlation between uridine growth and expression of transcripts (n = 8,123; c) and proteins (n = 3,216; d) across cancer cell lines. e, Correlation between gene copy number (n = 5,950) and growth on uridine across the cell lines, highlighting chromosome 7p. UPP1 is encoded on Chr7p12.3. f, Cell growth assay in sugar-free medium complemented with 10 mM glucose or uridine of a panel of melanoma (n = 9) and non-melanoma (n = 3, 293T, K562 and HeLa) cell lines. Data are shown as the mean ± s.e.m. (n = 4). MDA, MDA-MB-435S. g, Cell growth assay of melanoma UACC-257 wild-type (UPP1WT) and knock-out (UPP1KO) clones in sugar-free medium complemented with 10 mM of glucose or uridine. Data are shown as the mean ± s.e.m. (n = 3, P < 7.4 × 10−6, P < 2.2 × 10−4, P < 5.3 × 10−6) with two-sided t-test relative to UPP1WT cells in the same medium. h, 13C5-uridine tracer analysis reporting representative intracellular metabolites from the PPP, glycolysis and the TCA cycle in UACC-257 wild-type (UPP1WT) and two knock-out (UPP1KO) clones after 5 h (n = 4, P < 1.2 × 10−9, P < 2.2 × 10−12, P < 2.6 × 10−8, P < 6.1 × 10−9, P < 8.7 × 10−9, P < 8.2 × 10−8). ik, Expression of UPP1 (Upp1) and IL1B (Il1b) in human THP1 cells (n = 4, P < 1.7 × 10−3, P < 1.9 × 10−6, P < 2.2 × 10−6, P < 1.4 × 10−7; i), human M-CSF-matured PBMCs (n = 4 donors, P < 1.5 × 10−2, P < 5.5 × 10−5, P < 1.2 × 10−3, P < 8.4 × 10−5; j) and BMDMs (n = 3 mice, P < 1.6 × 10−2, P < 5.9 × 10−2, P < 2.5 × 10−3, P < 2.0 × 10−2, P < 1.9 × 10−3, P < 4.4 × 10−4; k) after treatment with 100 nM phorbol myristate acetate (PMA) for 48 h (THP1), 100 ng ml−1 lipopolysaccharides (LPS; THP1, BMDMs), 1 mg ml−1 purified yeast RNA (THP1, PBMCs, BMDMs) or 5 µg ml−1 of TLR7/TLR8 agonist (R848) for 24 h and as determined by quantitative PCR (qPCR). l, 13C5-uridine tracer analysis reporting incorporation in media lactate from BMDMs treated for 24 h with 5 µg ml−1 R848 and further grown for 16 h in glucose-free DMEM containing 5 mM 13C5-uridine and 5 µg ml−1 R848 (n = 3 mice, P < 1.4 × 10−3, P < 3.6 × 10−5, P < 6.8 × 10−6). Data are shown as the mean ± s.e.m. with two-sided t-test relative to untreated cells. Source data
Fig. 4
Fig. 4. Glycolysis from uridine bypasses the regulated steps of upper glycolysis and supports OXPHOS-deficient cells.
a, Schematic of glycolysis inhibition by OXPHOS. G6P, glucose-6-phosphate. b, Representative ECAR in UPP1-expressing K562 cells grown in sugar-free medium with and without supplementation of 10 mM of glucose, galactose or uridine, with n = 30 replicate wells. O, oligomycin; C, CCCP; A, antimycin A. Data are shown as the mean ± s.d. c, 13C5-uridine tracer analysis reporting intracellular lactate in UACC-257 melanoma cells in glucose-free RPMI medium containing 5 mM 13C5-uridine and in competition with increasing amount of unlabelled glucose (0, 1, 5, 10 and 25 mM) or treated with 100 nM antimycin A, all after 5 h (n = 4, P < 1.7 × 10−4, P < 4.9 × 10−3, P < 1.8 × 10−5, P < 5.9 × 10−5, P > 0.05). Data are shown as the mean ± s.e.m. and are corrected for natural isotope abundance. P values were calculated using a two-sided Student’s t-test. Statistics were not adjusted for multiple comparisons. d, Percentage of dead cells in UPP1-expressing K562 cells grown in 5 mM glucose or galactose supplemented with 5 mM uridine (U) and antimycin A (anti. A). Data are shown as the mean ± s.e.m. with two-sided t-test relative to control K562 cells (n = 4, P < 3.9 × 10−5). Source data
Extended Data Fig. 1
Extended Data Fig. 1. Additional analysis of the ORF screen.
(a) Replicate plot and Pearson correlation (R) of n = 2 replicate ORF screens in glucose and galactose highlighting UPP1 and UPP2 ORFs shown as log2 TPM + 1, or log2 fold of day 0. (b) Representation of all six UPP ORFs, expressed as read per million in the global population of glucose or galactose-grown cells and as a function of time (n = 2). TRCN0000470579 encodes a splice variant of UPP1 that is N-terminal truncated and lacks the uridine binding site (NM_001287428.2). (c) Top 10 ontologies associated with the ORFs enriched and depleted in galactose relative to glucose. The complete gene ontology analysis is reported in the Supplementary Data Table 1. (d) Protein immunoblot of K562 cells expressing UPP1-FLAG grown for 16 h in sugar-free media supplemented with 10 mM of glucose or uridine and immunolabelled with antibodies to total S6 ribosomal protein and phosphorylated S6 ribosomal protein (p-S6). Representative of n = 2 experiments. Total S6 loading control was performed on the same gel. All growth assays and screens included 4mM L-glutamine and 10% dialyzed FBS. Source data
Extended Data Fig. 2
Extended Data Fig. 2. Genome-wide CRISPR–Cas9 screen and gene ontology analysis in glucose and uridine.
(a) Replicate plot and Pearson correlation (R) analysis of n = 2 replicate genome-wide CRISPR–Cas9 screens in glucose and uridine highlighting genes of de novo pyrimidine synthesis, glycolysis and the PPP. Data are shown as log2 TPM + 1, or log2 fold of day 7. Top: Data shown at the individual sgRNA level. Bottom: Data shown at the gene level. (b) Top 10 ontologies associated with the genes enriched and depleted in uridine relative to glucose. Only 8 terms scored for the analysis of essential genes in uridine. The complete gene ontology analysis is reported in the Supplementary Data Table 1. Source data
Extended Data Fig. 3
Extended Data Fig. 3. CRISPR–Cas9 screen validation.
(a) Differential sensitivity to small molecule inhibitors of the PPP (OT: oxythiamine) or de novo pyrimidine synthesis (brequinar) in glucose vs uridine in UPP1-FLAG expressing K562 (n = 3, P < 2.2 × 10⁻³, P < 4.9 × 10⁻⁶) after 4 days, reported as fold of DMSO. Data are shown as ±SEM with two-sided t-test relative DMSO. (b) Immunoblot analysis of proteins from upper glycolysis, the PPP and pyrimidine salvage in UPP1-expressing K562 cells treated with their corresponding sgRNAs. UCK1 is expressed at low levels in K562 cells and its protein could not be detected. Representative of n = 2 experiments. (c) Simplified representation of the uridine salvage pathway and thymidine synthesis. TUBB and Actin loading controls were performed on the same gels. All growth assays and screens included 4mM L-glutamine and 10% dialyzed FBS. Source data
Extended Data Fig. 4
Extended Data Fig. 4. Additional metabolomics analysis.
(a) Steady-state abundance of representative intracellular metabolites from the pentose phosphate pathway (PPP) and glycolysis in sugar-free media complemented with 10 mM glucose, 10 mM galactose or 10 mM uridine, in the presence of 4mM L-glutamine and 10% dialyzed FBS (n = 3 replicate wells, P < 2.2 × 10⁻⁵, P < 8.1 × 10⁻⁴, P < 4.7 × 10⁻⁷, P < 1.4 × 10⁻⁴). Data are shown as mean ± SEM with two-sided t-test relative to control cells. (b) 13C5-uridine tracer analysis of liver and blood uridine 30 min after intraperitoneal injection in fed or overnight fasted mice with 0.4 g/kg 13C5-uridine (n = 3 replicate wells, P < 2.3 × 10⁻⁴, P < 2.9 × 10⁻⁴, P < 1.4 × 10⁻², P < 9.3 × 10⁻⁵). Data are shown as mean ± SEM (c) 13C5-uridine tracer analysis of liver ribose-phosphate (ribose-P) and circulating lactate and glucose 30 min after intraperitoneal injection in overnight fasted and (d) in fed animals with 0.4 g/kg 13C5-uridine. Data are shown as mean ± SEM and are corrected for natural isotope abundance (n = 4 mice in each group). (e) 13C5-uridine tracer analysis of liver ribose-phosphate, blood lactate and blood glucose 30 min after intraperitoneal injection in fed mice with 0.4 g/kg 13C5-uridine shown as the percentage of 13C-labeled intermediate compared to the total pool. Data are shown as mean ± SEM and are corrected for natural isotope abundance (n = 4 mice). See also (f) qPCR determination in the liver of ad libitum fed mice, or fasted for 12 h or 24 h, with probes to Upp1, Upp2 and Hmgc2. Hmgc2 transcripts are expected to increase with fasting. Data are shown as mean ± SEM (n = 3 mice in each group). Source data
Extended Data Fig. 5
Extended Data Fig. 5. PRISM screen replicate analysis.
Replicate plot and correlation analysis of n = 3 replicate PRISM screens in glucose and uridine highlighting the melanoma and glioma lineages and showing Pearson correlation between replicates (R). Source data
Extended Data Fig. 6
Extended Data Fig. 6. UPP1, UPP2 and MITF expression across the CCLE collection and in melanoma.
(a) UPP1, UPP2 and MITF expression across the complete CCLE collection (n = 30 lineages). (b) Protein immunoblot of a panel of melanoma (n = 9) and non-melanoma (n = 3, 293T, K562 and HeLa) cell lines grown and showing expression of UPP1 as well as MITF, TYR and MLANA, three melanoma markers. MDA: MDA-MB-435S. (c) Top: Immunoblot of UACC-257 melanoma cells with wild-type (UPP1WT) and knock-out (UPP1KO). Bottom: Immunoblot of MDA-MB-435S melanoma cells in wild-type (UPP1WT), knock-out (UPP1KO) and hypomorphic (UPP1hypo) clones (see methods). (d) Cell growth assay of MDA-MB-435S clones in sugar-free media containing dialyzed FBS complemented with 10 mM of either glucose or uridine and dialyzed FBS. Negative doublings indicate cell death. Data are shown as mean ± SEM with two-sided t-test relative to UPP1WT cells in the same media (n = 3 replicate wells, P < 2.9 × 10⁻⁶, P < 1.3 × 10⁻⁵, P < 3.1 × 10⁻⁷). (e) Cell growth assay of three melanoma cell lines with high UPP1 expression in sugar-free media complemented with 10 mM of glucose or 0.5 mg/mL of RNA. Data are shown as mean ± SEM with two-sided t-test relative to UPP1WT and were not corrected for multiple comparison (n = 3 replicate wells, P < 4.5 × 10⁻³, P < 1.3 × 10⁻⁴, P < 1.5 × 10⁻³. TUBB and Actin loading controls were performed on the same gels. All growth assays and screens included 4mM L-glutamine and 10% dialyzed FBS. Source data
Extended Data Fig. 7
Extended Data Fig. 7. MITF promotes UPP1 expression and growth on uridine in melanoma cells.
(a) Protein immunoblot and (b) cell growth assay of LOX-IMVI in sugar-free media supplemented with 10 mM of glucose or 10 mM of uridine. LOX-IMVI is a melanoma cell line with low endogenous MITF expression and over-expressing MITF or a control gene. Data are shown as mean ± SEM (n = 3, P < 6.6 × 10⁻⁵). P values were calculated using a two-sided student T test. Statistics were not adjusted for multiple comparison. (c) MITF occupancy in UPP1 transcription start site (TSS) and promoter (a region 3.5 kb away from the TSS), as determined by ChIP-Seq in COLO829 melanoma cells. (d) ChIP-qPCR validation of MITF binding in UPP1 promoter and TSS in MDA-MB-435S melanoma cells. TYR is a known transcriptional target of MITF, ACTB is not. Data are shown as mean ± SEM (n = 3, P < 1.1 × 10⁻¹, P < 2.4 × 10⁻², P < 2.9 × 10⁻²) with two-sided t-test relative to control IgG. (e) qPCR analysis of five melanoma cells after treatment with MITF siRNA (n = 3, P < 7.0 × 10⁻³, P < 9.6 × 10⁻⁴, P < 1.3 × 10⁻², P < 3.6 × 10⁻⁵). Data are shown as mean ± SEM with two-sided t-test relative to the indicated control. TUBB loading controls were performed on the same gels. All growth assays and screens included 2 mM (RPMI) or 4 mM (DMEM) L-glutamine and 10% dialyzed FBS. Source data
Extended Data Fig. 8
Extended Data Fig. 8. UPP1 expression and uridine catabolism for energy production in the monocytic lineage.
(a) Protein immunoblot of human THP1 monocytic cells treated with 100 nM PMA alone for 48 h followed by the addition of 100 ng/mL LPS or 1 mg/mL purified yeast RNA for another 48 h and immunoblotted with antibodies to UPP1 and TUBB. Western blot quantification is shown as fold of untreated cells (monocytes). (b) Protein immunoblot of human MCSF-matured PBMC treated with 5 µg/ml R848 for 24 h and immunoblotted with antibodies to UPP1 and Actin (n = 3 donors). Western blot quantification is shown as fold of untreated cells and relative to each donor. (c) Expression of UCK1 and UCK2 in THP1 cells as determined by qPCR after treatment as in (a). Data are shown as mean ± SEM with n = 4. (d) 13C5-uridine tracer analysis of UMP in THP1 cells treated as in (a) with the exception that glucose-free RPMI media containing 5 mM 13C5-uridine was used. Data are shown as mean ± SEM with n = 4. (e) Expression of Upp1 and Il1b in BMDM as determined by qPCR after co-treatment for 24 h with 5 µg/ml R848 and 5 µg/ml BMS-345541, an IKK inhibitor. Data are shown as mean ± SEM with two-sided t-test relative to untreated (n = 3 mice, P < 1.8 × 10⁻², P < 4.5 × 10⁻²). (f) 13C5-uridine tracer analysis of citrate and lactate in THP1 cells treated as in (a) with the exception that glucose-free RPMI media containing 5 mM 13C5-uridine was used for the last 6 h. Data are shown as mean ± SEM with two-sided t-test relative to PMA-treated cells with n = 4, P < 4.7 × 10⁻⁴, P < 1.5 × 10⁻², P < 1.2 × 10⁻², P < 2.2 × 10⁻². (g) 13C5-uridine tracer analysis of media lactate in human MCSF-matured PBMC cells treated as in (b) with the exception that glucose-free RPMI media containing 5 mM 13C5-uridine was used was used for the last 6 h. Data are shown as mean ± SEM, with n = 4 donors. TUBB and Actin loading controls were performed on the same gels. All metabolomics included 2 mM (RPMI) or 4 mM (DMEM) L-glutamine and 10% dialyzed FBS. Source data
Extended Data Fig. 9
Extended Data Fig. 9. Additional bioenergetics measurement in uridine or mannose-grown cells.
(a) Representative oxygen consumption rate (OCR) and extracellular acidification rate (ECAR) in control and UPP1-expressing K562 cells grown in sugar-free media or in media supplemented with 10 mM of glucose, galactose or uridine, all in the presence of glutamine and dialyzed FBS (n = 30 replicate wells). O: oligomycin. C: CCCP. A: antimycin A. Data are shown as mean ± SD with n > 6 replicate wells. (b) Total consumption of uridine in UACC-257 melanoma cells treated with antimycin A (100 nM) in the same media. Data are shown as mean ± SEM with n = 4. (c) Representative extracellular acidification rate (ECAR) in cells in 10 mM of glucose or mannose and treated as in (a). (d) Schematic representation of de novo pyrimidine synthesis and uridine auxotrophy during OXPHOS inhibition. CoQ: co-enzyme Q. Ox: oxidized. Red: reduced. All experiments included 4mM L-glutamine and 10% dialyzed FBS. Source data

References

    1. King MP, Attardi G. Human cells lacking mtDNA: repopulation with exogenous mitochondria by complementation. Science. 1989;246:500–503. doi: 10.1126/science.2814477. - DOI - PubMed
    1. Yang X, et al. A public genome-scale lentiviral expression library of human ORFs. Nat. Methods. 2011;8:659–661. doi: 10.1038/nmeth.1638. - DOI - PMC - PubMed
    1. Robinson BH, Petrova-Benedict R, Buncic JR, Wallace DC. Nonviability of cells with oxidative defects in galactose medium: a screening test for affected patient fibroblasts. Biochem. Med. Metab. Biol. 1992;48:122–126. doi: 10.1016/0885-4505(92)90056-5. - DOI - PubMed
    1. Loffler M, Wenzel A, Schneider F. Cytokinetic studies on the switch from glucose to uridine metabolism, and vice versa, of Ehrlich ascites tumour cells in vitro. Cell Tissue Kinet. 1987;20:181–190. - PubMed
    1. Reitzer LJ, Wice BM, Kennell D. Evidence that glutamine, not sugar, is the major energy source for cultured HeLa cells. J. Biol. Chem. 1979;254:2669–2676. doi: 10.1016/S0021-9258(17)30124-2. - DOI - PubMed

Publication types