. 2023 Jun;618(7963):110-117.
doi: 10.1038/s41586-023-05936-6. Epub 2023 May 17.

Ancient gene linkages support ctenophores as sister to other animals

Affiliations

Ancient gene linkages support ctenophores as sister to other animals

Darrin T Schultz et al. Nature. 2023 Jun.

Abstract

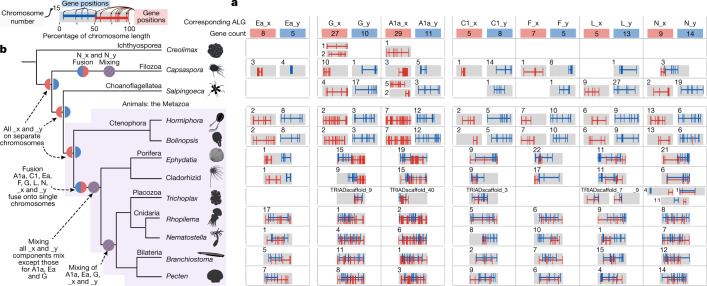
A central question in evolutionary biology is whether sponges or ctenophores (comb jellies) are the sister group to all other animals. These alternative phylogenetic hypotheses imply different scenarios for the evolution of complex neural systems and other animal-specific traits1-6. Conventional phylogenetic approaches based on morphological characters and increasingly extensive gene sequence collections have not been able to definitively answer this question7-11. Here we develop chromosome-scale gene linkage, also known as synteny, as a phylogenetic character for resolving this question12. We report new chromosome-scale genomes for a ctenophore and two marine sponges, and for three unicellular relatives of animals (a choanoflagellate, a filasterean amoeba and an ichthyosporean) that serve as outgroups for phylogenetic analysis. We find ancient syntenies that are conserved between animals and their close unicellular relatives. Ctenophores and unicellular eukaryotes share ancestral metazoan patterns, whereas sponges, bilaterians, and cnidarians share derived chromosomal rearrangements. Conserved syntenic characters unite sponges with bilaterians, cnidarians, and placozoans in a monophyletic clade to the exclusion of ctenophores, placing ctenophores as the sister group to all other animals. The patterns of synteny shared by sponges, bilaterians, and cnidarians are the result of rare and irreversible chromosome fusion-and-mixing events that provide robust and unambiguous phylogenetic support for the ctenophore-sister hypothesis. These findings provide a new framework for resolving deep, recalcitrant phylogenetic problems and have implications for our understanding of animal evolution.


Conflict of interest statement

R.E.G. and D.S.R. are paid consultants and equity holders of Dovetail Genomics. D.T.S. is a shareholder of Pacific Biosciences of California. The other authors declare no competing interests.

Figures

Fig. 1
Fig. 1. Conserved synteny and the phylogenetic position of ctenophores and sponges.
a, Two alternative metazoan phylogenetic hypotheses, with either ctenophores (left) or sponges (right) as sister to all other animals. b,c, Specimens of species of which the genomes are reported here. Scale bars, 1 cm. b, The lobate ctenophore B. microptera from the Monterey Bay, California. c, Undescribed cladorhizid demosponge collected offshore of Big Sur, California at a depth of 3,975 m. d, Ribbon diagram showing conserved syntenies among animals (α ≤ 0.05, permutation test one-sided false-discovery rate), including (from top to bottom) two ctenophores (B. microptera (BMI) and H. californensis); the jellyfish R. esculentum; the bilaterian amphioxus B. floridae; and two demosponges (E. muelleri and the cladorhizid demosponge). Each horizontal black bar represents a chromosome. The vertical lines between species represent orthologous genes, coloured according to the BCnS synteny groups. Only groups of genes that have significantly conserved chromosome-scale linkage (synteny) between metazoan species are shown. There is extensive 1:1 conserved chromosomal synteny between the two ctenophores, consistent with the conserved ctenophore karyotype. Orthologous gene pairs in the two ctenophores that do not participate in conserved syntenies with BCnS are shown in grey. Photography credits: Shannon Johnson © 2019 MBARI (b), © 2021 MBARI (c).
Fig. 2
Fig. 2. Patterns of conserved synteny between animals and outgroups, and their implications.
a,b, Conserved linkages between the chromosomes of animals and two non-animal outgroups (α ≤ 0.05, permutation test one-sided false-discovery rate). a, The filasterean amoeba C. owczarzaki. b, The choanoflagellate S. rosetta. Each synteny group (conserved between metazoans and an outgroup) was assigned a distinct colour (different from Fig. 1). cg, Schematics showing phylogenetic information (ancestor to OABC (c); ancestral fusion or outgroup fission (d); derived fusion (e); fusion and lineage-specific mixing (f); and irreversible fusion with mixing (g)) conveyed by patterns of conserved synteny based on a quartet analysis. Node O designates the outgroup, and nodes A, B and C are ingroups of which the phylogenetic branching is to be determined. The thin red and blue lines in dg represent genes of distinct synteny groups on different chromosomes in at least one species. Changes in syntenic characters are indicated schematically on parsimonious phylogenies on the left of each diagram. d,e, Single-species differences are phylogenetically uninformative. f,g, Shared chromosomal distributions between outgroup O and one of the ingroups (labelled taxon A) imply that the other two ingroups (taxa B and C) are related by fusion of ancestral synteny groups. f and g differ in whether all fusions have subsequently mixed. Fusion with mixing (g) is the strongest phylogenetic character because it represents an irreversible change, as discussed in the main text. h,i, Subsets of the synteny groups shown in a and b (Capsaspora (h) and Salpingoeca (i)) that match the phylogenetically informative patterns indicated in f and g. In all such cases, ctenophore syntenies match the outgroup and sponges share fusions with bilaterians and cnidarians. Note that groups A1a and G are found in both outgroups. We did not observe any cases in which sponge syntenies match the outgroup to the exclusion of ctenophores, bilaterians and cnidarians.
Fig. 3
Fig. 3. Phylogenetically informative syntenies support ctenophores as the sister clade to other animals.
a, The rows represent the species considered in our analyses. The top three rows are non-metazoan outgroups. Columns show pairs of phylogenetically informative and significantly large metazoan syntenies (α ≤ 0.05, permutation test one-sided false-discovery rate), labelled according to their BCnS names (A1a, C1 and so on) with the suffix _x or _y denoting subgroups shared across metazoans. The number of genes participating in each metazoan synteny group is indicated in red and blue rectangles at the top of each column. Only genes with defined orthologues in outgroups are shown here. Extended Data Fig. 8 shows a larger set of genes requiring only metazoan orthologues. Inset: the convention for representing gene distributions on chromosomes (top left). The grey rectangles represent chromosomes (or large scaffolds in the placozoan Trichoplax). The chromosome number or scaffold name is located above or to the left of the grey rectangle. Red and blue vertical hashes represent the relative position of genes participating in phylogenetically informative pairs of metazoan synteny groups. b, The most parsimonious phylogeny according to the logic of Fig. 2c–g (Extended Data Fig. 4 and Supplementary Information 4), the results of ref. and the accepted monophyly of demosponges.
Fig. 4
Fig. 4. Phylogenetic analysis of patterns of conserved synteny and alternative interpretations.
a, Bayesian phylogenetic analysis of conserved syntenies supports monophyly of the group comprising demosponges, Cnidaria and Bilateria, to the exclusion of Ctenophora, with high posterior probability (red arrow: 1.0, 100,000 generations with 25% burn-in). Bayesian analysis was run on both constrained (per-phylum constrained tree shown) and unconstrained tree topologies (Supplementary Information 14 and Supplementary Data 6). This panel corresponds to Supplementary Fig. 14.1c. b, Character transitions involving ALGs C1, F, L and N in Fig. 3 are most parsimoniously interpreted as fusion with mixing on the myriazoan stem after divergence from ctenophores, which retain the ancestral metazoan state as inferred from outgroup comparisons. c,d, To interpret the observed patterns under the alternative sponge-sister hypothesis would require unlikely convergent chromosomal changes (either convergent fusions (c) or exact unmixing and fissions to the ancestral state (d)) that were not seen in our genomes. e, The number of genes in the genome-shuffling simulations (n = 1 × 108) that support the ctenophore-sister (upper) or sponge-sister (lower) hypothesis. For the ctenophore Hormiphora, the number of fusion-with-mixing events is significantly higher in the observed genomes (vertical red bars) than in the Hormiphora genome-shuffling simulations (vertical grey histogram bars). Significance is shown as the one-sided false-discovery rate, α, of a genome-shuffling permutation test. There were no groups of genes that supported the sponge-sister hypothesis in the real genomes, and none occurred in the genome-shuffling simulations. f, Additional statistical measures also support only the ctenophore (cteno.)-sister hypothesis in genome-shuffling simulations of Hormiphora, Capsaspora (COW), Salpingoeca (SRO), Ephydatia (EMU) and Rhopilema. PI ALG, phylogenetically informative linkage groups. The shape indicates the treatment; the colour indicates the outgroup. The full figure is shown in Extended Data Fig. 10. g, Summary of phylogenetic relationships among animals and close outgroups including syntenic characters. Myriazoa (underlined) is the name proposed for the clade containing extant animals, except Ctenophora. Outgroup topology follows ref. .
Extended Data Fig. 1
Extended Data Fig. 1. Genomes of one ctenophore and two sponges.
a. The k-mer spectrum of the Bolinopsis data suggests that the animal is diploid, and the 1n genome size is approximately 254 Mbp. b. The Bolinopsis microptera genome assembly contains 13 chromosome-scale scaffolds, which account for 97.23% of the total bases in the assembly. Panel shows the Hi-C contact map. c. The cladorhizid sponge individual used in the genome sequencing at its collection site. d. This sponge was bioluminescent when mechanically disturbed. e. Its mitochondrial sequence is 99.2% identical to the previously identified bioluminescent cladorhizid sponge. f. The estimated genome size of this sponge is 1.11 Gb, and the spectrum is consistent with diploid organisms. g.,h. Each haplotype’s genome assembly has 18 chromosome-scale scaffolds based on chromatin confirmation data as shown. In haplotype A 94.2% of bases are in the chromosome-scale scaffolds. i. A whole-genome alignment of haplotypes A and B showed a high degree of concordance. j. The hexactinellid sponge collected and sequenced for this study. k. The estimated genome size is 1n = 141 Mb. l. Haplotype A contains only one haplotype of chromosome-scale scaffolds orthologous with the scaffolds of the closely-related sponge Oopsacas minuta. Panel shows chromatin conformation capture contact map of haplotype A. m. In addition to the alternate haplotype of chromosome-scale scaffolds from haplotype A, the haplotype B assembly contains the large, gene-poor, unplaced scaffolds that lack detectable homology to other sponges. The Hi-C contact map for haplotype B shown. n. Whole-genome alignments of the two haplotypes show colinearity. Photograph credits: (d.) Darrin Schultz, (c., j.) © 2021 MBARI.
Extended Data Fig. 2
Extended Data Fig. 2. Chromosomes are largely conserved among metazoans.
The chromosome position of orthologous proteins plotted in panels a-n are coloured by orthologs in the previously identified ancestral bilaterian, cnidarian, and sponge linkage groups (BCnS-ALGs). Significant inter-species chromosome pairs (p ≤ 0.05, Bonferroni-corrected one-sided Fisher’s exact test) are opaque. a. The karyotype of the Pleurobrachiid and lobate ctenophores is conserved (1n = 13). b.-e. Ctenophore chromosomes share macrosynteny with BCnS-ALGs, but many BCnS ALGs are split onto several ctenophore chromosomes (red dotted boxes). There are many ctenophore-specific chromosome fusions. f.-h. Macrosynteny is highly conserved between distantly-related demosponges. The sponge lineages shown diverged an estimated 358 Mya - 500 Mya. f.-k. Macrosynteny is also conserved between sponge, bilaterian, and cnidarian genomes. Many chromosomes in a species of one clade have a one-to-one homologous chromosome in the other clade. The genomes of species in these clades can be described by 29 constituent BCnS-ALGs.
Extended Data Fig. 3
Extended Data Fig. 3. Sponge macrosynteny.
a.-c. There have been many genome rearrangements since the divergence of the demosponge Ephydatia and the tulip hexactinellid genome, and they share macrosynteny of only some BCnS linkage groups (p ≤ 0.05, Bonferroni-corrected one-sided Fisher’s exact test, opaque dots in a., rows in b., interspecies lines in c.). d. The sponge cladogram is based on Schuster et al. 2018. e. The orthologs in A1a_x and A1a_y are predominantly present on separate chromosomes in both the tulip hexactinellid and in Oopsacas minuta. f. A1a_x and A1a_y are on partly overlapping regions of single demosponge chromosomes, but are mixed on a single Chondrosia chromosome. However, the linkage groups A1a_x and A1a_y are on separate chromosomes in the ctenophores and the unicellular outgroup species. This evidence suggests that hexactinellid sponges retain the ancestral state of A1a_x and A1a_y being present on separate chromosomes. The possible evolutionary scenarios explaining this karyotype will require further chromosome-scale sequencing of sponge genomes.
Extended Data Fig. 4
Extended Data Fig. 4. Seven basic ALG configurations in species quartets.
a-g. The seven configurations of ALGs found in four species highlight the evolutionary history of chromosomes. The cartoon ribbon plot in each panel shows chromosomes (horizontal bars) and the positions of genes in two ALGs along those chromosomes (vertical blue or red lines, respectively). The cartoon Oxford dot plot in each panel shows the same information as the ribbon plot, but only in the context of the outgroup genome. The most parsimonious tree topology based on the ALG evolutionary history is also pictured.
Extended Data Fig. 5
Extended Data Fig. 5. Unicellular species chromosome-scale genome assemblies.
Hi-C heatmaps of a. Salpingoeca rosetta, b. Capsaspora owczarzaki, and c. Creolimax fragrantissima show that the assemblies are consistent with chromosome-scale assemblies of other unicellular species. d.-e. Genome-wide ICE-normalized 108 observed count contact maps for (d.) Salpingoeca, (e.) Capsaspora, and (f.) Creolimax are shown at MapQ0 and 10 kb resolution. Chromosome boundaries are drawn as solid black lines. The intersections of horizontal and vertical red lines mark the Centurion-estimated centromere positions. The Hi-C heatmaps of Capsaspora and Creolimax both contain inter-chromosomal hotspots that are consistent with centromeres in other species. g.-i. Protein orthology plots (Oxford dot plots) of the chromosome-scale genome assemblies compared to the previously published assemblies. Despite the lack of Hi-C data, the original scaffold assemblies for all three species were nearly chromosome-scale.
Extended Data Fig. 6
Extended Data Fig. 6. Visual representation of multi-species gene linkage conservation score.
a.-d. The dot plots of the C. owczarzaki genome show that there is conservation of the ALG_A1a linkage group in ctenophore, sponge, cnidarian, and bilaterian genomes. The conservation score can be calculated from shared gene linkages across many species. f. Due to the highly rearranged state of both the Hormiphora and Capsaspora genomes, a Bonferroni-corrected one-sided Fisher’s exact test only distinguishes three chromosome relationships as significant (p ≤ 0.05). e. Calculating the orthology conservation score for the relationships in these two genomes reveals more gene linkages that have been conserved across Filozoans. Red dots here are orthologs that are in significantly-conserved ortholog networks (α ≤ 0.05, permutation test). See complete results in Supplementary Information 11.
Extended Data Fig. 7
Extended Data Fig. 7. Filozoan and choanoflagellate genomes share macrosynteny with metazoans.
Two-way reciprocal best hits blast searches between the filasterean amoeba Capsaspora and animals (a.-d.), or between the choanoflagellate Salpingoeca and animals (d.-g.) show that the chromosomes of these unicellular species are rearranged relative to animal chromosomes, that some regions of synteny remain, and that some ALGs are split across multiple chromosomes of the unicellular species. Orthologs are coloured based on BCnS-ALGs from Simakov et al. 2022, and chromosome pairs with significantly-conserved macrosynteny (p ≤ 0.05, Bonferroni-corrected one-sided Fisher’s exact test) have opaque dots. Axis labels show cumulative number of orthologs. Putative centromeres are marked by dotted lines.
Extended Data Fig. 8
Extended Data Fig. 8. Mixing plots of HCA-EMU-RES reciprocal best blastp results.
This figure parallels Fig. 3 of the main text, but includes more genes by requiring orthology between metazoans without requiring orthologs in corresponding outgroups. Limiting the macrosynteny search to animals shows many genes participating in the extension of metazoan ALGs to the ctenophores. The _x and _y components of ALG_Ea and ALG_G are mixed and widely distributed across single sponge chromosomes, while the (COW/SRO)-HCA-EMU-RES results show no _x and _y overlap for ALG_Ea, and little overlap for ALG_G. We placed placozoans as the sister clade to cnidarians based on the findings of Simakov et al. 2022. See also Supplementary Information 13.2.2.
Extended Data Fig. 9
Extended Data Fig. 9. OrthoFinder results are consistent with the ctenophore-sister hypothesis.
a. Each green cell shows how many orthogroups support the ctenophore-sister hypothesis from each ALG in each species quartet. The Total Gene Count column is the total number of orthogroups supporting the ctenophore-sister hypothesis for that species quartet. The bottom row shows the number of unique orthogroups in each column. There are 146 orthogroups that support ctenophore-sister. b. The 11 orthologs that support CLA-sister in three analyses are due to a lineage-specific fission of ALG_H that is only found in the cladorhizid genome, but not in the genome of other sponges. Tree topology based on previous studies,109. c. The Capsaspora-cladorhizid chromosome pairs with the most genes from ALG_H (COW4-CLA13, COW4-CLA14) are not the chromosome pairs supporting sponge-sister (magenta circles, COW4-CLA13, COW6-CLA14). d.-h. The fission of ALG_H is specific to the cladorhizid sponge genome and is not found in the unicellular organism Capsaspora (COW), in other demosponges (EMU, CRE, PFI), in cnidarians (RES), or in bilaterians (not shown). Chromosome pairs that have significantly-conserved macrosynteny (p ≤ 0.05, Bonferroni-corrected one-sided Fisher’s exact test) have opaque dots.
Extended Data Fig. 10
Extended Data Fig. 10. Results of genome shuffling simulations.
a.-d. Shuffling one of the genomes before the COW-HCA-EMU-RES comparison shows that the rearranged state of the ctenophore genome, let alone the other species in the analysis, cannot explain the signal supporting the ctenophore-sister hypothesis (vertical red lines). e.-h. Shuffling simulations using SRO as the outgroup independently support the ctenophore-sister hypothesis. i. contains a legend to interpret panels a-h.

References

    1. Ryan JF, et al. The genome of the ctenophore Mnemiopsis leidyi and its implications for cell type evolution. Science. 2013;342:1242592. doi: 10.1126/science.1242592. - DOI - PMC - PubMed
    1. Halanych KM. The ctenophore lineage is older than sponges? That cannot be right! Or can it? J. Exp. Biol. 2015;218:592–597. doi: 10.1242/jeb.111872. - DOI - PubMed
    1. Jékely G, Paps J, Nielsen C. The phylogenetic position of ctenophores and the origin(s) of nervous systems. Evodevo. 2015;6:1. doi: 10.1186/2041-9139-6-1. - DOI - PMC - PubMed
    1. Ryan JF, Chiodin M. Where is my mind? How sponges and placozoans may have lost neural cell types. Philos. Trans. R. Soc. Lond. B. 2015;370:20150059. doi: 10.1098/rstb.2015.0059. - DOI - PMC - PubMed
    1. Moroz LL, et al. The ctenophore genome and the evolutionary origins of neural systems. Nature. 2014;510:109–114. doi: 10.1038/nature13400. - DOI - PMC - PubMed

Publication types