. 2023 Jun;618(7967):1024-1032.
doi: 10.1038/s41586-023-06057-w. Epub 2023 May 17.

ERα-associated translocations underlie oncogene amplifications in breast cancer

Affiliations

ERα-associated translocations underlie oncogene amplifications in breast cancer

Jake June-Koo Lee et al. Nature. 2023 Jun.

Abstract

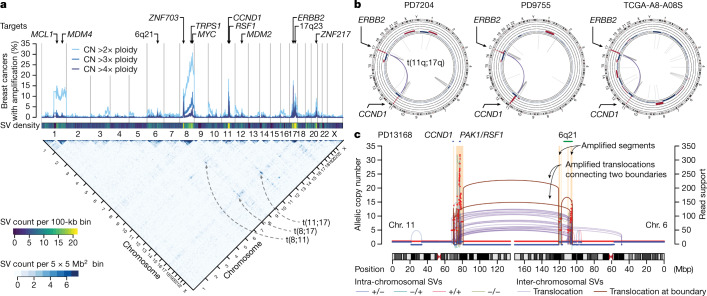
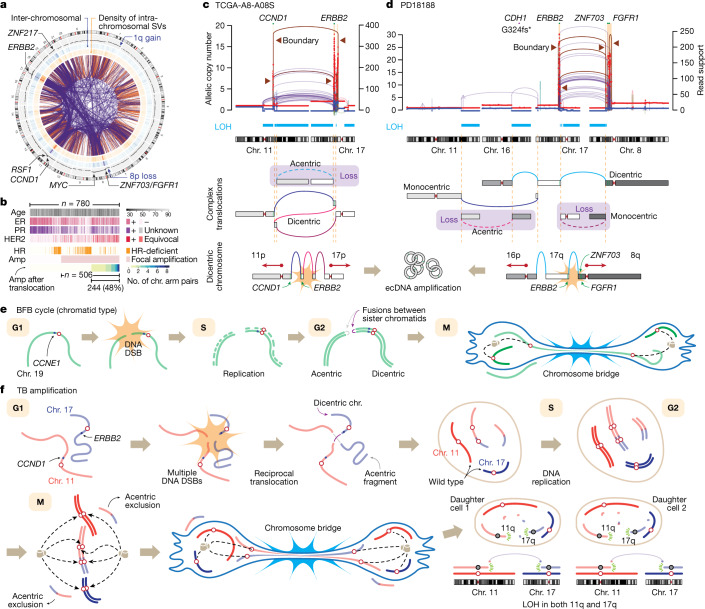
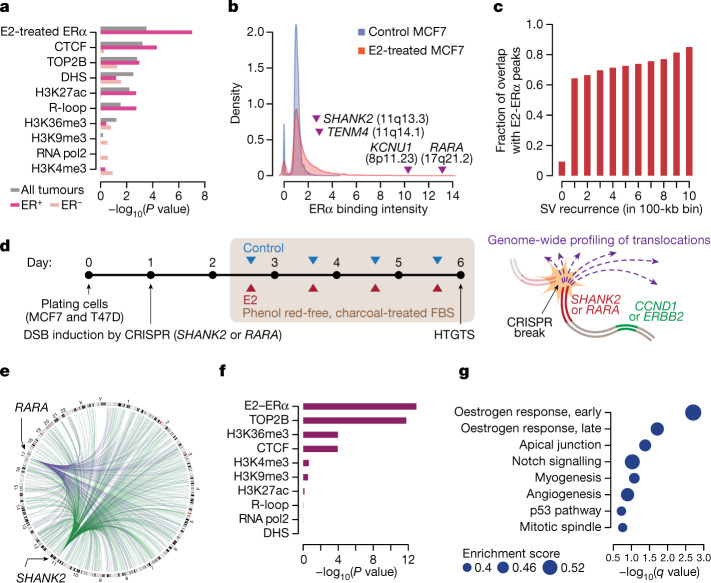
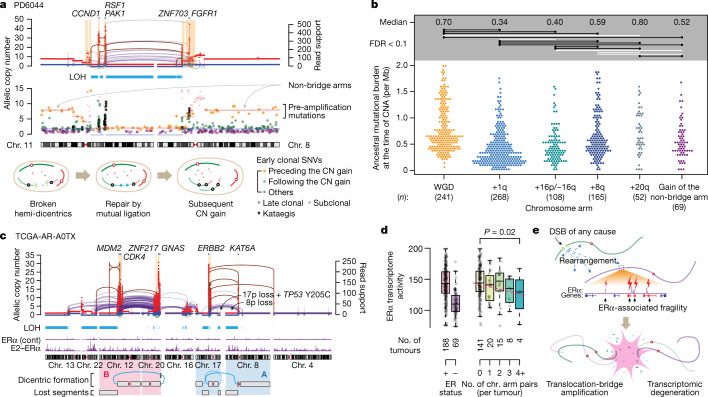
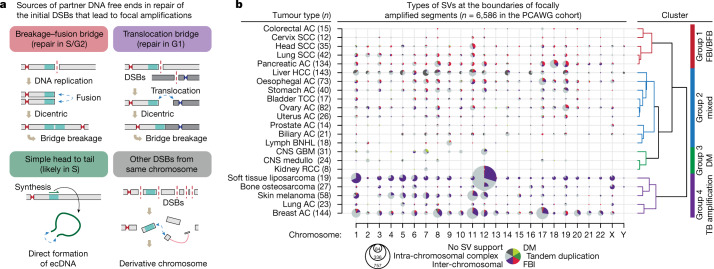
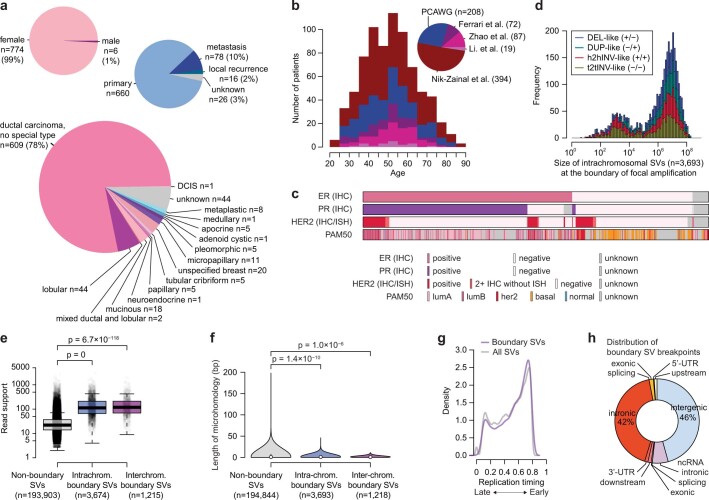
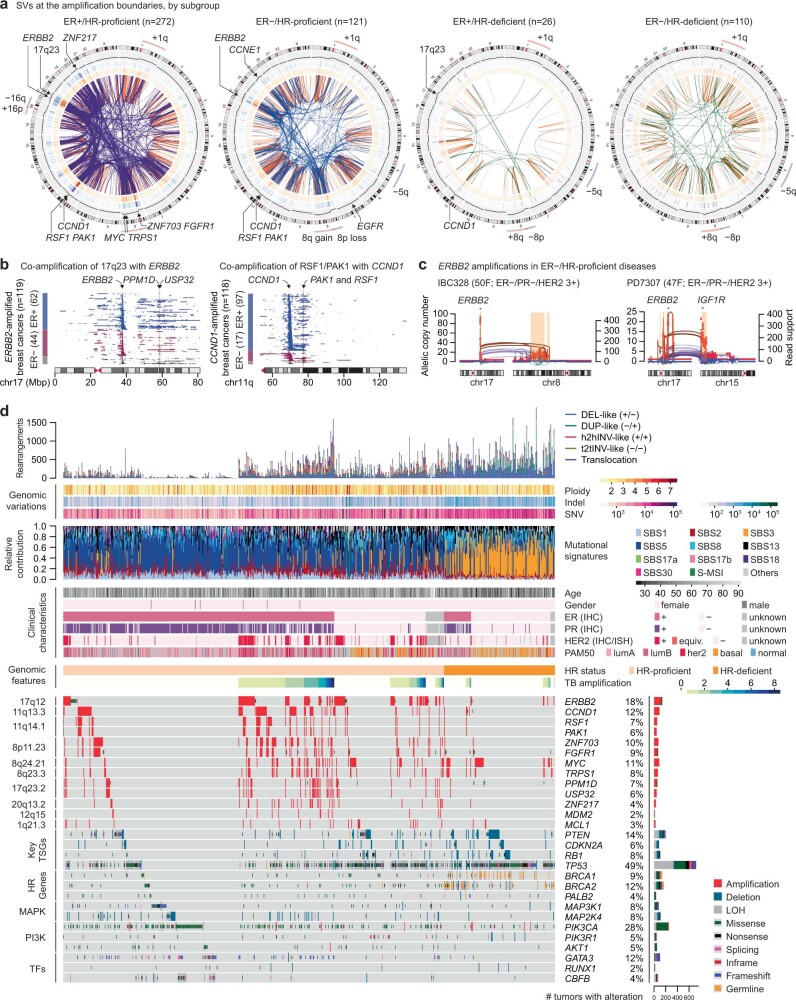
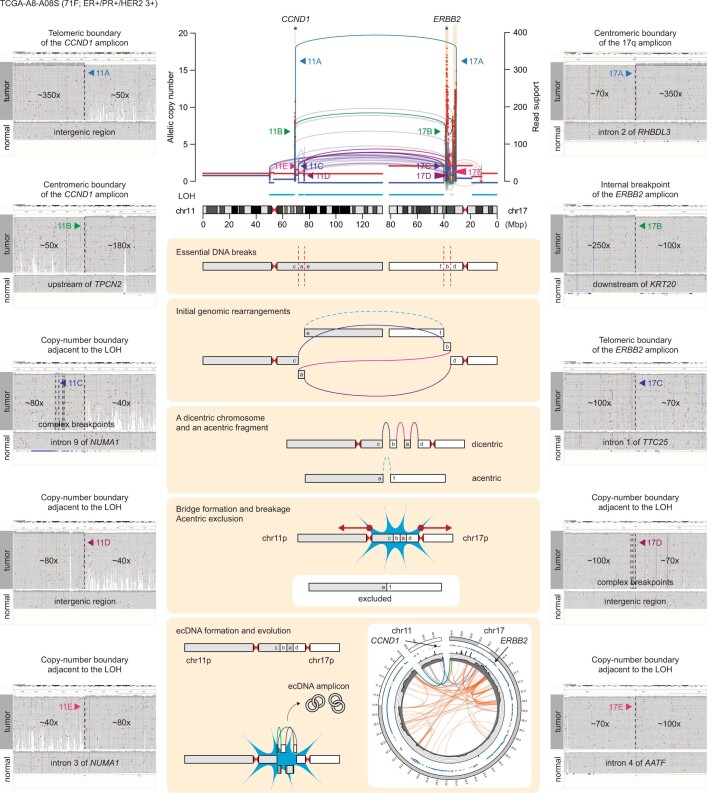
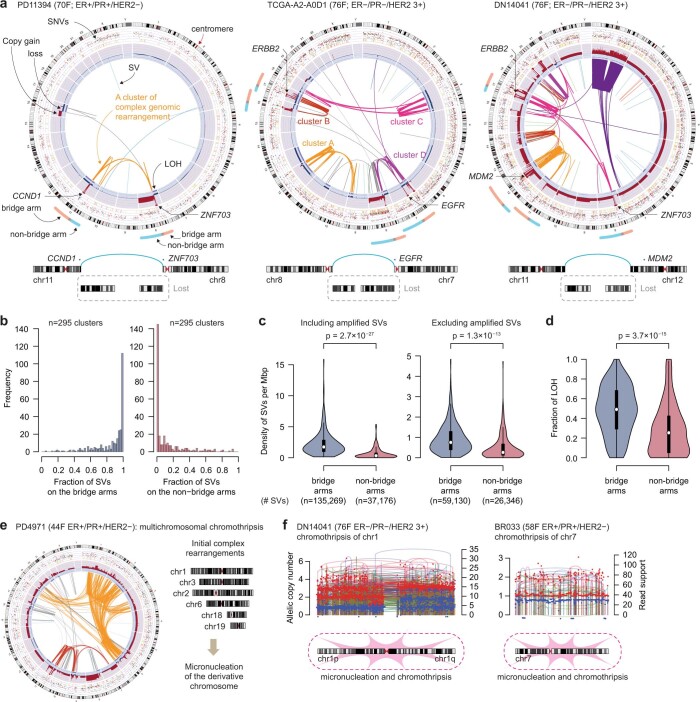
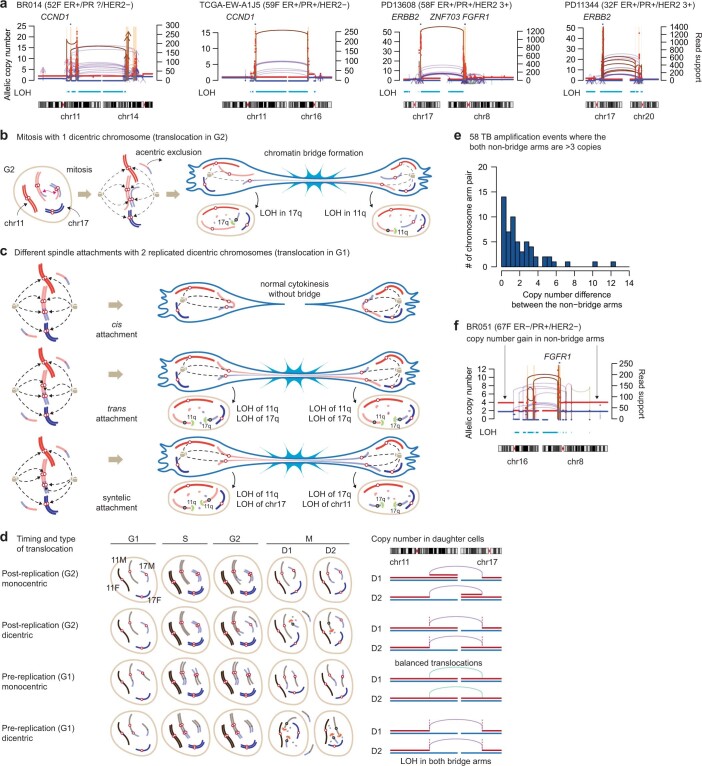
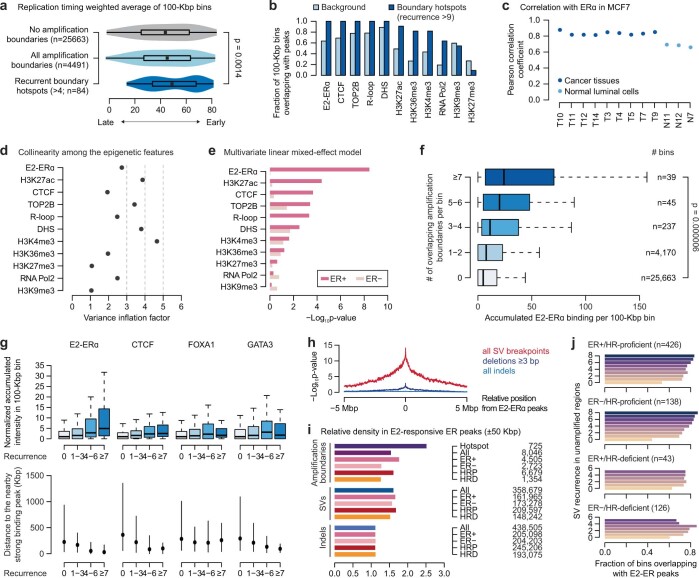
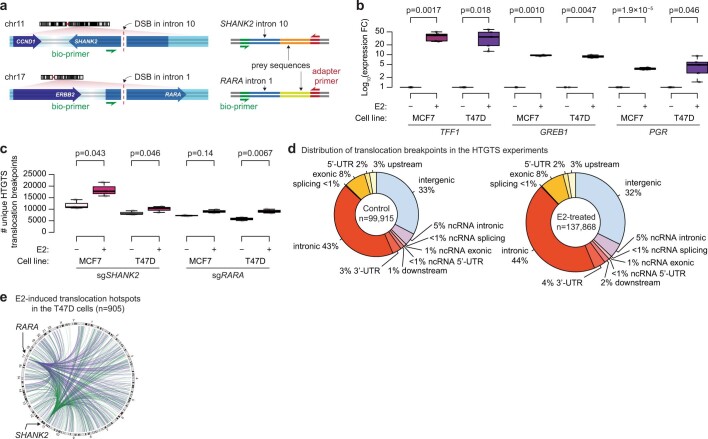
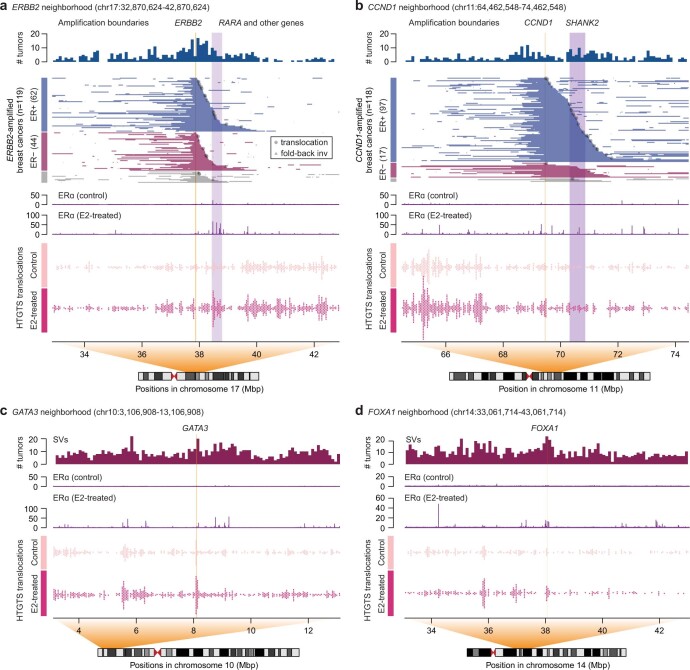
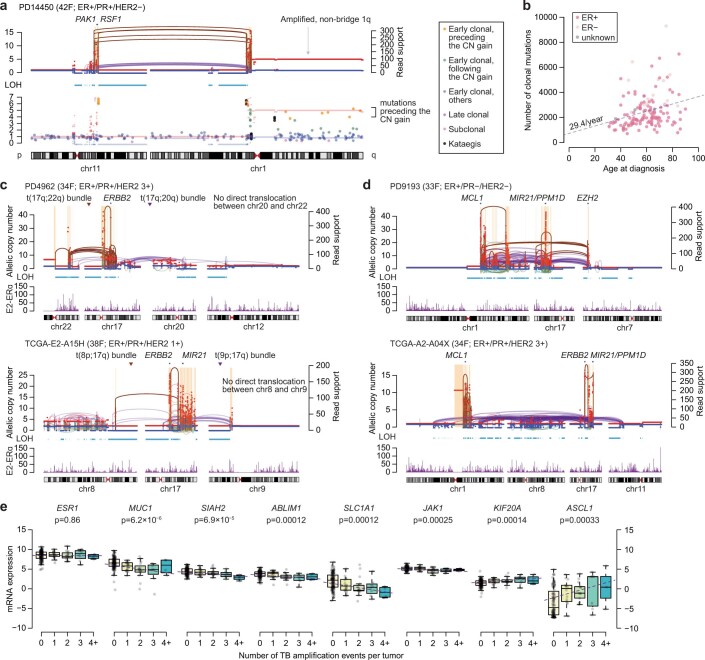
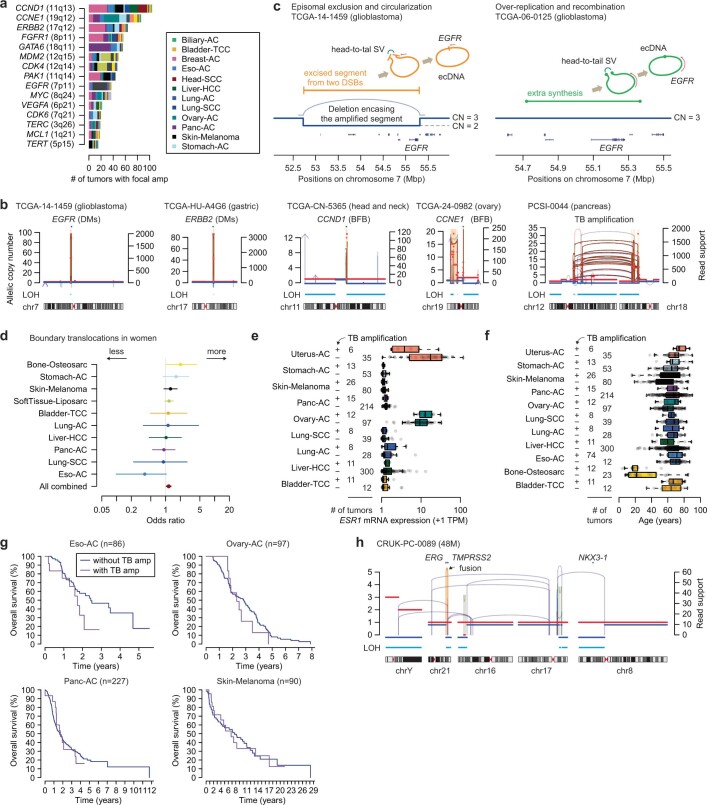
Focal copy-number amplification is an oncogenic event. Although recent studies have revealed the complex structure1-3 and the evolutionary trajectories4 of oncogene amplicons, their origin remains poorly understood. Here we show that focal amplifications in breast cancer frequently derive from a mechanism-which we term translocation-bridge amplification-involving inter-chromosomal translocations that lead to dicentric chromosome bridge formation and breakage. In 780 breast cancer genomes, we observe that focal amplifications are frequently connected to each other by inter-chromosomal translocations at their boundaries. Subsequent analysis indicates the following model: the oncogene neighbourhood is translocated in G1 creating a dicentric chromosome, the dicentric chromosome is replicated, and as dicentric sister chromosomes segregate during mitosis, a chromosome bridge is formed and then broken, with fragments often being circularized in extrachromosomal DNAs. This model explains the amplifications of key oncogenes, including ERBB2 and CCND1. Recurrent amplification boundaries and rearrangement hotspots correlate with oestrogen receptor binding in breast cancer cells. Experimentally, oestrogen treatment induces DNA double-strand breaks in the oestrogen receptor target regions that are repaired by translocations, suggesting a role of oestrogen in generating the initial translocations. A pan-cancer analysis reveals tissue-specific biases in mechanisms initiating focal amplifications, with the breakage-fusion-bridge cycle prevalent in some and the translocation-bridge amplification in others, probably owing to the different timing of DNA break repair. Our results identify a common mode of oncogene amplification and propose oestrogen as its mechanistic origin in breast cancer.


Conflict of interest statement

D.P. is a member of the Volastra Therapeutics scientific advisory board.

Figures

Fig. 1
Fig. 1. Inter-chromosomal translocations frequently precede focal amplifications in breast cancer.
a, Copy-number profile and structural variations (SVs) in 780 breast cancers. The fraction of tumours containing amplified genomic regions with different copy-number thresholds (top) and frequencies of SVs connecting two genomic regions (bottom) are shown. CN, copy number b, Circos plots show the copy number and the SVs in three cases of breast cancer, which are positive for oestrogen receptor (ER) and progesterone receptor (PR) expression and overexpress HER2. c, The relationship between the amplified segments and the translocations in a representative breast cancer case harbouring the amplicons in chromosomes (chr.) 6 and 11. The number of supporting read fragments for the rearrangement is shown on the right y-axis. Brown lines and arcs indicate the SVs at the borders between the amplified and unamplified segments. Intra-chromosomal SVs are coloured on the basis of the orientation of their breakpoints.
Fig. 2
Fig. 2. Translocations lead to the amplification of breast cancer oncogenes via chromosome bridge formation.
a, SVs connecting the amplicon boundaries in 479 breast cancer cases with focal amplifications are overlaid in the centre (orange and purple arcs indicate intra- and inter-chromosomal SVs, respectively). The outermost track shows average copy numbers. b, Clinicopathologic and genomic features of 780 breast cancer cases and their associations with TB amplifications (Amp). Further details in Extended Data Fig. 2d. c, A representative case harbouring focal amplifications in CCND1 and ERBB2. The boundary SVs border the amplified and unamplified segments. We reconstructed the initial rearrangement event on the basis of the boundary SVs or the SVs at the border of the segments showing LOH. Further details in Extended Data Fig. 3. d, Another case with focal co-amplifications after complex translocations. e, A schematic illustration of the classical BFB cycle (chromatid type). f, The TB amplification model. LOH is frequently observed in both arms involved in the TB amplification (c,d). This dual-LOH pattern indicates that the initial translocation happened in the G1 phase (further details in Extended Data Fig. 5c). During mitosis, the replicated, two ‘flipped’ sister dicentric chromosomes form the chromosome bridge.
Fig. 3
Fig. 3. ERα-associated genomic fragility underlies TB amplifications in breast cancer.
a, Association between the amplification boundaries and the epigenetic features from the breast cancer cell lines using multivariate LASSO regression. The analysis is based on 100-kb genome-wide bins. Raw P values from a two-sided test are shown. DHS, DNase I hypersensitivity sites. b, Density distribution of ERα binding in control versus E2-treated experiments in the MCF7 cells. Genomic loci and related genes are annotated based on their values in the E2-treated experiment. c, The degree of overlap between the unamplified SV hotspots and E2–ERα binding. Statistical significance was based on a linear regression among the regions with SVs (r = 0.98 by Pearson’s correlation; two-sided test, P = 2.7 × 10−7). d, Schematic illustration of the experiments. FBS, fetal bovine serum. e, Hotspots of E2-induced translocations (n = 1,012 hotspots, more than fourfold increase following E2 treatment) between the induced breaks (the green arcs for those in SHANK2 intron 10 and the purple arcs for those in RARA intron 1) and the prey regions in the MCF7 cells. f, Multivariate LASSO regression model for the HTGTS translocation breakpoints. Raw P values from two-sided tests. g, The gene sets enriched in the E2-induced HTGTS breakpoint hotspots. q values provide the estimated false discovery rate (FDR).
Fig. 4
Fig. 4. Timing and transcriptional effect of TB amplification.
a, Top, a case with TB amplification showing both non-bridge arms amplified to the same copy-number level. Middle, SNVs were plotted based on their location and copy number. Their colour codes indicate the classification based on timing. Bottom, schematic of the evolution after the bridge breakage in this case. b, Timing of frequent copy-number gains in 780 breast cancers, based on the estimated tumour mutation burden (per diploid genome) at the timing of copy-number gains. Two-sided Wilcoxon test. Raw P values from top to bottom: 8.2 × 10−27, 4.9 × 10−14, 0.0026, 0.78, 6.6 × 10−6, 0.052, 1.3 × 10−11, 6.5 × 10−8, 0.00070, 1.1 × 10−5, 1.1 × 10−5, 0.050, 0.15, 0.053 and 0.0043. The comparisons with FDR <0.1 are annotated as black horizontal lines. White lines indicate non-significant comparisons. CNA, copy number alteration. c, A case with two rounds of TB amplification. The A (involving chromosomes 17, 8, and 4) and B (12, 20, and others) rounds of TB amplifications form two discrete clusters of complex genomic rearrangements without exchanging translocations to each other. d, The activity of ERα-medicated transcriptome from RNA sequencing. Box plots indicate median (middle line), first and third quartiles (edges) and 1.5× the interquartile range (whiskers). Statistical significance was assessed by linear regression. e, A schematic illustration of the consequence of ERα-associated fragility.
Fig. 5
Fig. 5. Patterns of focal amplifications between cancer types reflect their preferential mode of DNA break repair.
a, Classification of the SVs at the amplification boundaries and their associated mechanisms. b, The pattern of SVs at the amplification boundaries in different tumour types. The size of the circle indicates the number of amplified segments, as guided by the concentric circles and numbers below the plot. Tumour types are grouped by hierarchical clustering using the boundary SVs in all chromosomes. AC, adenocarcinoma; BNHL, B cell non-Hodgkin lymphoma; CNS, central nervous system; DM, double minutes; FBI, fold-back inversion; GBM, glioblastoma; HCC, hepatocellular carcinoma; medullo, medulloblastoma; RCC, renal cell carcinoma; SCC, squamous cell carcinoma; TCC, transitional cell cancer.
Extended Data Fig. 1
Extended Data Fig. 1. Clinicopathologic characteristics of 780 breast cancers and genomic features of structural variations at the amplification boundaries.
a. Patients’ sex, disease site, and primary diagnosis in pathology. b. Distribution of patients’ age at diagnosis. Number of patients in parenthesis. c. Estrogen receptor, progesterone receptor, and HER2 status by pathology, and gene expression (PAM50)-based subtype. IHC, immunohistochemical staining; ISH, in situ hybridization; PAM50, prediction analysis of microarray 50 (Methods). d. A stacked histogram of intra-chromosomal boundary SVs based on their size. A large fraction of them are large-sized (~10 Mbp) intra-chromosomal SVs with all four different types contributed equally. A peak around the size of ~1 Kbp comprises fold-back inversions, the genomic signature of chromatid-type breakage-fusion-bridge cycles. e. SVs at the boundaries of amplified segments are supported by a significantly larger number of reads than those not at the boundaries. Comparisons were by a two-sided, two-sample t test. Box plots indicate the median (thick line), the first and third quartiles (edges), and 1.5x of the interquartile range (whiskers). f. Length of microhomology sequences at the breakpoint of the SVs. Statistical comparisons were made by two-sided Wilcoxon’s test. Mutational features around the SV breakpoints are further discussed in Supplementary Note. g. A density histogram of SVs in relation to their replication timing zone. h. Genomic annotation of the boundary SV breakpoints.
Extended Data Fig. 2
Extended Data Fig. 2. Genomic alterations in 780 breast cancers and their relationship with translocation-bridge amplification.
a. Landscape of boundary SVs by the ER and homologous recombination (HR) status. Frequently amplified genes and common aneuploidies are annotated. b. Amplified genomic segments in ERBB2-amplified tumors by the ER status (left panel). ERBB2 and two oncogenes in 17q23 are annotated. Co-amplification of the 17q23 region (harboring PPM1D, MIR21, USP32, etc.) was numerically more frequent in the HER2+/ER+ group compared to the HER2+/ER but without statistical significance (37% vs 18%; odds ratio = 2.63; 95% CI = 0.98−7.71 by two-sided Fisher’s exact test). Amplified genomic regions in CCND1-amplified tumors by the ER status (right panel). CCND1, PAK1, and RSF1 are shown as shaded areas. CCND1 amplification was more common in the ER+ group compared to the ER− (21% vs 6%; odds ratio=3.85; 95% CI=2.22−7.05 by two-sided Fisher’s exact test). c. Representative cases of ERBB2 amplification in ER/HR-proficient breast cancers (ER/HER2+). The pattern of copy-number amplification with frequent translocations at their boundaries is similar to what was observed in the ER+/HER2+ cases. d. Whole-genome alteration landscape of 780 breast cancer cases shows the relationship between the translocation-bridge amplifications and driver genetic alterations. IHC, immunohistochemical stain; ISH, in situ hybridization; HR, homologous recombination; TSG, tumor suppressor gene; MAPK, mitogen-activated protein kinase; PI3K, phosphatidylinositol-3-kinase; TF, transcription factor.
Extended Data Fig. 3
Extended Data Fig. 3. Reconstruction of translocation-bridge amplification.
Copy number and SV information from TCGA-A8-A08S case, harboring 11q and 17q focal amplifications connected by translocations at their boundaries (TB amplification). Five informative SVs are highlighted on the SV plot and their detailed structures are visualized by the Integrative Genomics Viewer.
Extended Data Fig. 4
Extended Data Fig. 4. Genomic evidence supporting the translocation-bridge amplification model.
a. Evidence of chromosome bridge formation and breakage in three cases with TB amplifications. Complex genomic rearrangements were clustered based on the proximity of SV breakpoints (Methods). Bridge arms typically show massive amplification with heavy rearrangements and adjacent segments with LOH. In contrast, non-bridge arms are relatively spared from rearrangements and often amplified moderately. b. The fraction of SVs on the bridge arms (left panel) and non-bridge arms (right panel) among the complex genomic rearrangement clusters showing TB amplifications. Most clusters have their SVs concentrated on the bridge arms, whereas their non-bridge arms are often spared from the SVs. c. The density of SVs on the bridge and the non-bridge arms, including all SVs (left panel) and among the non-amplified SVs (right panel). The bridge arms showed a higher density of SVs compared to the non-bridge arms (median 1.74 vs. 0.33 SVs/Mbp; p = 2.7 × 10⁻²⁷; by two-sided, two-sample t test), and this trend was still significant after excluding all the SVs in the amplified regions (median 0.75 vs. 0.26 SVs/Mbp; p = 1.3 × 10⁻¹³). Violin plots in c and d show the distribution of SV density, the box plot in the center of the violin indicates median (white dot), first and third quartiles (edges), and 1.5× of interquartile range (vertical line). d. The fraction of genomic segments affected by LOH on the bridge arms and non-bridge arms. The bridge arms showed a more extensive LOH compared to the non-bridge arms (median 49% vs 25% of the arm; p = 3.7 × 10⁻¹⁵; by two-sided, two-sample t test). e. An exemplary case of multi-chromosomal chromothripsis (yellow cluster). The SVs are distributed more-or-less evenly in the involved chromosomes without sparing one arm. f. Chromosomes showing typical features of chromothripsis. The SVs are distributed evenly on two chromosome arms, and the rearrangements are more-or-less random, in contrast to the asymmetric footprint of TB amplification.
Extended Data Fig. 5
Extended Data Fig. 5. Evidence of inter-chromosomal translocation in G1 before the DNA replication.
a. ‘Dual-LOH’ pattern of the bridge arms in the tumors with TB amplification. Both bridge arms in each case show substantial loss of heterozygosity (LOH). Notably, the bridge arm segments proximal to the TB amplification (the inter-centromeric segment on the bridge) often show complex copy-number pattern with segmental loss (first panel; in BR014) or gain (second panel; in TCGA-EW-A1J5) by one copy. This is likely due to the unequal breakpoints between the sister dicentrics. Depending on the location of the break, some segments can be duplicated (exhibiting one-copy gain) or lost (one-copy loss) in a daughter cell after the bridge resolution. b. Copy number outcome after the translocation forming a single dicentric chromosome, chromosome bridge, and its resolution. The two daughter cells will inherit one broken arm after the bridge breakage, leading to their ‘single-LOH’ copy-number pattern. c. Three different scenarios of mitotic spindle attachments in the setting of replicated dicentric sisters (initial translocation in G1). If the microtubules are attached in cis, normal mitosis will be secured (upper panel). If in trans, chromosome bridge will be formed by two ‘flipped’ dicentrics in anti-parallel orientation and the resultant copy number profile matches with the dual-LOH pattern frequently observed in breast cancer cases with TB amplifications (middle panel). If the microtubules from one pole are attached to the same centromeres (syntelic attachment), each daughter cell will have LOH affecting one arm of a chromosome and whole length of another chromosome (lower panel). d. Four different copy number outcomes depending on the timing and orientation of the translocation. We expect post-replication inter-chromosomal translocation to be less frequent due to the active homologous recombination in the S/G2 cells. e. Copy-number difference between the two non-bridge arms in the 58 TB amplification events where the two non-bridge arms are globally amplified more than three copies. 36 (62%) out of 58 events showed a copy number difference of less than 2. f. A case indicating possible repair by mutual ligation between the non-bridge arms (8q and 16p) after TB amplification. The two non-bridge arms (8q and 16p) are connected to each other by multiple translocations at the copy-number boundaries. A whole-genome duplication took place after the translocations between non-bridge arms and led to the coordinated copy-number gain.
Extended Data Fig. 6
Extended Data Fig. 6. Associations between the epigenomic features and the amplification boundaries.
a. Replication timing and amplification boundaries. Violin plots show the replication timing weighted average values in 100-Kbp bins. The box plot in the center of the violin indicates median (black dot), first and third quartiles (edges), and 1.5× of interquartile range (horizontal line). Comparisons were made by one-sided Wilcoxon’s rank sum test. b. Fraction of 100-Kbp bins overlapping with various epigenomic features in the background and in the recurrent hotspots of amplification boundaries (recurrence >9). The background represents the bins that do not contain amplification boundaries. All epigenomic features were from MCF7 cells, except for TOP2B (from MCF10A cells). DHS, DNase I hypersensitivity sites. c. Pearson’s correlation coefficients between the ERα binding in MCF7 cells and in tissues, including multiple breast cancer samples and normal luminal breast epithelial cells from a previous study (Supplementary Table 3). The analysis is based on 1 Mbp-sized genome-wide bins. d. Assessment of multicollinearity between the epigenomic features by variant inflation factor (VIF; Methods). Some variables showed moderate degree of multicollinearity (VIF 3−5) although others including E2-ERα showed low degree of multicollinearity (VIF < 3). Given these reassuring features, we performed multivariate linear mixed-effect model (panel e), as an adjunct analysis. e. Predictors of amplification boundaries in the multivariate linear mixed-effect model, by the ER status. 100 Kbp-sized genome-wide bins were used in this analysis. Raw p-values from two-sided test are shown. f. A greater cumulative E2-ERα binding is observed in the 100-Kbp bins with more frequent overlaps with the focal amplification boundaries. E2-ERα ChIP-seq data from MCF7 cell line was used in this analysis. Box plots indicate median (thick line), first and third quartiles (edges), and 1.5× of interquartile range (whiskers). Statistical significance was determined by the one-sided rank sum test. g. Binding intensity (fold enrichment) of E2-treated ERα, CTCF, FOXA1, and GATA3 in MCF7 cells based on the 1 Mbp-sized genomic bins with different levels of overlap with the focal amplification boundaries (upper panel). The numbers of genomic bins used in each category are as follows: n = 25663 (recurrence = 0), 4334 (1−3), 118 (4−6), and 39 (≥7). Box plots indicate median (thick line), first and third quartiles (edges), and 1.5x of interquartile range (whiskers). A statistically significant increase in the binding intensity of E2-treated ERα was observed with increasing recurrence of amplification boundaries (p = 2.8 × 10⁻⁶, one-sided Wilcoxon’s rank sum test). Genomic distances from the bins containing the amplification boundaries to the strong binding peaks (top 10%) of E2-ERα, CTCF, FOXA1, and GATA3 in MCF7 cells (lower panel). Black dots indicate median, and the vertical lines indicate the range between first and third quartiles. h. Enrichment of different classes of variants with respect to the expected values under the assumption of uniform distribution in 100-Kbp genomic bins within 5-Mbp window for each E2-induced ERα peak locus. Statistical significance was assessed by one-sided Fisher’s exact test. i. Relative density of amplification boundaries, SVs, and indels by their subgroups around the E2-ERα peaks (±50-Kbp window from the center of the peak). Here, the amplification boundary hotspots were defined as 100-Kbp bins supported by >4 tumors. Number of variants used in the analysis was marked on the right. HRP, HR-proficient tumors; HRD, HR-deficient tumors. j. Subgroup analyses of the relationship between the SV hotspots of the unamplified regions and the frequency of E2-ERα binding peaks in the regions (related to Fig. 3c). A positive correlation between the E2-ERα peaks and the unamplified SV hotspots is observed among the HR-proficient tumors. In contrast, the trend is not found in HR-deficient tumors.
Extended Data Fig. 7
Extended Data Fig. 7. Estradiol induces transcription of its target genes and increases HTGTS translocations.
a. Design of the HTGTS experiment. Using CRISPR/Cas9 system, we induced the DNA double strand breaks (DSBs) in the intronic regions near the prominent E2-ERα binding peaks (intron 10 of SHANK2 and intron 1 of RARA). These sites are also located at the downstream neighborhood of the oncogenes of interest (ERBB2 and CCND1). We designed the library to amplify the translocated sequences to the centromeric end of the CRISPR breaks, which is in the orientation potentially forming a dicentric chromosome. b. An increased mRNA expression of canonical target genes of ERα by the E2 treatment. All three genes showed robust upregulation of their expression in both MCF7 and T47D cells. n = 5 biologically independent experiments were performed for TFF1 and PGR, and n = 3 for GREB1 in two different cell lines. Box plots in b and c indicate median (thick line), first and third quartiles (edges), and 1.5x of interquartile range (whiskers). In both, statistical comparisons were made by two-sided, two-sample t test. c. An increased number of unique HTGTS translocation breakpoints by the E2 treatment in all four experimental pairs. n = 3 biologically independent experiments were performed in each group. d. Genomic annotation of the HTGTS translocation breakpoints in the control and E2-treated experiments. e. A circos plot visualizing the hotspots E2-induced translocations (> 4-fold change by the E2 treatment) between the induced breaks and the prey regions in the T47D cells.
Extended Data Fig. 8
Extended Data Fig. 8. Association of E2-induced HTGTS translocations and the driver events in breast cancer genomes.
a. Association between the E2-induced HTGTS translocations and ERBB2 amplicons. The 10-Mbp genomic region around ERBB2 (orange shadow) was visualized. Frequency of amplification boundary per bin (uppermost panel), amplified segments in each tumor, ordered by the location of telomeric boundary and the ER status (mid-upper panel), ERα ChIP-seq profile in MCF7 cells (mid-lower panel), and the HTGTS translocation breakpoints from the experiments using sgSHANK2 (lowermost panel). Extensive E2-ERα binding was observed in several hotspots in the neighborhood of CDC6, RARA, IGFBP4, and CCR7 (purple shadow), and this region overlaps with the telomeric border of the ERBB2 amplicon. E2 treatment increased the frequency of translocations >3 fold (from 22 to 69; odds ratio: 1.87 compared to the background; p = 0.009 by Fisher’s exact test, two-sided) in the purple shadow region (chr17:38,450,000-38,750,000). E2-induced HTGTS translocation hotspots, prominent E2-ERα binding peaks, and the telomeric boundary of the ERBB2 amplicons well overlapped each other, suggesting E2-induced, ERα-mediated fragility as the mechanism of initial translocation that led to the TB amplification. Local DNA fragmentation and segmental loss after the chromosome bridge breakage could explain the tumors with more proximal boundaries. b. A similar example of CCND1 (orange shadow) amplification and its neighborhood. The HTGTS translocation breakpoints were from the experiments using sgRARA. E2 treatment also increased the frequency of translocations from 14 to 40 in the region around SHANK2 (chr11:70,300,000-71,000,000; purple shadow), but this was not significantly larger than the background increase (odds ratio: 1.70; p = 0.09 by two-sided Fisher’s exact test). Further discussions in Supplementary Fig. 7. c. An example of unamplified SV hotspot in GATA3, which overlaps with the E2-induced HTGTS translocation hotspot. d. Another example of unamplified SV hotspot in FOXA1.
Extended Data Fig. 9
Extended Data Fig. 9. Timing, complexity, and transcriptional impact of translocation-bridge amplification.
a. A TB amplification case from PD14450 showing an amplified non-bridge arm, 1q. The paucity of the SNVs amplified up to the allelic copy-number of 1q indicates that the TB amplification and the subsequent 1q amplification are early events. b. Relationship between the age of diagnosis and the burden of clonal single-nucleotide variations (SNVs) in non-hypermutated, diploid, and HR-proficient breast cancers (Methods). The dashed line is based on linear regression (r = 0.29 by Pearson’s correlation; two-sided p = 0.0004), indicating our cohort’s approximate baseline clonal mutation rate of 29.4/years. A similar analysis using all SNVs in the same group of patients showed a mutation rate of 33.1/years (r = 0.26 by Pearson’s correlation; two-sided p = 0.002; corresponding to a median of 45.3 years for the latest possible timing of bridge breakage). c. Cases suggesting multiple rounds of dicentric chromosome bridge formation and breakage. Translocation bundles are spatially separated on chromosomes. In PD4962 tumor (upper panel), two bundles of translocations were observed — t(17q;20q) and t(17q;22q). However, there is no direct translocation between chromosome 22q and 20q, indicating the two translocation bundles were formed at different time points. In the same way, TCGA-E2-A15H tumor (lower panel) shows t(8p;17q) and t(9p;17q), but no direct connection was observed between 8p and 9p. d. Cases indicating one round of multi-chromosomal TB amplifications, likely involving multiple dicentric chromosomes or a more complex structure, broken and ligated at one event. In contrast to (c), these cases show dense bundles of translocations between all pairs of chromosomes involved in the event. Individual chromosome arms have translocations connected to all other involved chromosome arms, indicating that these arms were in the bridge simultaneously, and the broken DNA fragments were ligated in a mixed manner. In PD9193 tumor (upper panel), chromosomes 1q, 17q, and 7q were rearranged first and underwent massive rearrangements. The LOH selectively affecting one of the two arms of each chromosome is consistent with typical TB amplification. After the catastrophic breaks, the DNA fragments were ligated to form an amplicon containing multiple oncogenes. In TCGA-A2-A04X tumor (lower panel), the initial event might be a chromoplexy involving chromosomes 1, 7, 8, 11, 17. Four telomeric LOH segments were observed in the involved chromosomes, so two dicentric chromosomes would likely have existed and were fragmented simultaneously. e. Associations between the extent of TB amplifications and the expression of estrogen-responsive genes. Numbers of the ER+ tumors used in the right panel are as follows: n = 141 (0 chromosome arm pairs indicating a TB amplification event), 20 (1), 15 (2), 8 (3), and 4 (4). Box plots indicate median (thick line), first and third quartiles (edges), and 1.5× of interquartile range (whiskers). Statistical tests by linear regression, and the gray dashed line is the regression line. Nine out of 273 genes showed statistically significant trend (FDR <0.1 after correcting multiple testing). Among these genes, CDC6 and TOP2A showed significant upregulation among the tumors with extensive TB amplification likely due to their presence in the amplicon. We excluded these two genes from this plot.
Extended Data Fig. 10
Extended Data Fig. 10. Diverse mechanisms of focal amplification in pan-cancer.
a. Common target genes of focal amplification in the PCAWG cohort. Colors in the stacked bar plot indicates the tumor type. b. Representative cases of focal amplifications from diverse mechanisms in different tumor types. DMs, double minutes; BFB, breakage-fusion-bridge c. Two different modes of simple ecDNA formation in glioblastoma samples. Two glioblastoma cases showed an ecDNA formation from cut-out piece of DNA fragment containing EGFR (left panel). In these cases, a large deletion totally encompassing the cut-out fragments were observed. These cases demonstrate episomal exclusion mechanism in generating ecDNA. In contrast, many cases showed an ecDNA formation from an extra copy of short DNA patch harboring the EGFR (right panel), likely explained by over-replication and recombination. d. A meta-analysis excluding cancers of female or male organs showed a marginal trend of more translocations at the amplicon boundaries in female patients. e. TB amplification was associated with low ESR1 mRNA expression in endometrial and liver cancers, although not reaching to our level of statistical significance after correcting multiple testing (FDR <0.1 with two-sided, two-sample t test). In these two tumor types, the tumors with TB amplification were rare (6/41 for endometrial and 11/300 for liver) and showed a lower ESR1 expression compared to those without TB amplification (7.1 vs. 22.8; p = 0.02 for endometrial, 0.37 vs. 0.82; p = 0.02 for liver, by two-sided, two-sample t test; FDR = 0.20 for both). Box plots in e and f indicate median (solid vertical line in the middle), first and third quartiles (edges), and 1.5x of interquartile range (whiskers). f. TB amplification status was associated with old ages in uterine cancer (76 vs. 67 years; p = 0.03 by two-sided, two-sample t test). However, the number of tumors with TB amplification was small (n = 6), and the statistical comparison was insignificant after correcting multiple testing (FDR = 0.69). No age difference was noted in other cancer types depending on the TB amplification status. g. We performed survival analysis by tumor type when there are 50 or more patients with available survival information. Survival information of the four tumor types with 10 or more cases with TB amplification are plotted. Statistical test was made by two-sided log-rank test, and none of the four tumor types showed significantly different overall survival depending on the TB amplification status. h. A representative case of TMPRSS2-ERG fusion from complex genomic rearrangements suggesting bridge breakage. In this case, 16q and 21q would have been translocated to each other, forming a dicentric chromosome. Bridge formation and resolution left a typical footprint of dual LOH on both bridge arms without causing focal amplification.

References

    1. ICGC/TCGA Pan-Cancer Analysis of Whole Genomes Consortium. Pan-cancer analysis of whole genomes. Nature. 2020;578:82–93. doi: 10.1038/s41586-020-1969-6. - DOI - PMC - PubMed
    1. Campbell PJ, et al. The patterns and dynamics of genomic instability in metastatic pancreatic cancer. Nature. 2010;467:1109–1113. doi: 10.1038/nature09460. - DOI - PMC - PubMed
    1. Stephens PJ, et al. Massive genomic rearrangement acquired in a single catastrophic event during cancer development. Cell. 2011;144:27–40. doi: 10.1016/j.cell.2010.11.055. - DOI - PMC - PubMed
    1. Shoshani O, et al. Chromothripsis drives the evolution of gene amplification in cancer. Nature. 2021;591:137–141. doi: 10.1038/s41586-020-03064-z. - DOI - PMC - PubMed
    1. Hicks GR, et al. Novel patterns of genome rearrangement and their association with survival in breast cancer. Genome Res. 2006;16:1465–1479. doi: 10.1101/gr.5460106. - DOI - PMC - PubMed

Publication types