. 2023 May;617(7962):818-826.
doi: 10.1038/s41586-023-06061-0. Epub 2023 May 17.

Lysine catabolism reprograms tumour immunity through histone crotonylation

Affiliations

Lysine catabolism reprograms tumour immunity through histone crotonylation

Huairui Yuan et al. Nature. 2023 May.

Abstract

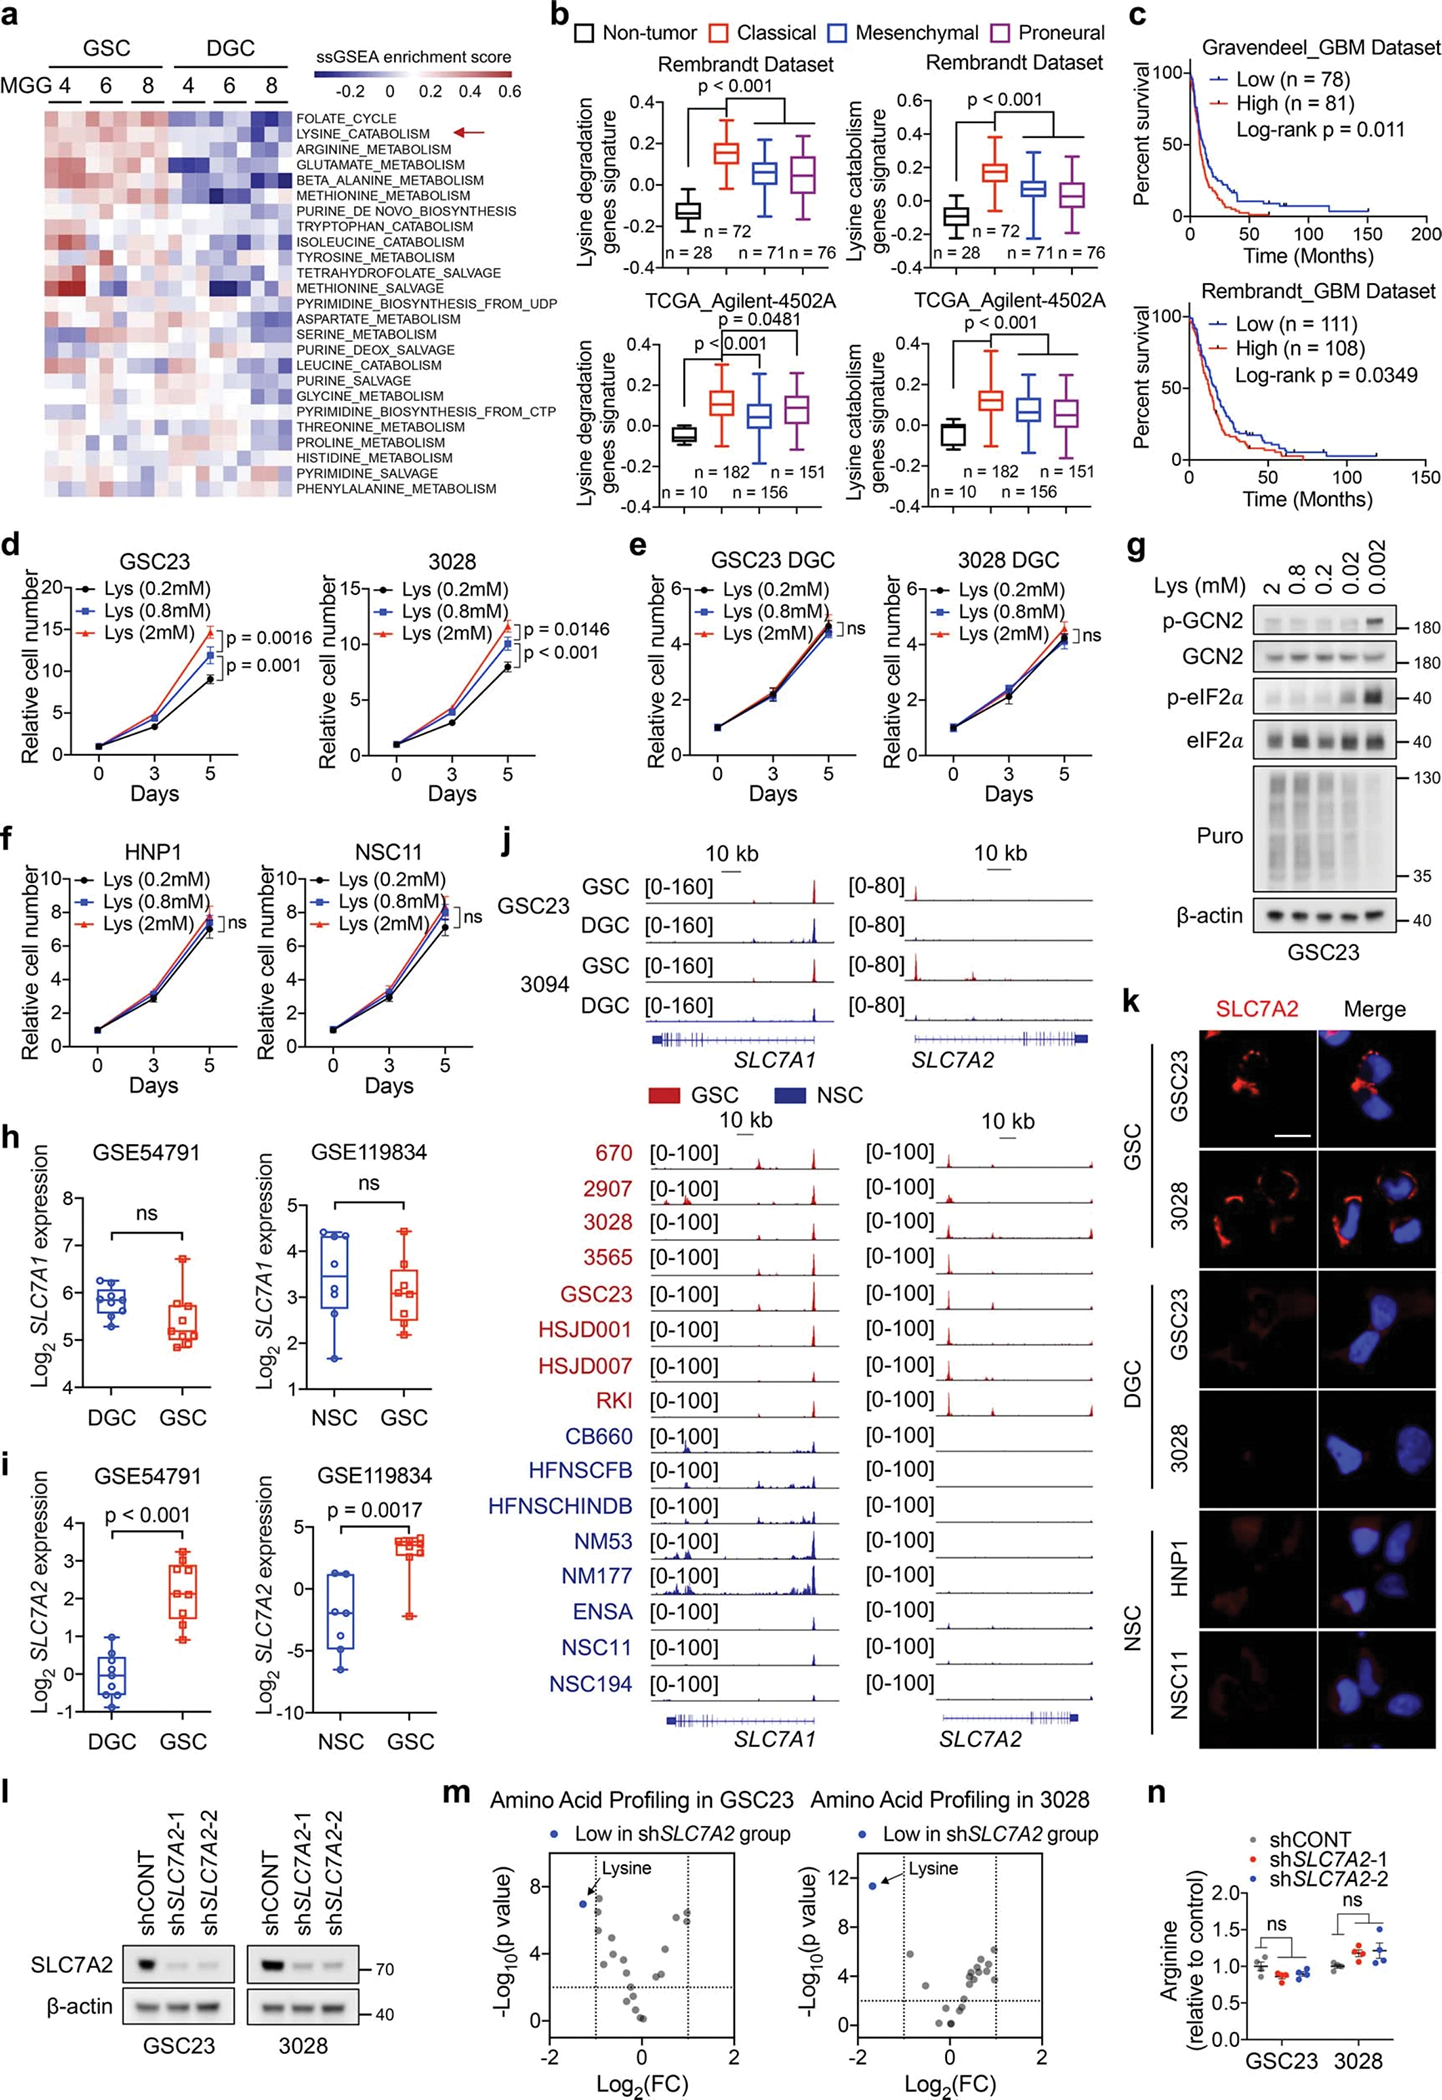
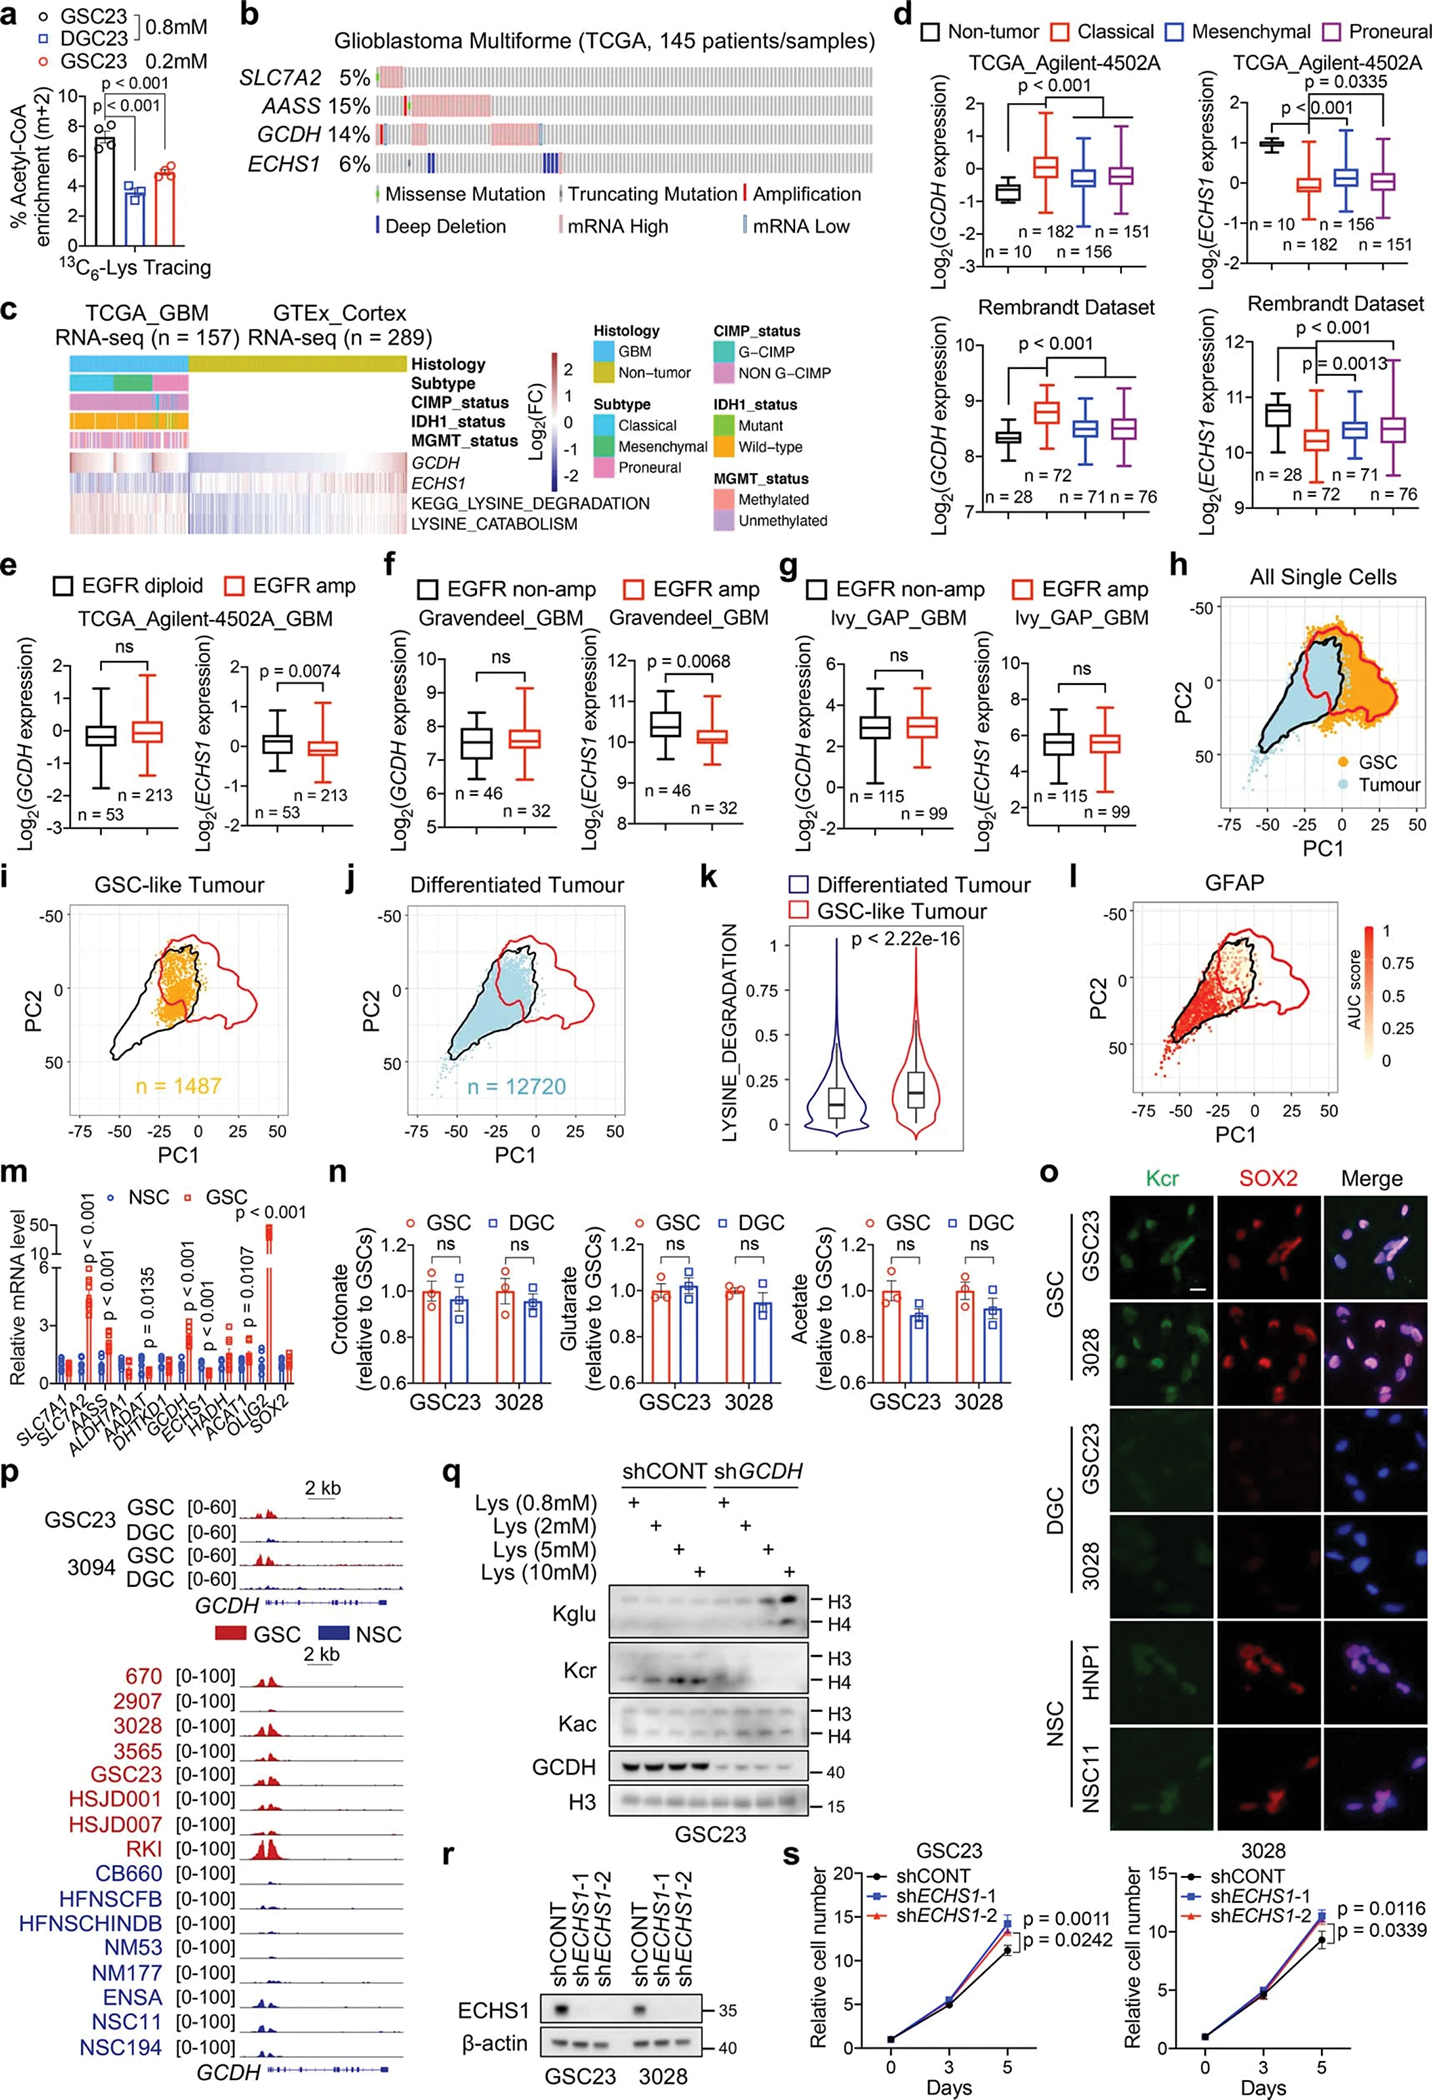
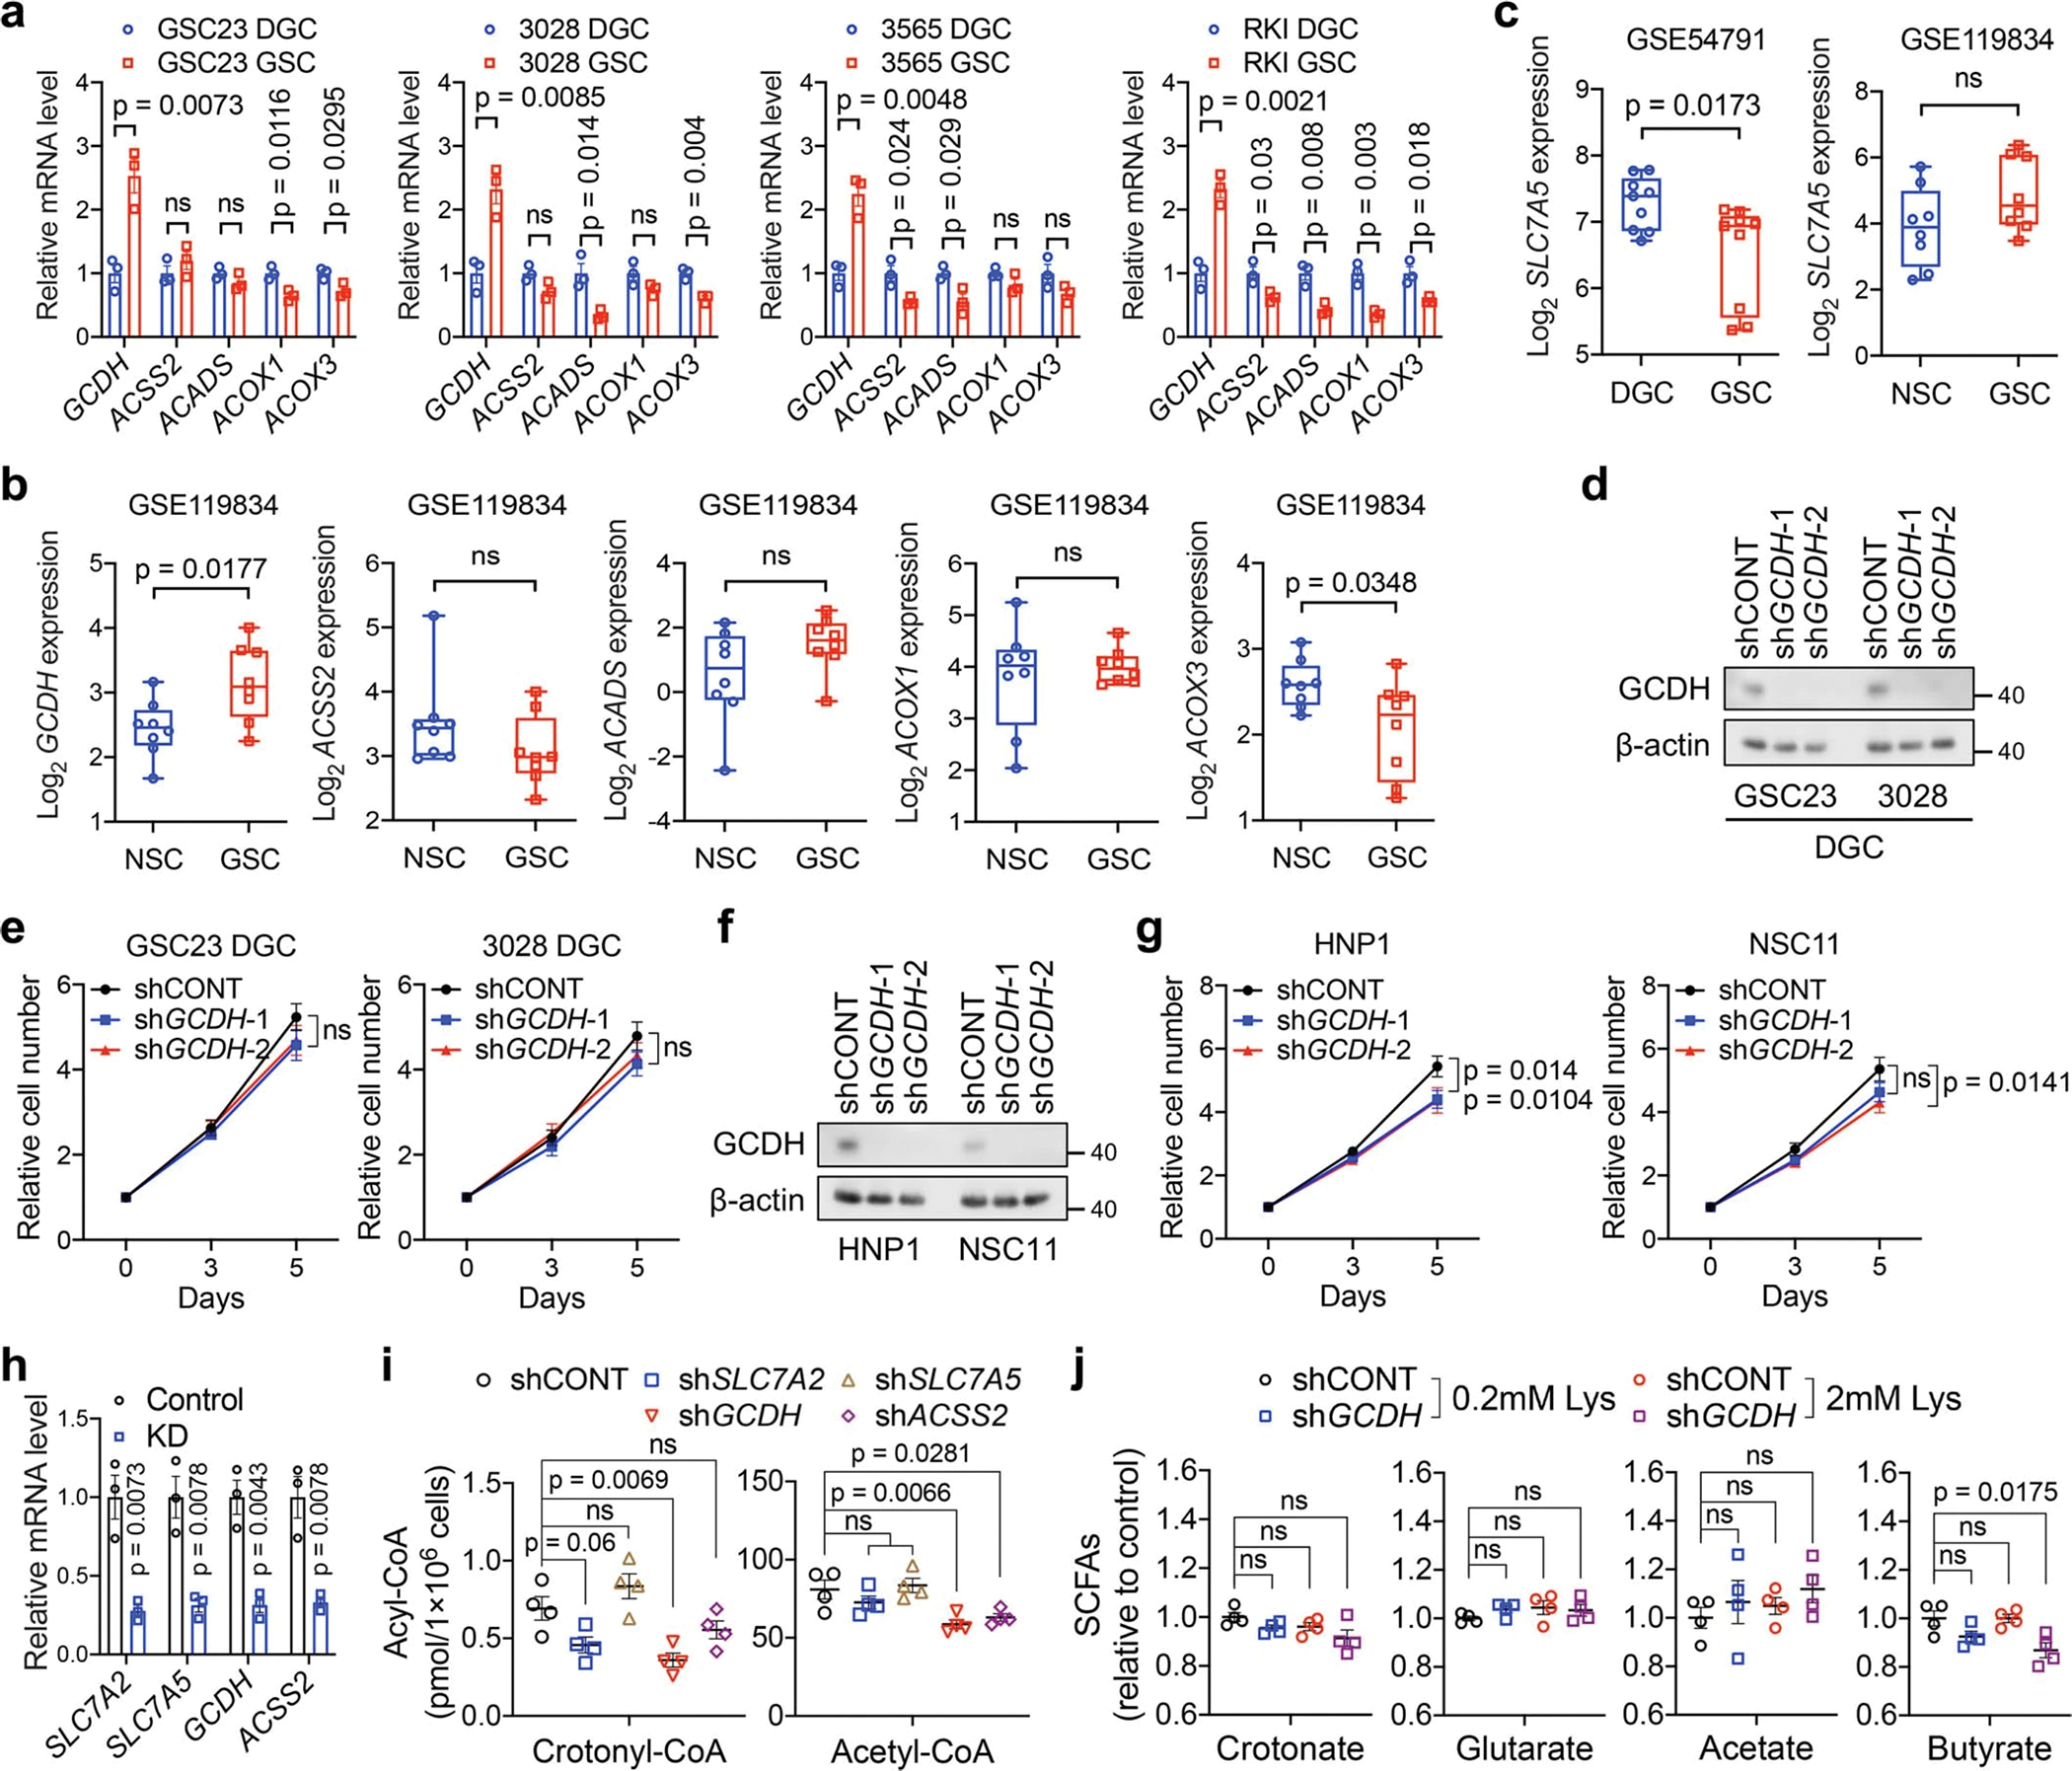
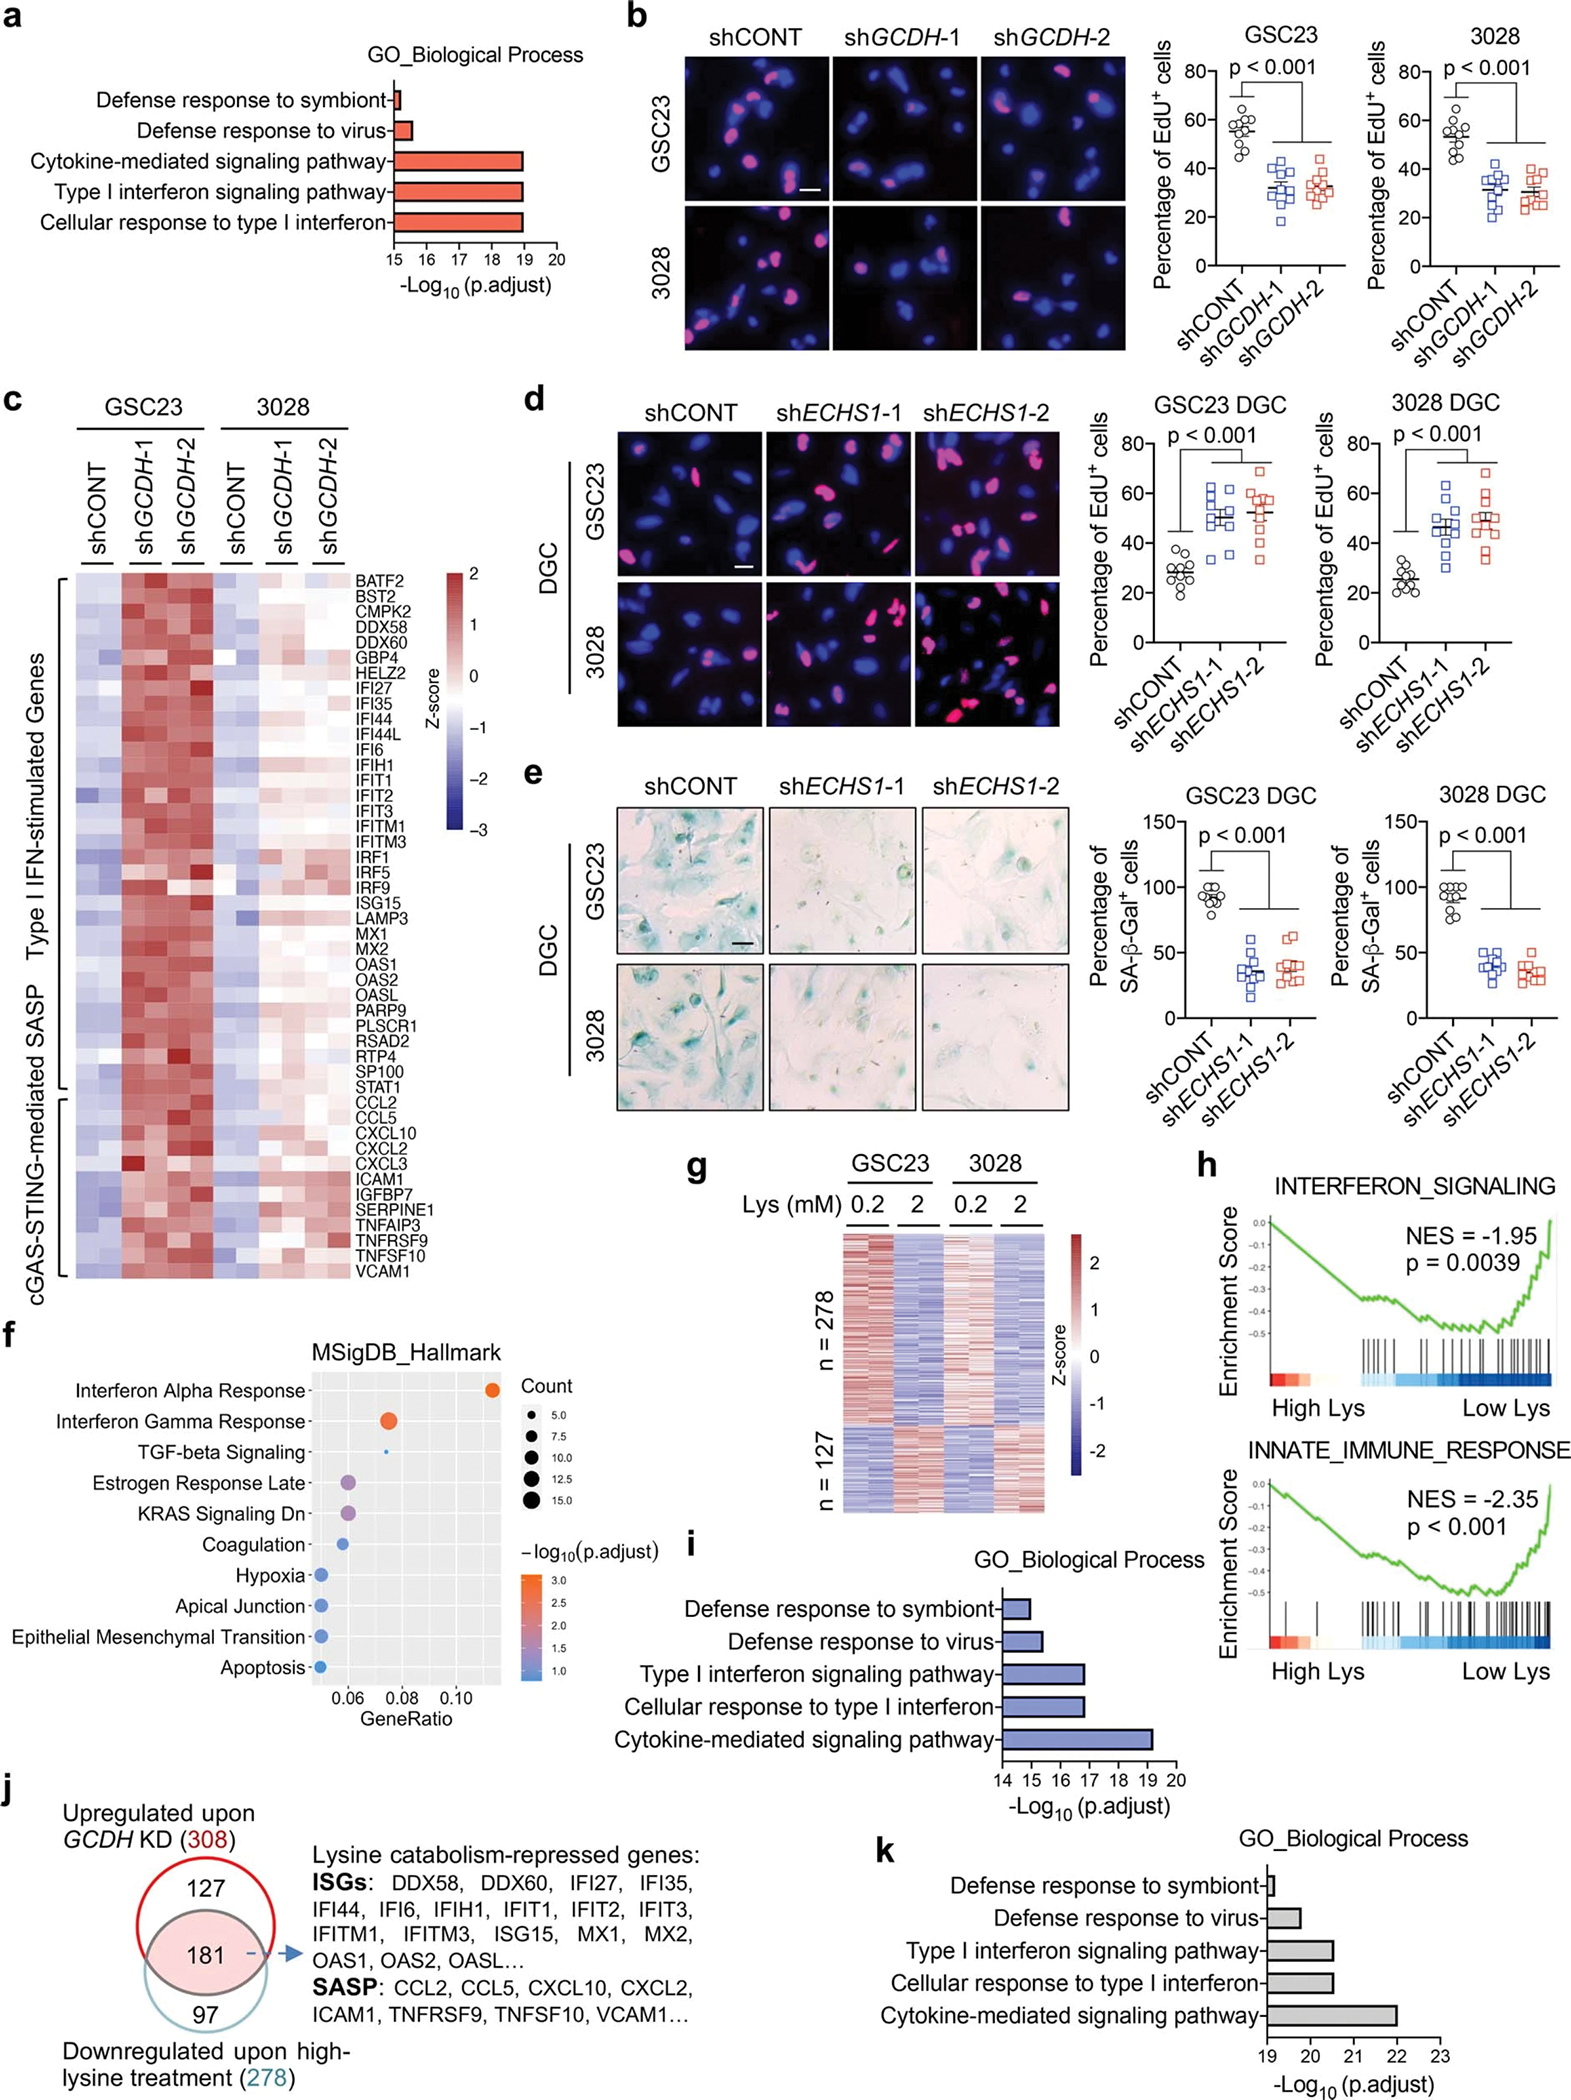
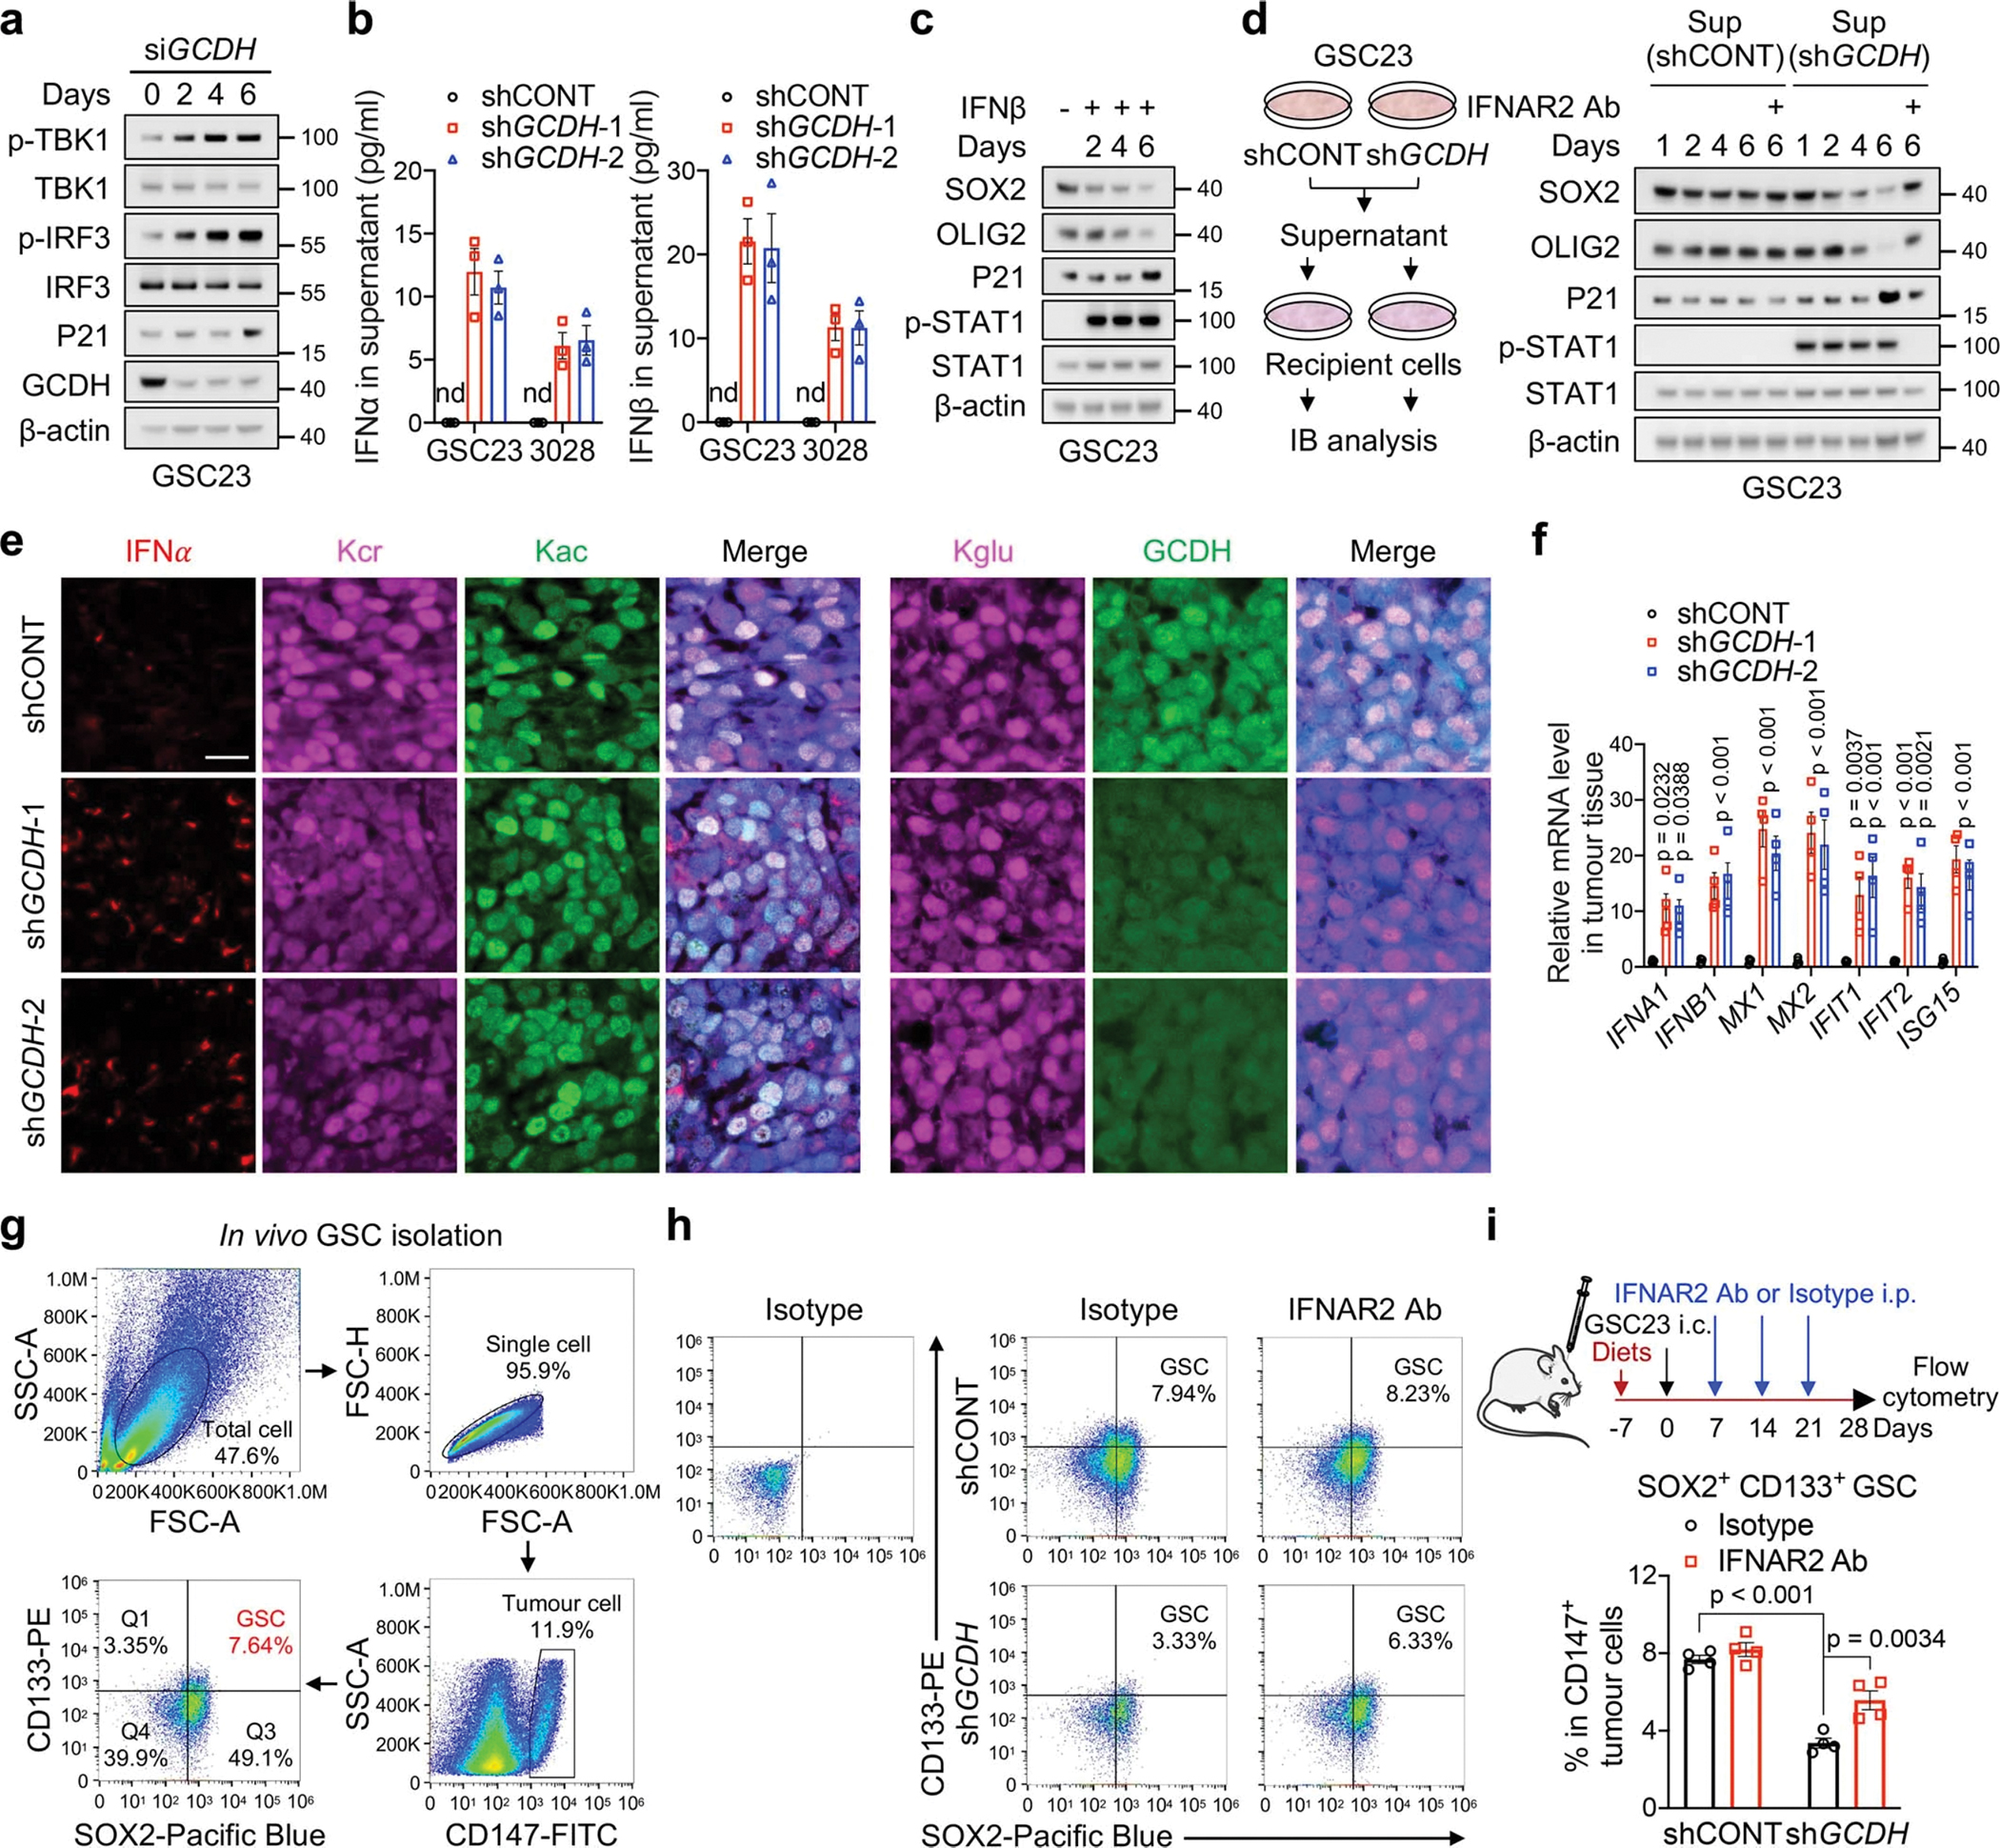
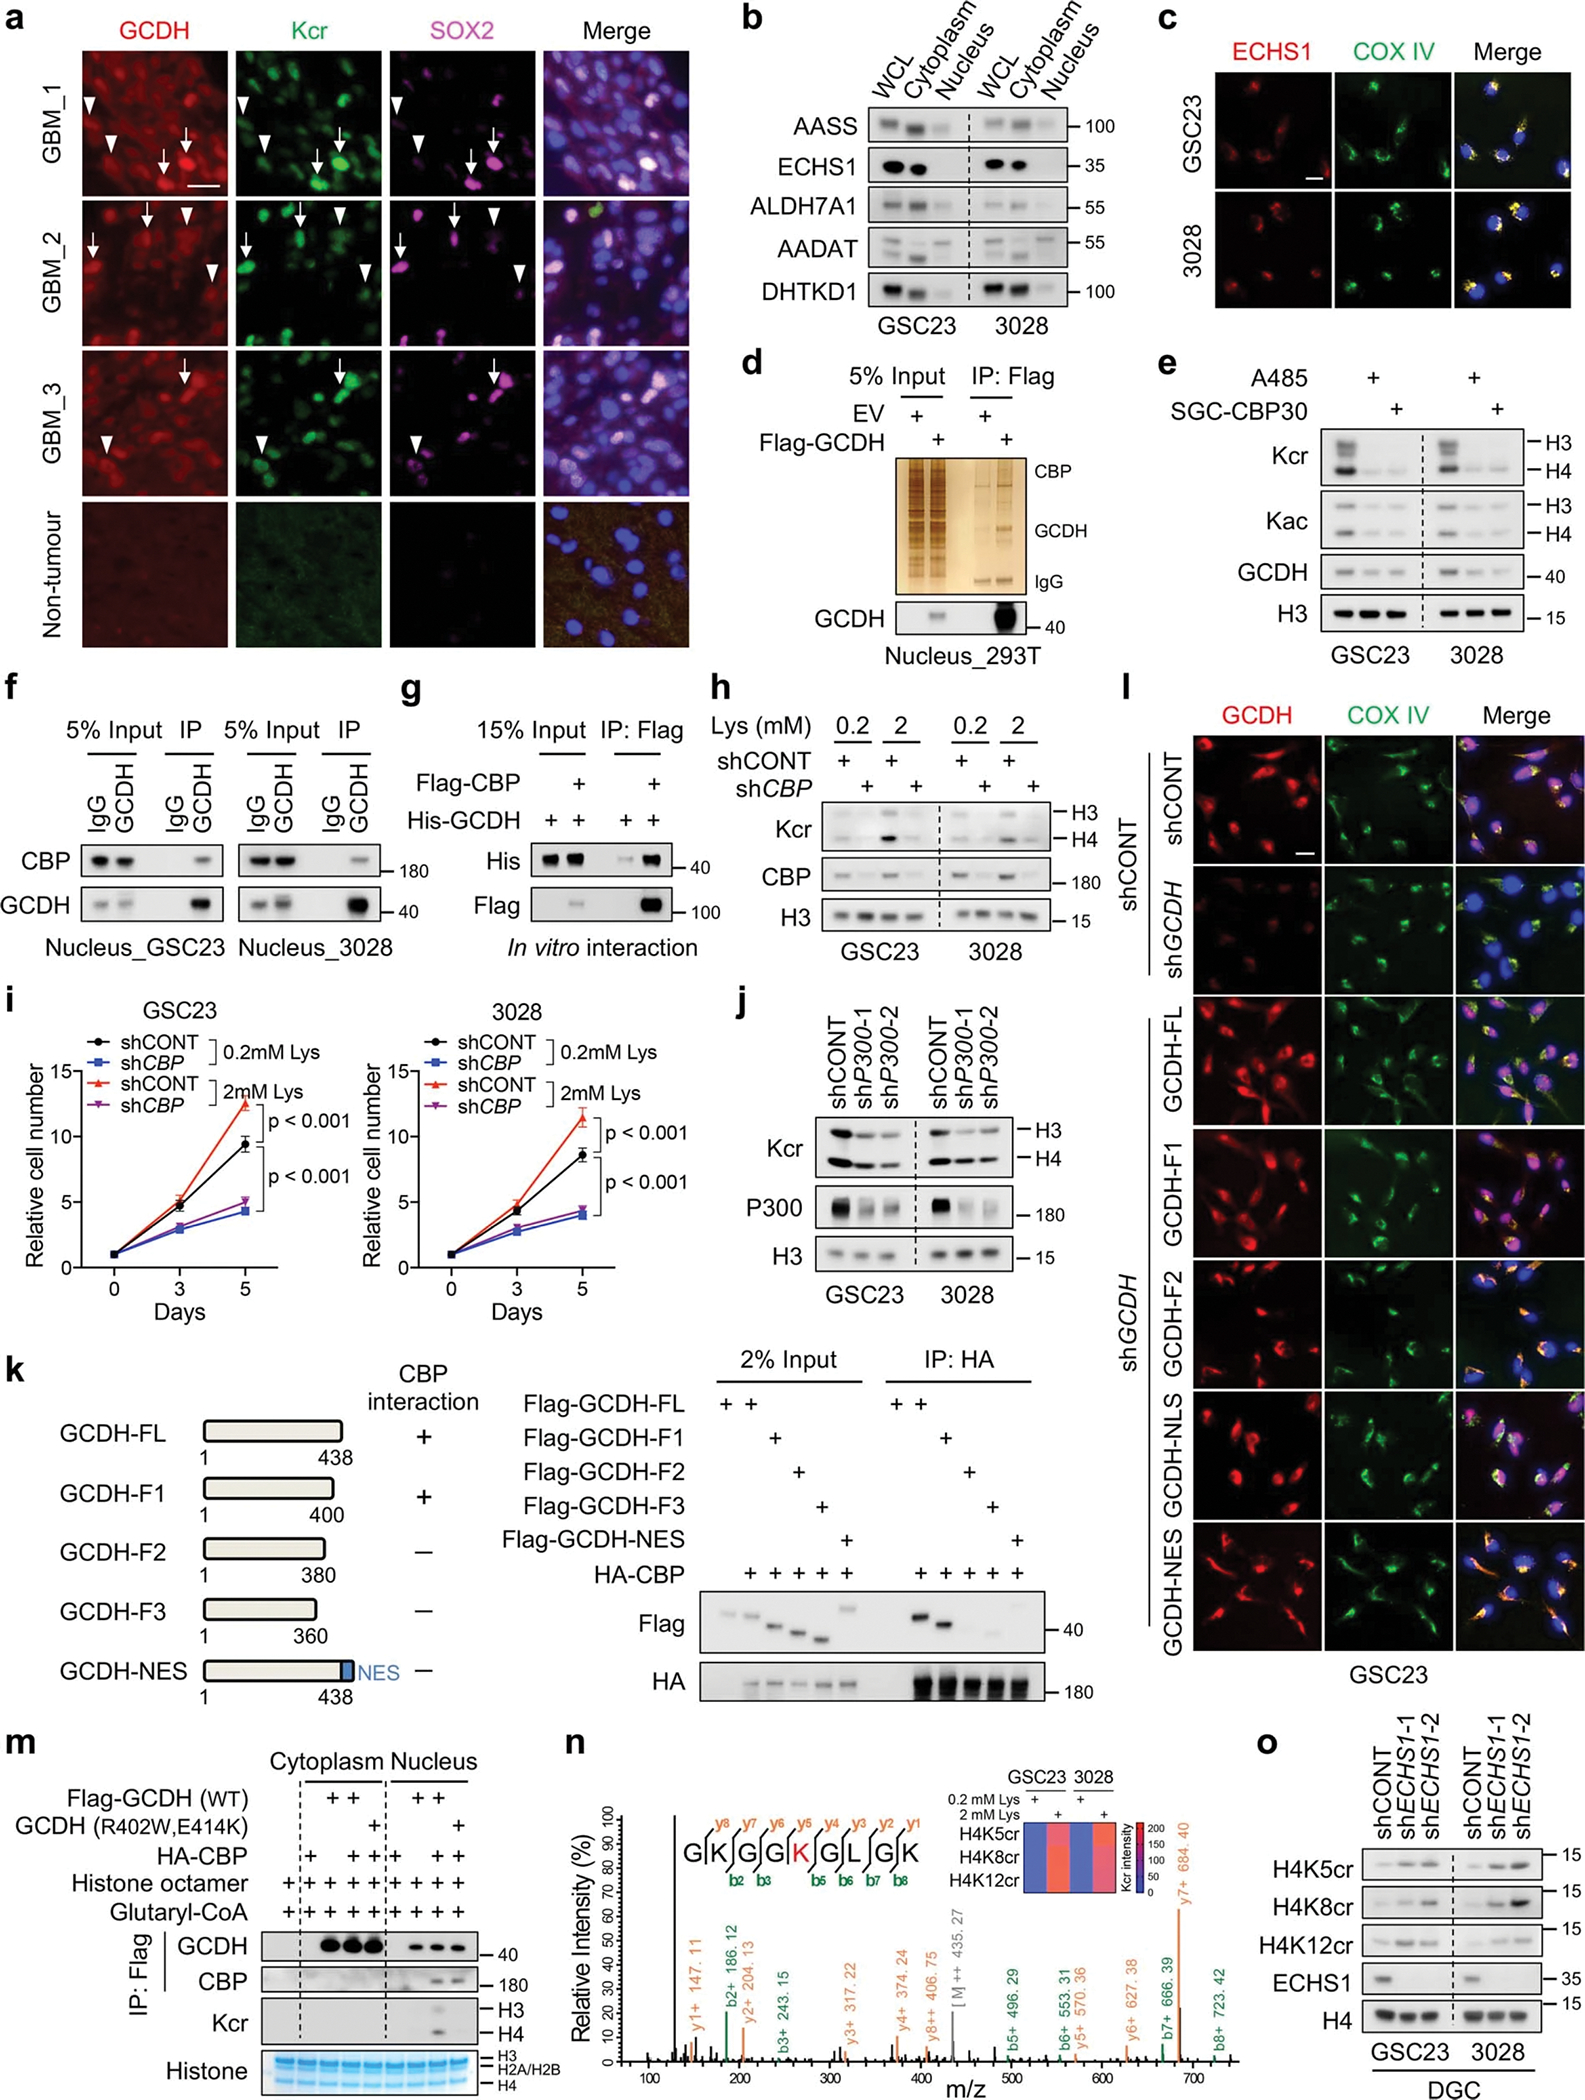
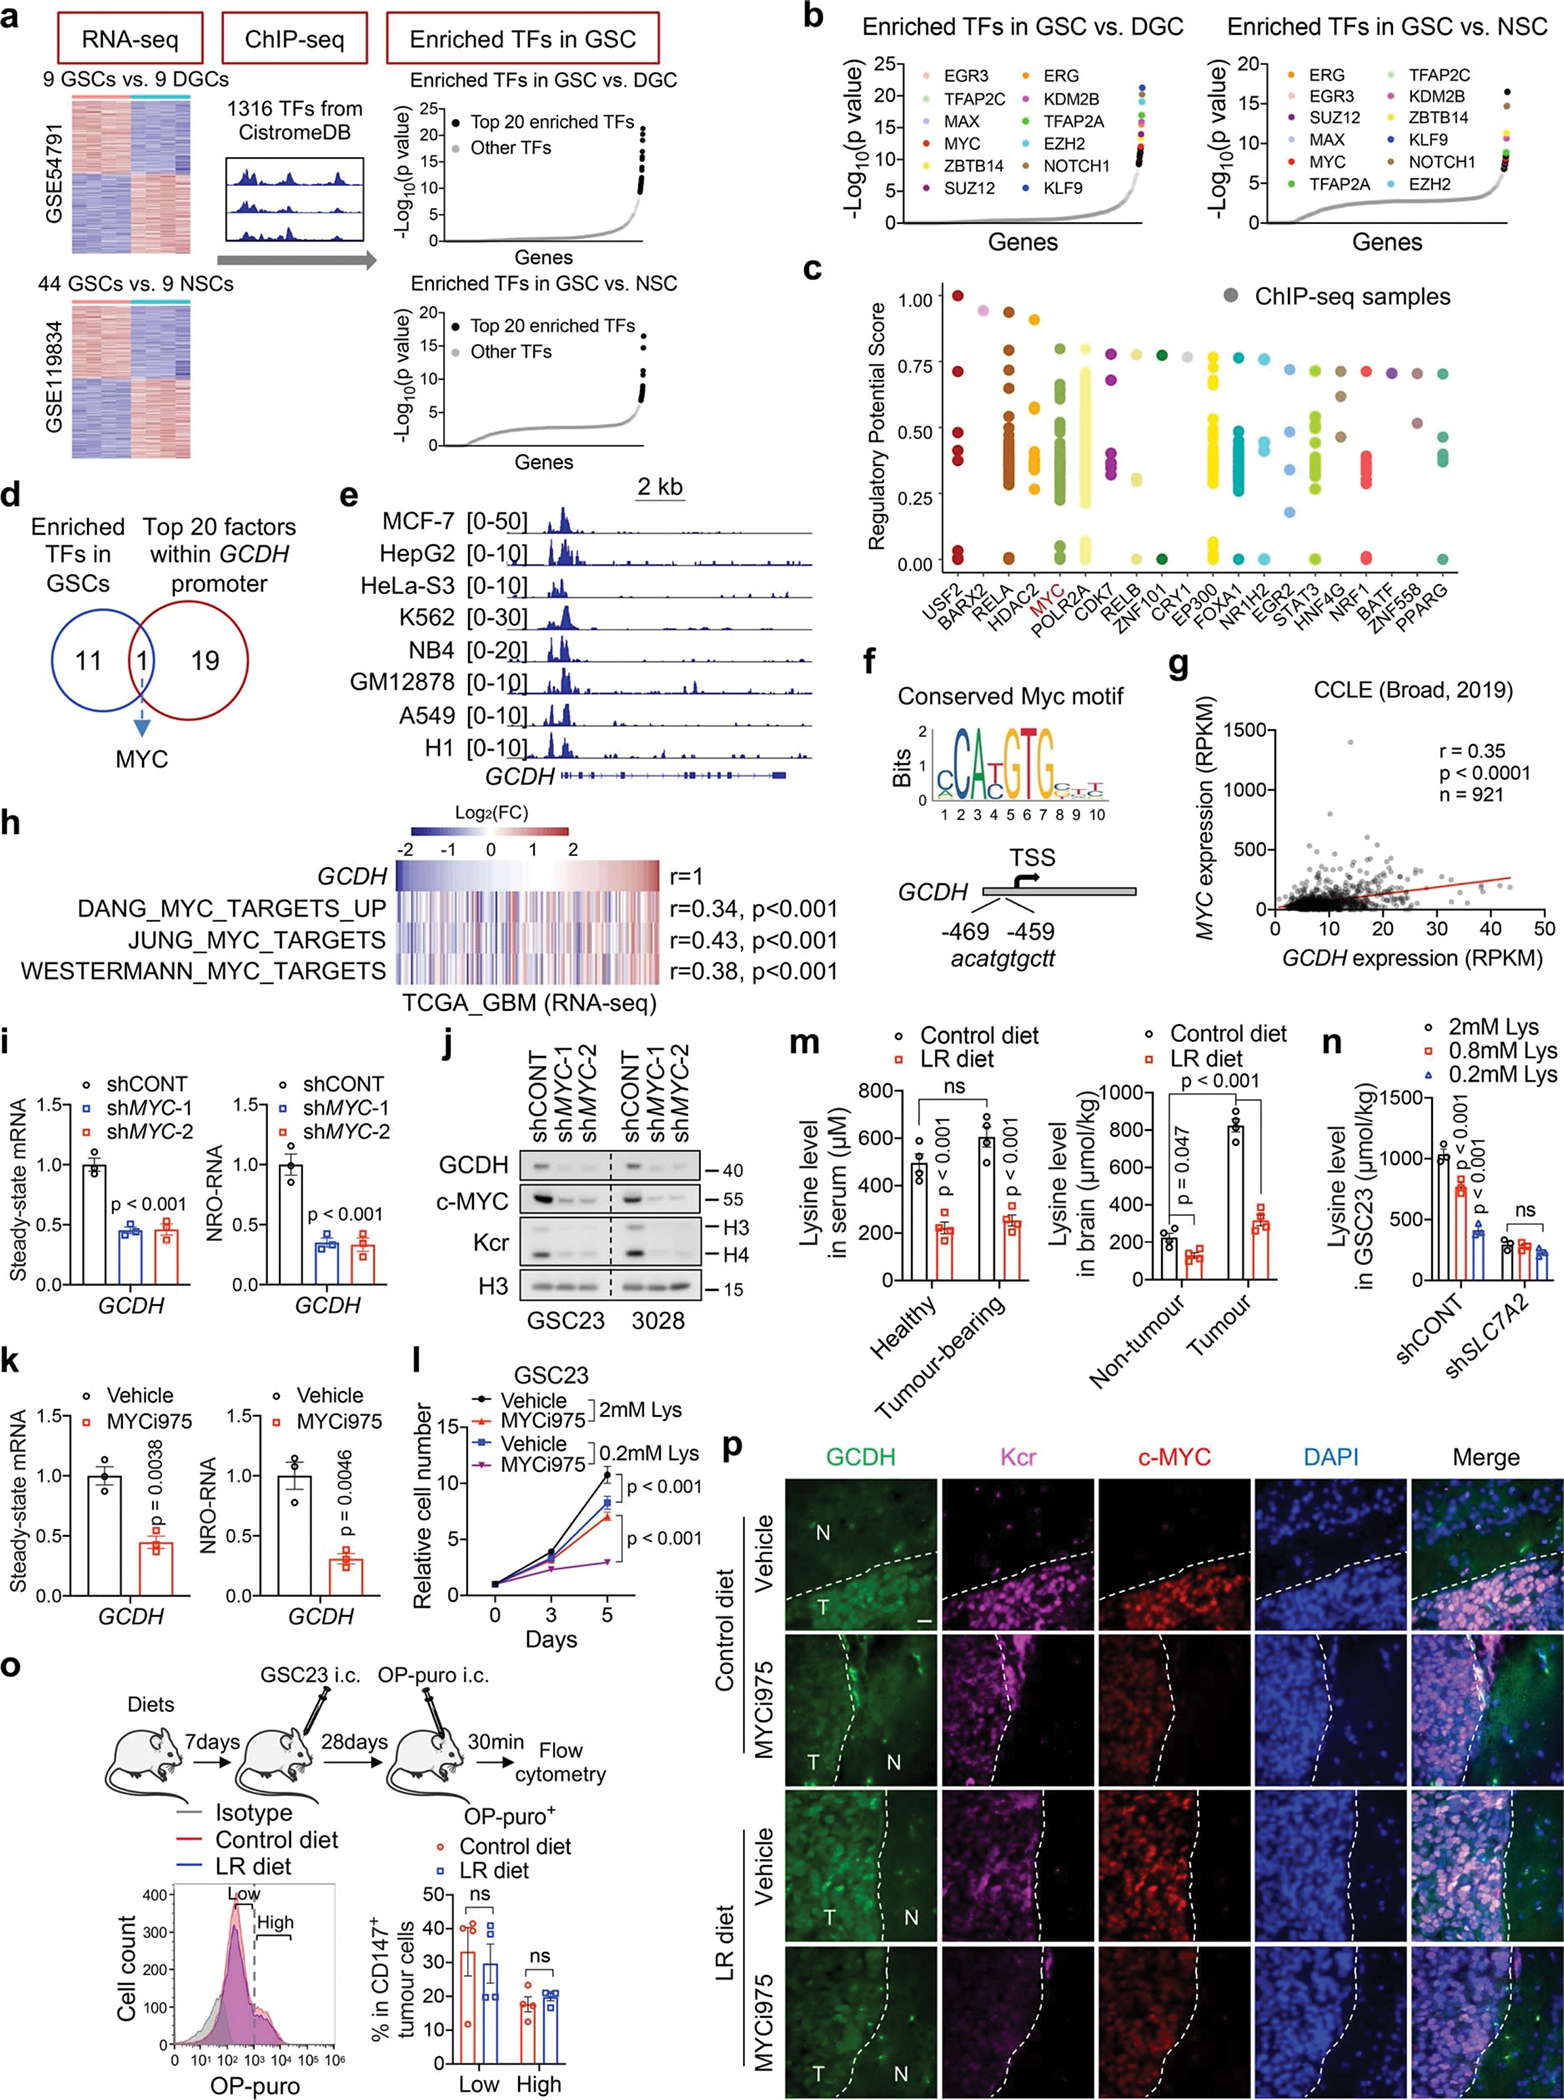
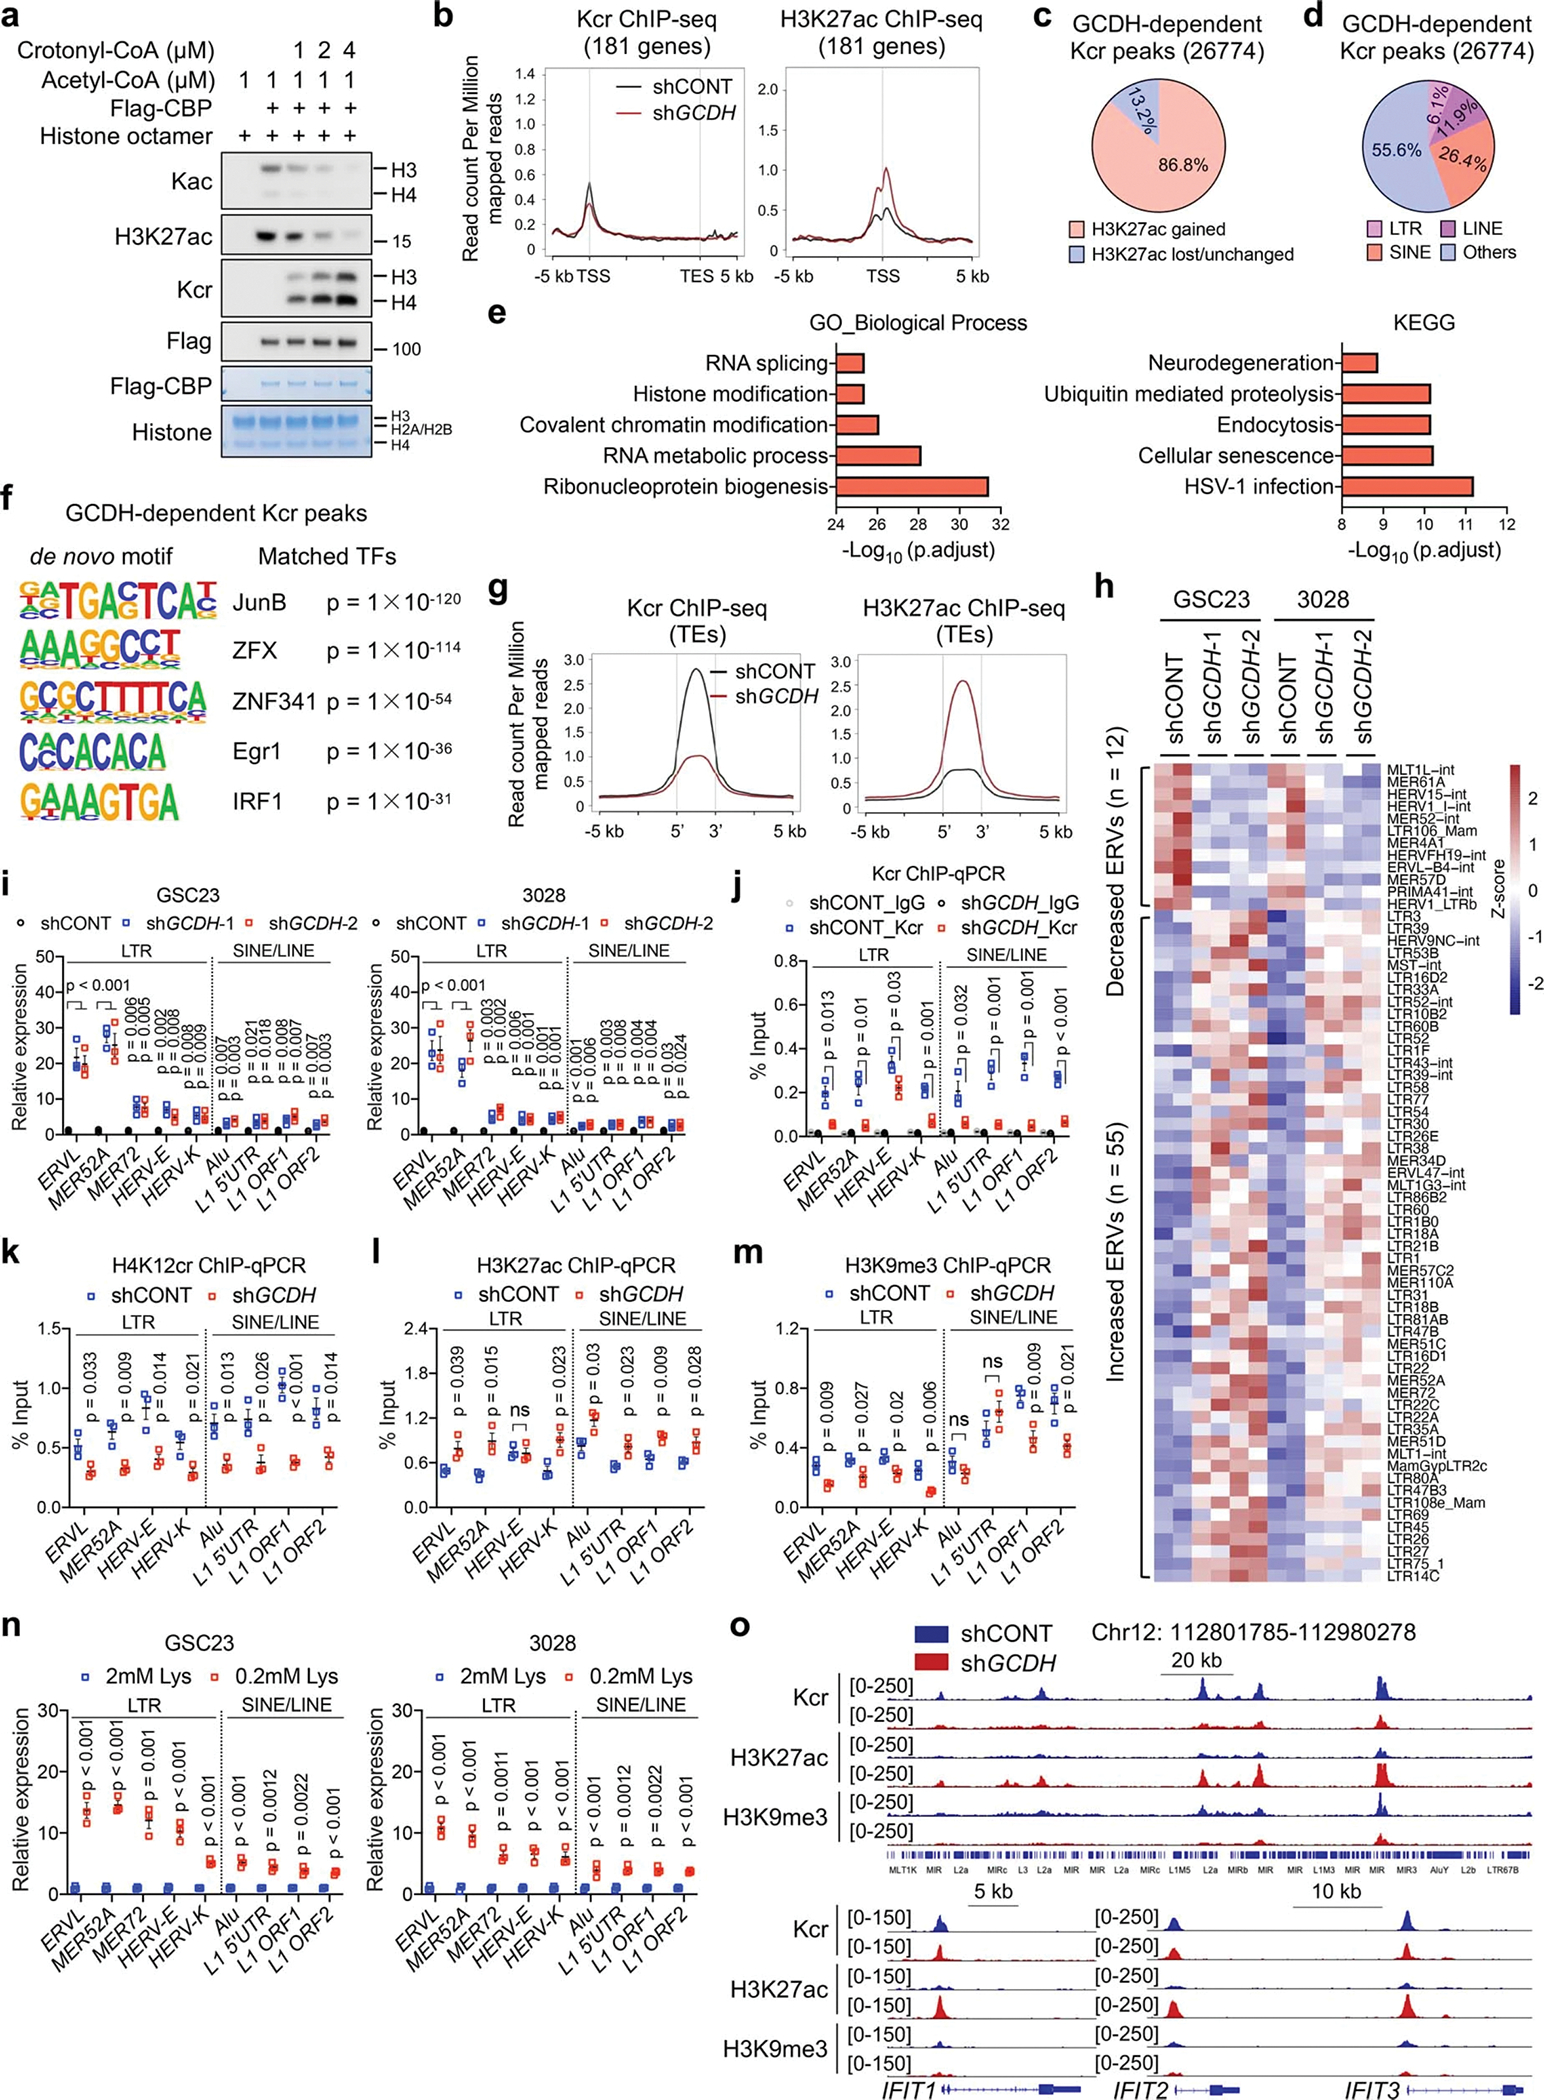
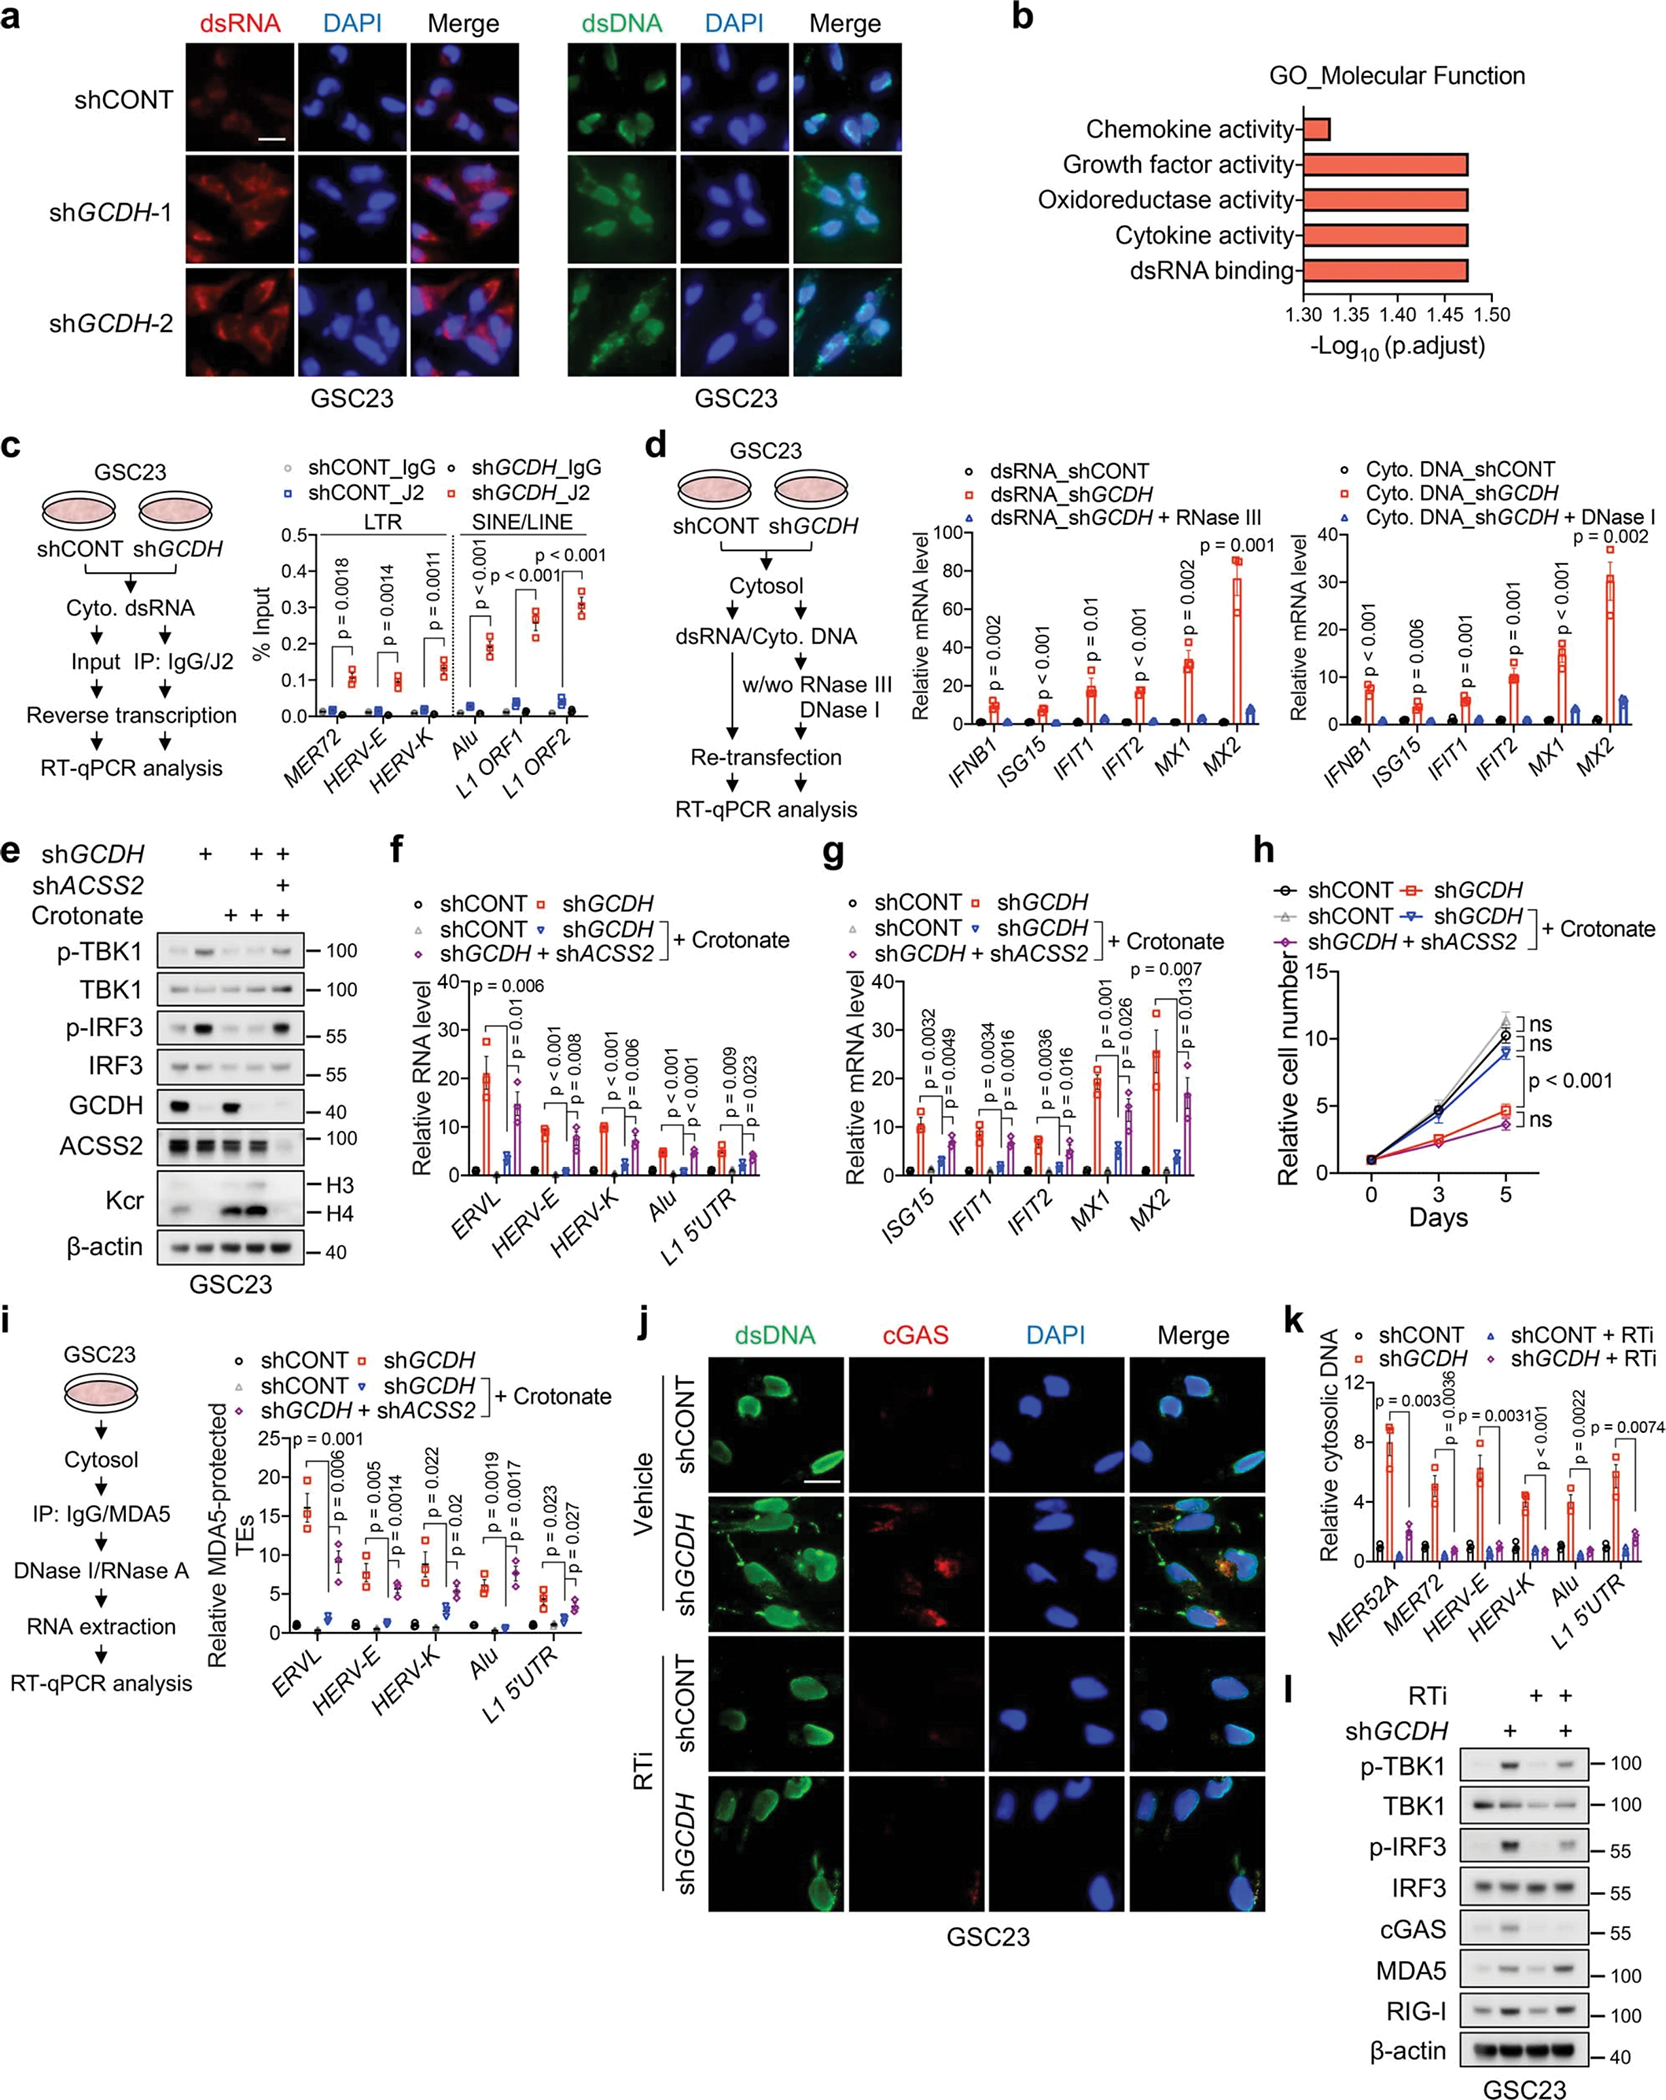
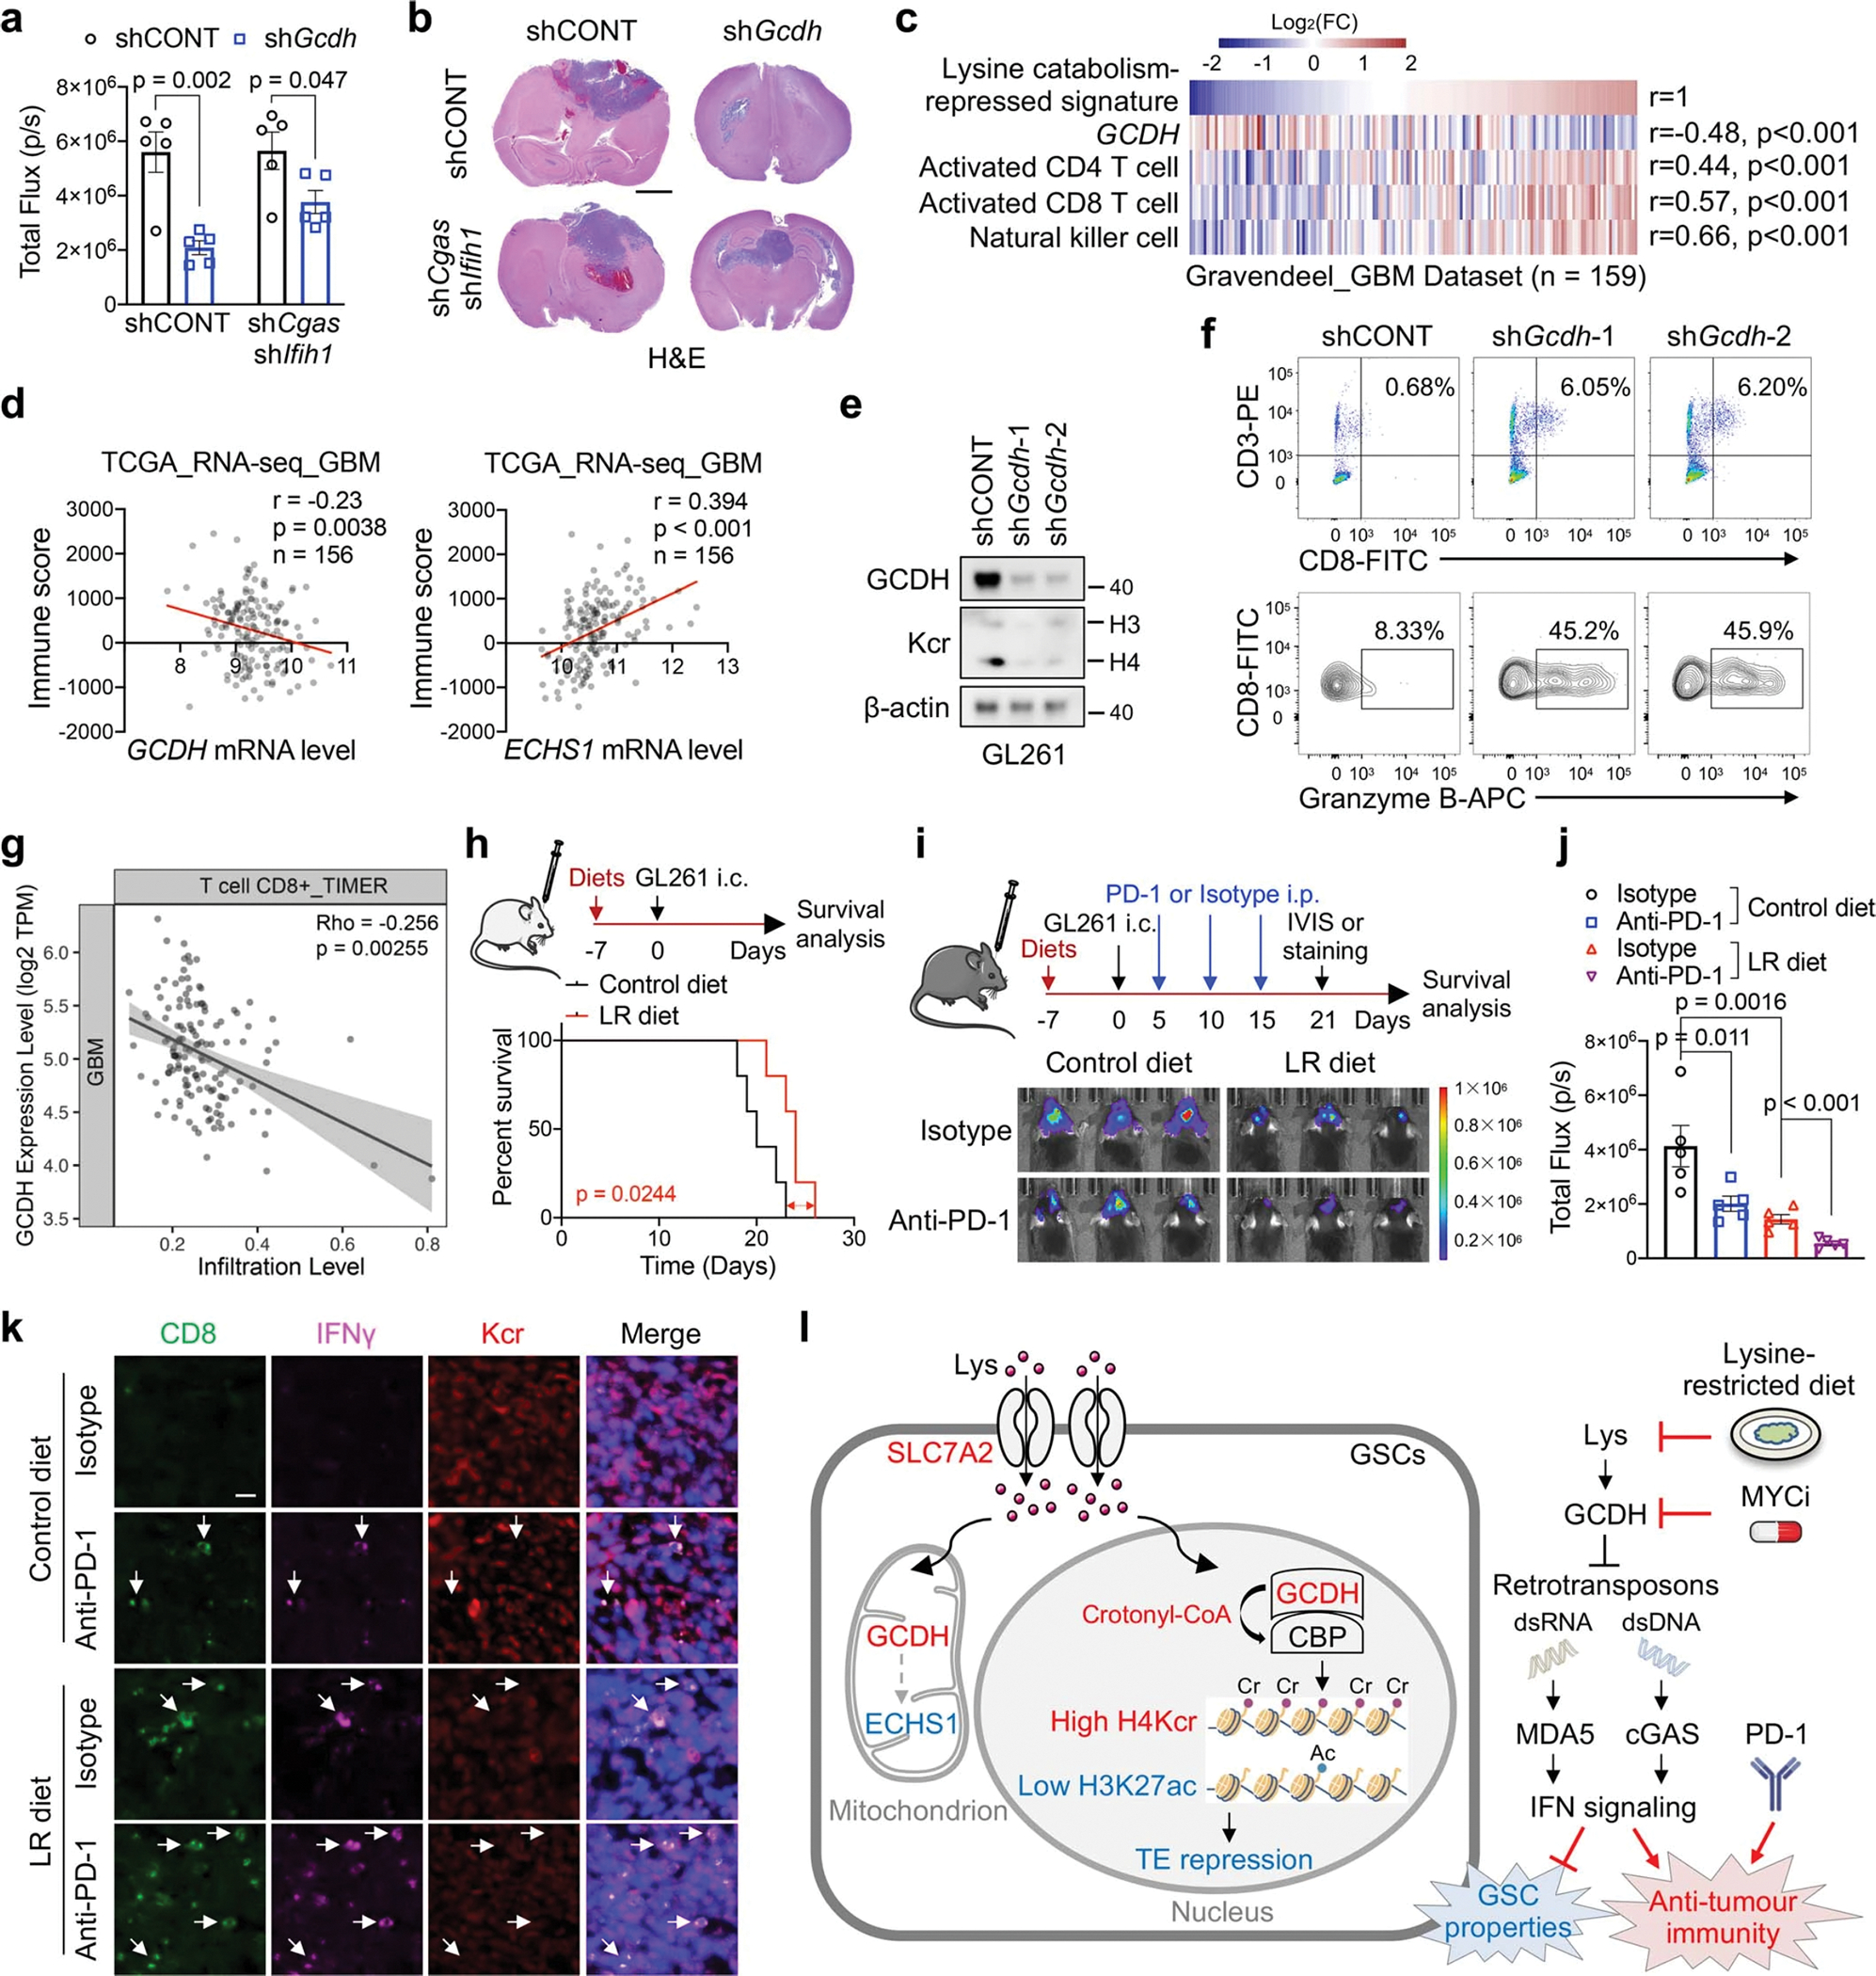
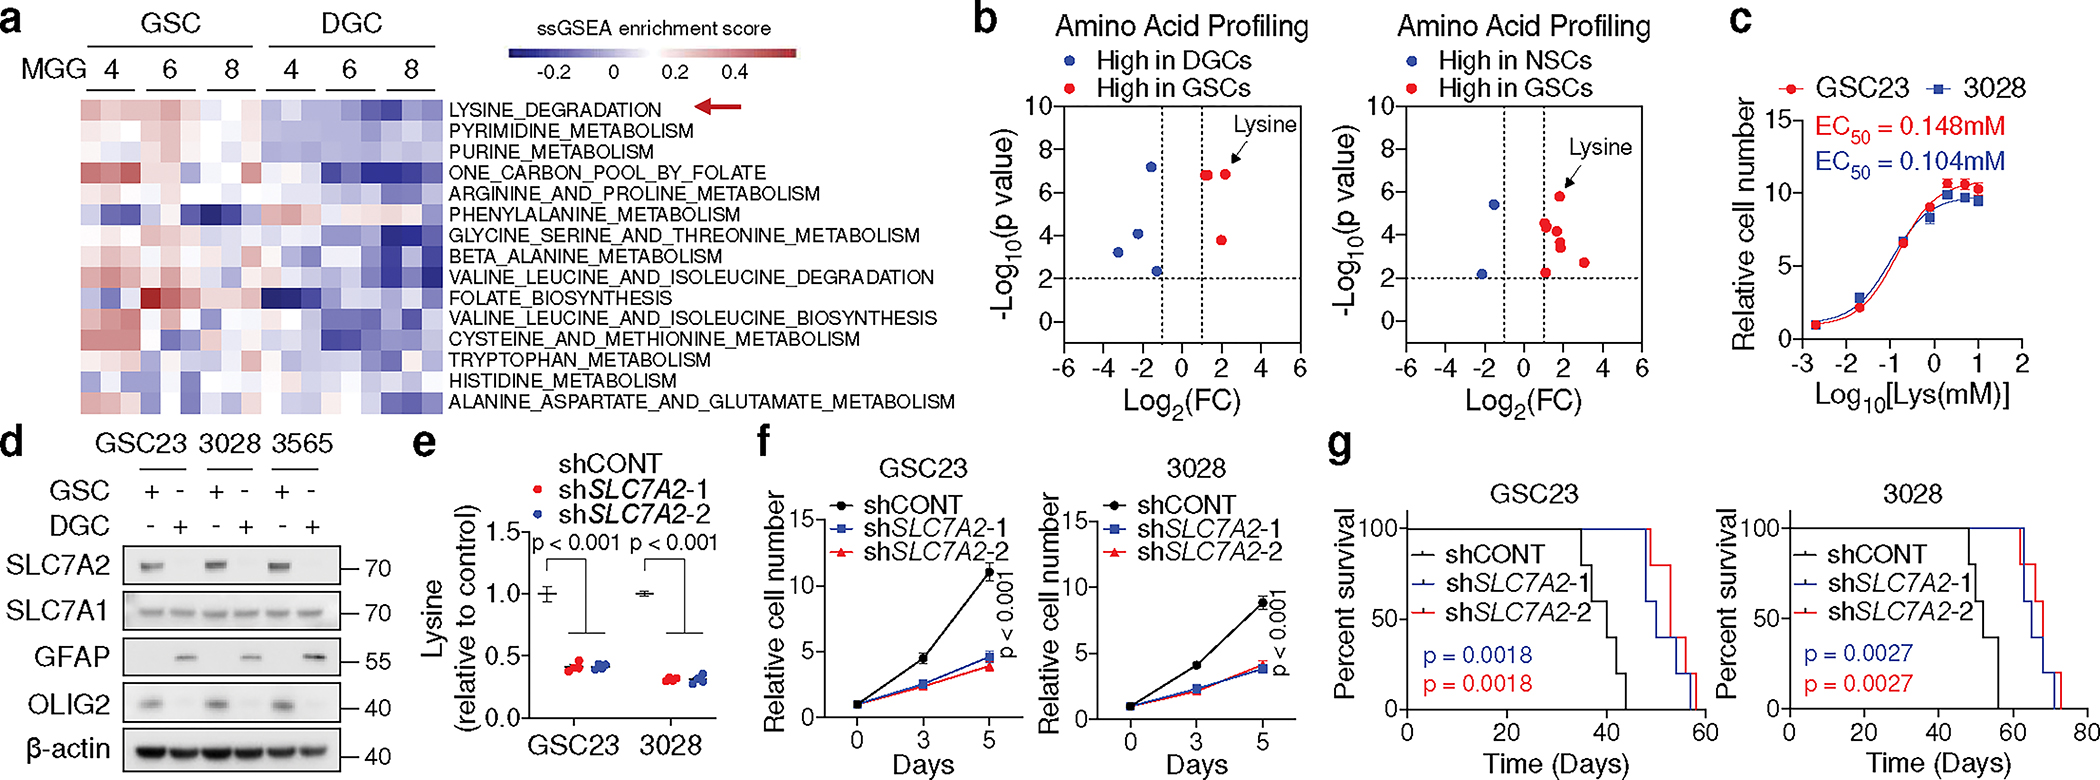
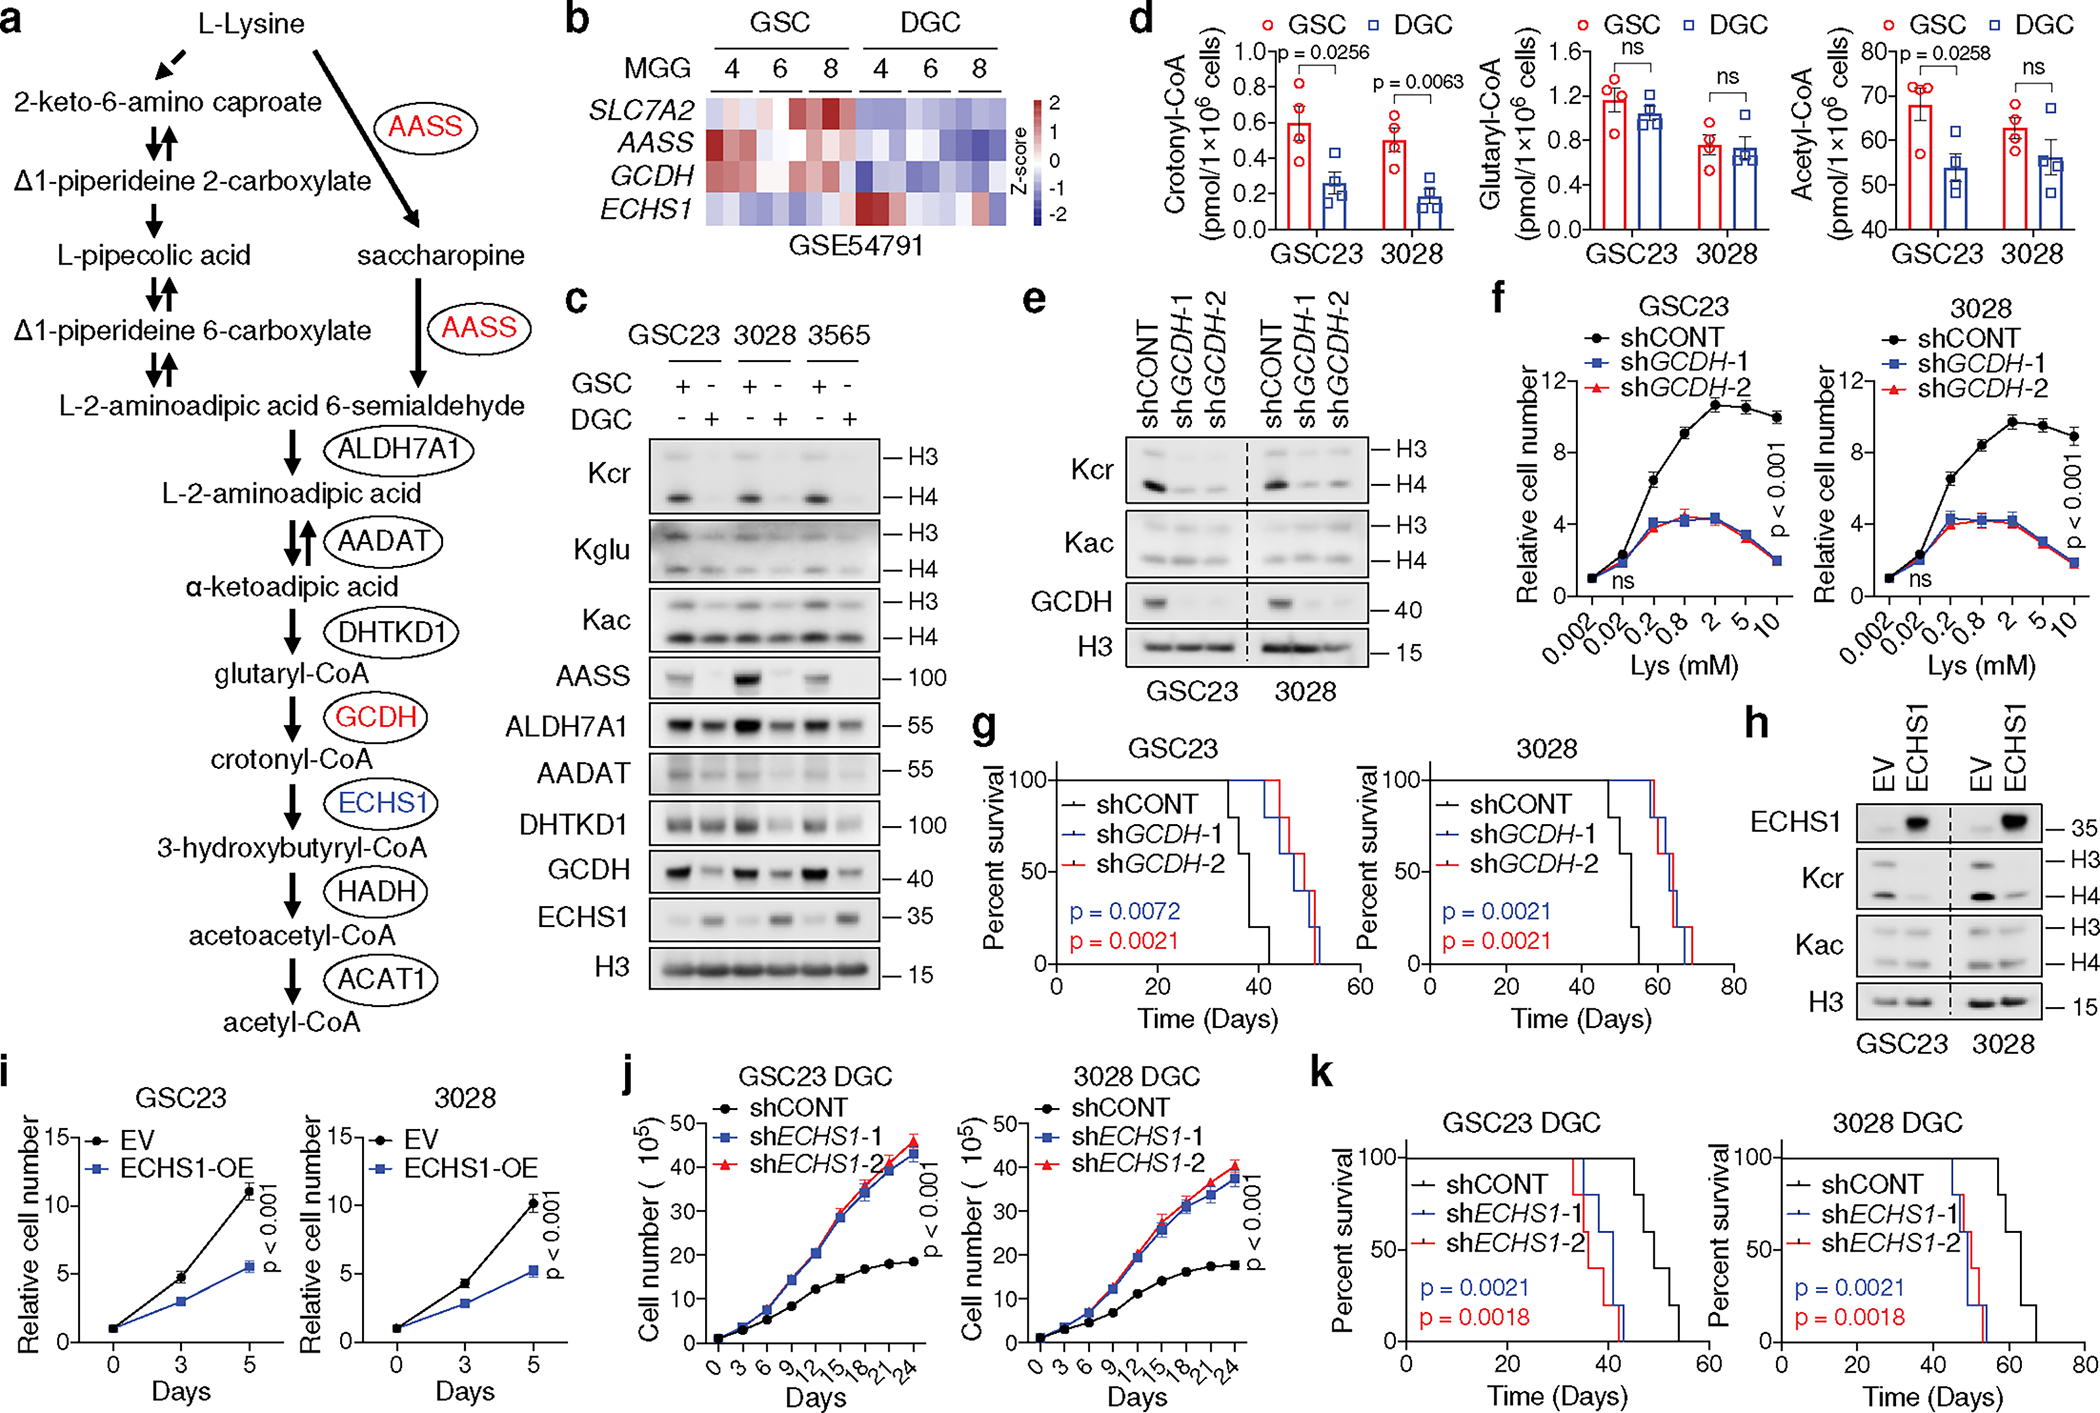
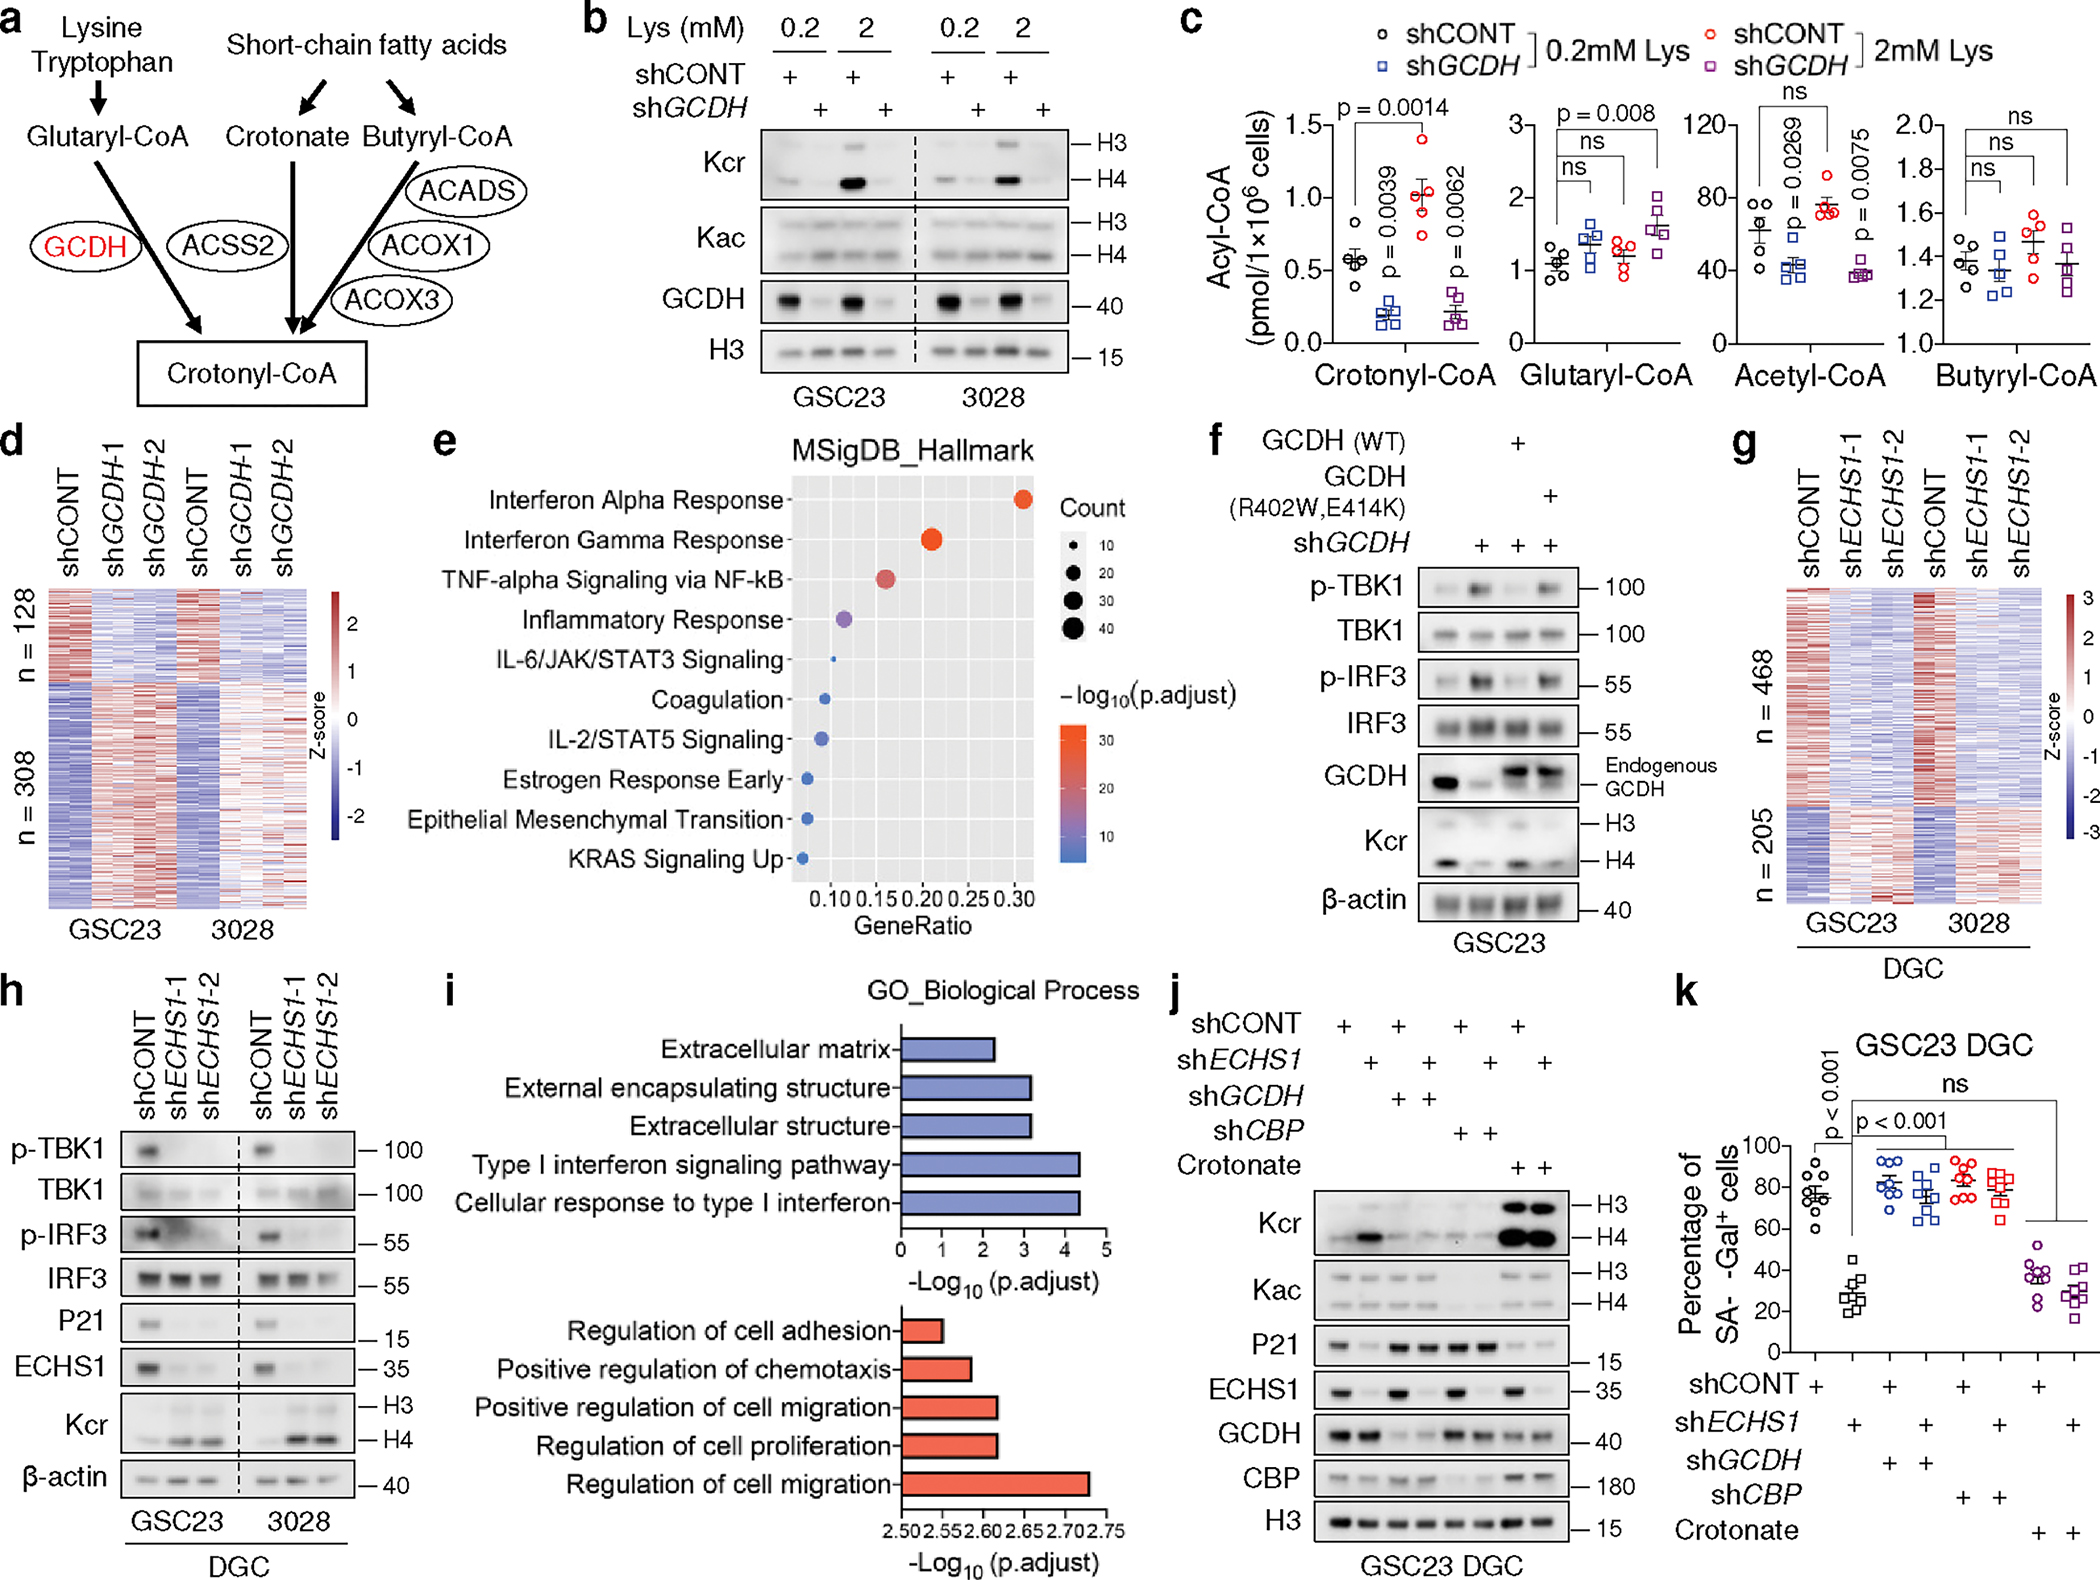
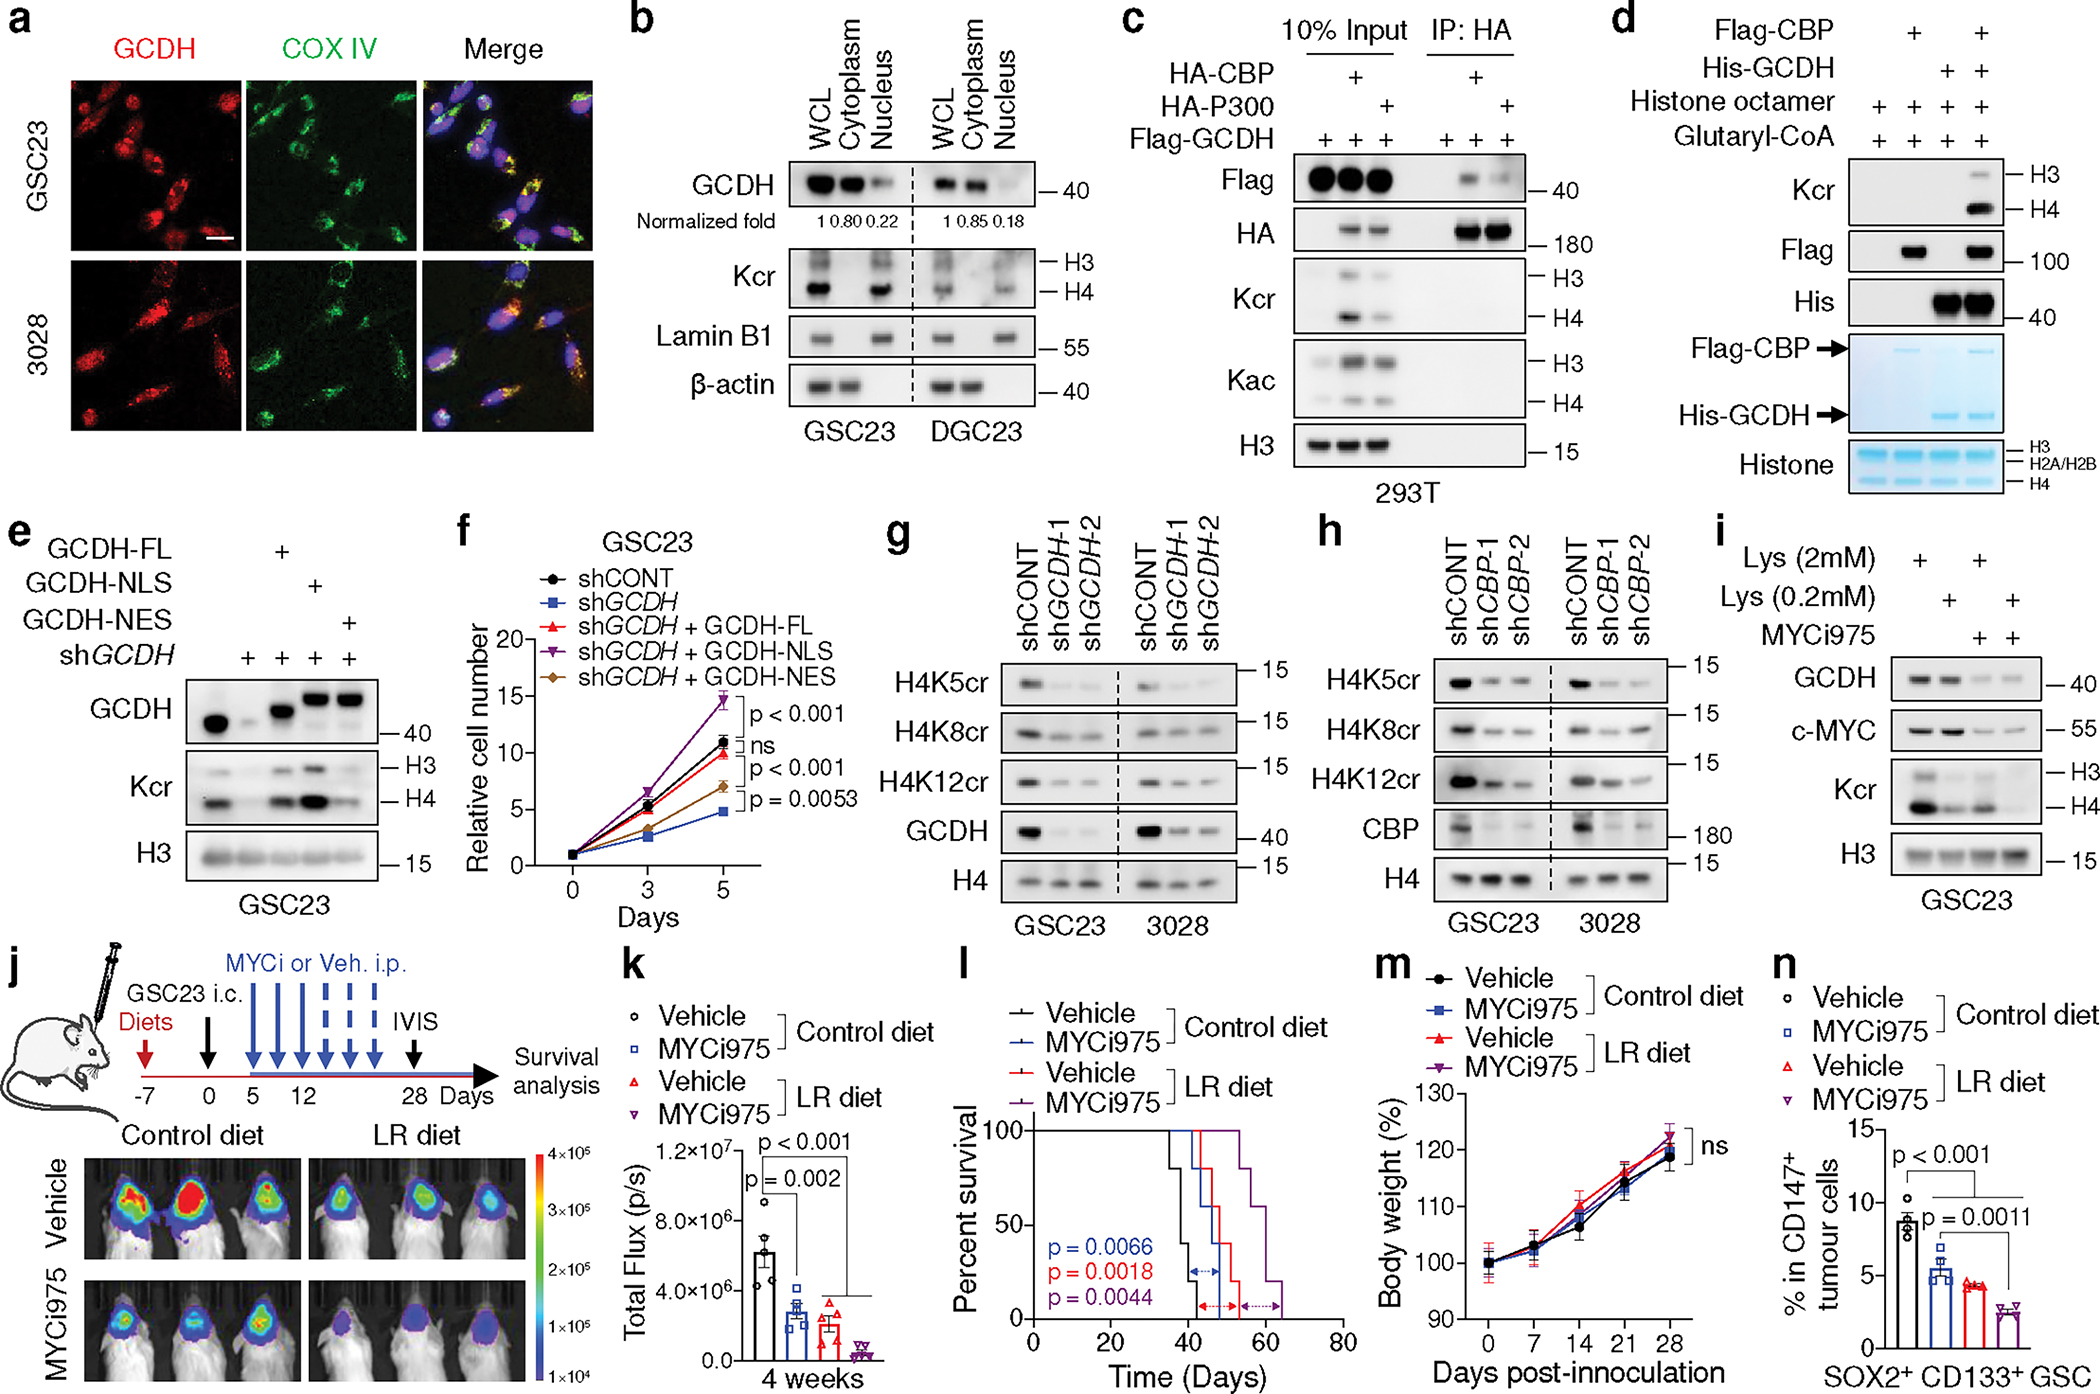
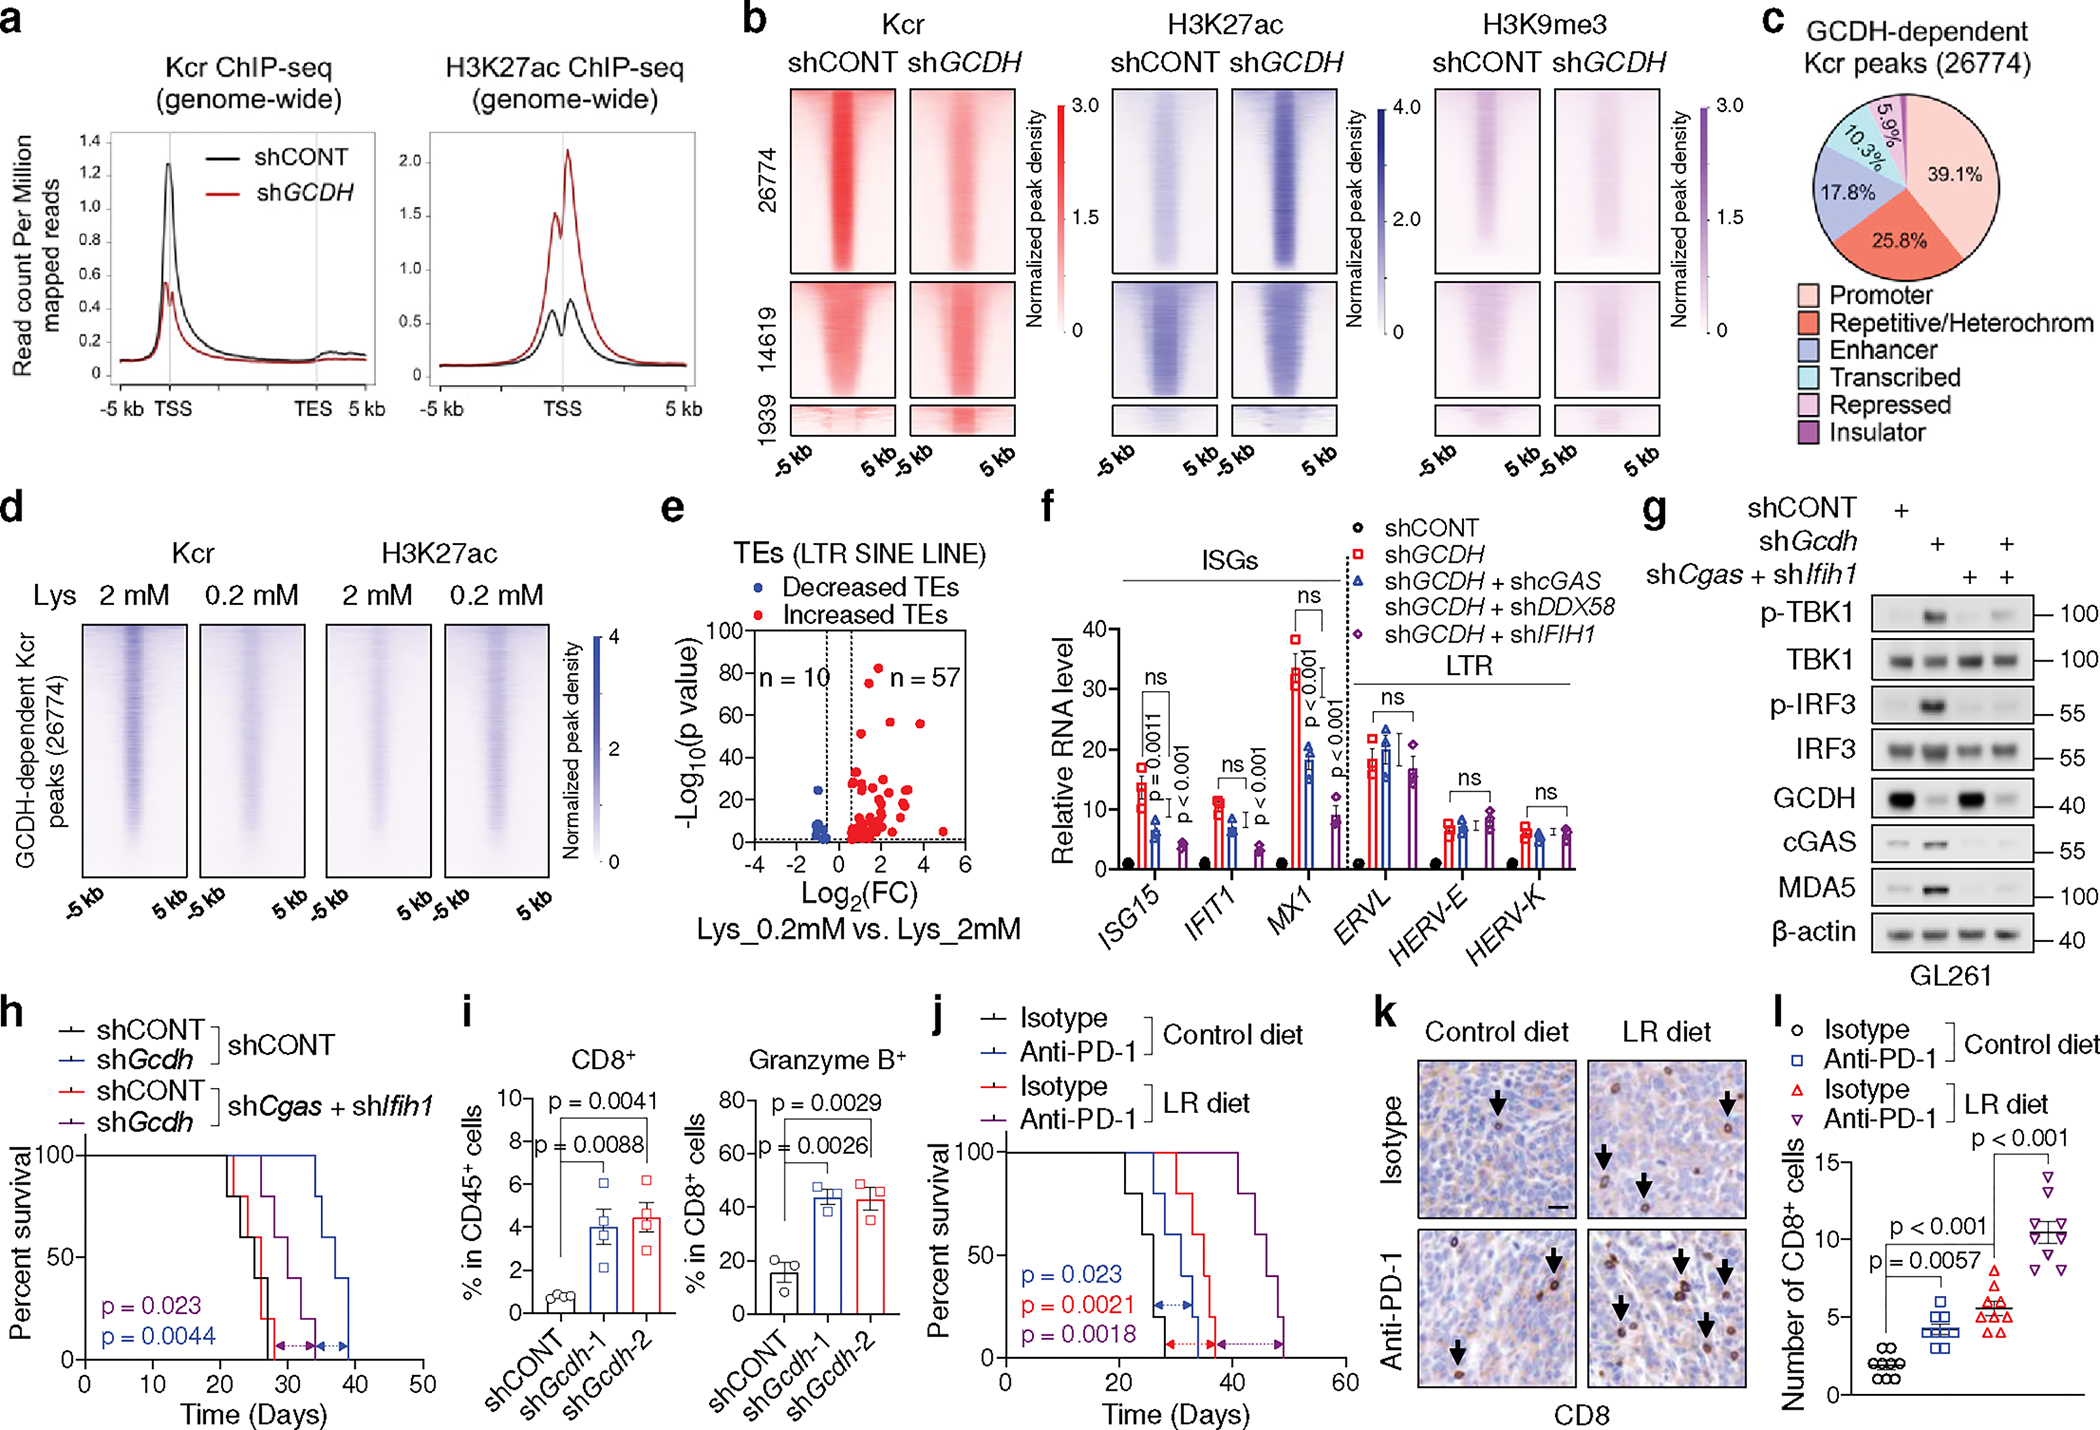
Cancer cells rewire metabolism to favour the generation of specialized metabolites that support tumour growth and reshape the tumour microenvironment1,2. Lysine functions as a biosynthetic molecule, energy source and antioxidant3-5, but little is known about its pathological role in cancer. Here we show that glioblastoma stem cells (GSCs) reprogram lysine catabolism through the upregulation of lysine transporter SLC7A2 and crotonyl-coenzyme A (crotonyl-CoA)-producing enzyme glutaryl-CoA dehydrogenase (GCDH) with downregulation of the crotonyl-CoA hydratase enoyl-CoA hydratase short chain 1 (ECHS1), leading to accumulation of intracellular crotonyl-CoA and histone H4 lysine crotonylation. A reduction in histone lysine crotonylation by either genetic manipulation or lysine restriction impaired tumour growth. In the nucleus, GCDH interacts with the crotonyltransferase CBP to promote histone lysine crotonylation. Loss of histone lysine crotonylation promotes immunogenic cytosolic double-stranded RNA (dsRNA) and dsDNA generation through enhanced H3K27ac, which stimulates the RNA sensor MDA5 and DNA sensor cyclic GMP-AMP synthase (cGAS) to boost type I interferon signalling, leading to compromised GSC tumorigenic potential and elevated CD8+ T cell infiltration. A lysine-restricted diet synergized with MYC inhibition or anti-PD-1 therapy to slow tumour growth. Collectively, GSCs co-opt lysine uptake and degradation to shunt the production of crotonyl-CoA, remodelling the chromatin landscape to evade interferon-induced intrinsic effects on GSC maintenance and extrinsic effects on immune response.


Conflict of interest statement

Competing interests

Y.Z. is a founder, board member, advisor to, and inventor on patents licensed to PTM Bio Inc. (Hangzhou, China and Chicago, IL) and Maponos Therapeutics Inc. (Chicago, IL). The other authors declare no competing interests.

Figures

Extended Data Fig. 1
Extended Data Fig. 1. SLC7A2 augments lysine consumption to support GSC function.
a, ssGSEA of metabolic gene sets from BioCyc database in three GSCs and matched DGCs. Each cell contains 3 replicates from GSE54791. b, Box plots comparing lysine catabolic activity defined by corresponding gene set signatures in non-tumour brain tissue and three subtypes of GBM across two datasets from GlioVis. Boxes represent data within the 25-to-75 percentiles. Whiskers depict the range of all data points. Horizontal lines within boxes represent mean values. n indicates the number of biologically independent samples. c, Kaplan-Meier plots of GBM patients grouped by lysine catabolism signature score. d-f, Cell proliferation of GSCs (d), DGCs (e) and NSCs (f) cultured in media with indicated concentrations of L-lysine. Lysine-deprived DMEM supplemented with 10% dialyzed FBS and indicated concentrations of L-lysine was used to culture DGCs. g, IB analysis of GSC23 cultured in media with indicated concentrations of L-lysine for 5 days. 1 μM Puromycin was added 30 min before harvest. h, i, SLC7A1 (h) and SLC7A2 (i) expression levels in GSCs, DGCs, and NSCs. Boxes represent data within the 25-to-75 percentiles. Whiskers depict the range of all data points. Horizontal lines within boxes represent mean values. Three GSCs (MGG4, MGG6 and MGG8, each cell contains 3 replicates) and matched DGCs were queried in GSE54791. n = 8 biologically independent cells in NSCs and GSCs from GSE119834. j, H3K27ac ChIP-seq tracks at SLC7A1 and SLC7A2 gene loci. k, IF staining of SLC7A2 in GSCs, DGCs and NSCs. Scale bar, 20 μm. l, IB analysis of GSCs with or without SLC7A2 KD. m, Volcano plot showing altered amino acids upon SLC7A2 KD in two GSCs. Fold changes in amino acid levels relative to the average of control group are displayed. n, Relative arginine levels (n = 4 biologically independent samples) in two GSCs with or without SLC7A2 KD by MS. Data are presented from three independent experiments in d-f. Representative of two independent experiments in g, k and l. Data are presented as mean ± SEM in d-f and n. One-way ANOVA followed by multiple comparisons with adjusted p values for b and n, log-rank test for c, two-way ANOVA followed by multiple comparisons with adjusted p values for d-f, two-tailed unpaired t test for h, i and m. ns, not significant.
Extended Data Fig. 2
Extended Data Fig. 2. Reprogrammed lysine catabolism affects GSC growth via GCDH.
a, 13C6-lysine tracing assays in GSCs (n = 4 biologically independent samples) and DGCs (n = 3 biologically independent samples). Cells were given 13C6-lysine for 12 h. b, Genomic alterations of SLC7A2, AASS, GCDH, and ECHS1 in TCGA GBM dataset from cBioPortal. c, Heatmap displaying clinical information, GCDH, ECHS1 mRNA levels and lysine catabolism signature scores. d-g, GCDH and ECHS1 expression in non-tumour brain tissue and three subtypes of GBM (d), and GBM samples with or without EGFR amplification (e-g) across datasets from GlioVis. Boxes represent data within the 25-to-75 percentiles. Whiskers depict the range of all data points. Horizontal lines within boxes represent mean values. n indicates the number of biologically independent samples. h, PCA highlights overlap between GSCs (n = 65,655 cells from 28 GSC cultures) and malignant GBM tumour cells (n = 14,207 cells from 7 GBM tumours). Red and black lines represent contour encompassing 99% of GSCs and tumour cells, respectively. i, j, GBM tumour cells classified as GSC-like tumour cells (i) or differentiated tumour cells (j). k, Scoring of lysine degradation gene signature (12,720 differentiated tumour cells and 1,487 GSC-like tumour cells). Violin plots represent the overall distribution of data points. Boxes show median, upper and lower quartiles. Whiskers depict 1.5 times the interquartile range. l, Visualization of GFAP expression within GBM tumour cells. m, RT-qPCR analysis of indicated genes in three GSCs (GSC23, 3028, and 3565) and NSCs (HNP1, NSC11, and ENSA). n, Relative intracellular SCFAs (n = 3 biologically independent samples) in GSCs and DGCs. o, IF staining of Kcr in GSCs, DGCs and NSCs. Scale bar, 20 μm. p, H3K27ac ChIP-seq tracks at GCDH gene locus. q, IB analysis of GSC23 cultured in media with indicated concentrations of L-lysine for 5 days. r, s, IB (r) and cell proliferation (s) of two GSCs with or without ECHS1 KD. Data are presented from three independent experiments in m and s. Representative of two independent experiments in o, q and r. Data are presented as mean ± SEM in a, m, n and s. One-way ANOVA followed by multiple comparisons with adjusted p values for a and d, two-tailed unpaired t test for e-g, k, m and n, two-way ANOVA followed by multiple comparisons with adjusted p values for s. ns, not significant.
Extended Data Fig. 3
Extended Data Fig. 3. The dependence of key crotonyl-CoA producing enzymes in GSCs.
a, RT-qPCR analysis of key crotonyl-CoA-producing enzymes in paired GSCs and DGCs. b, c, Expression levels of indicated genes from public datasets. n = 8 biologically independent cells in NSCs and GSCs from GSE119834. Three GSCs (MGG4, MGG6 and MGG8, each cell contains 3 replicates) and matched DGCs were queried in GSE54791. d-g, IB analysis (d, f) and cell proliferation (e, g) in DGCs (d, e) or NSCs (f, g) with or without GCDH KD. h, i, RT-qPCR analysis (h) and intracellular acyl-CoAs (i, n = 4 biologically independent samples) in GSC23 with or without indicated gene depletion. j, Relative intracellular SCFAs (n = 4 biologically independent samples) in GSC23 with or without GCDH KD cultured in media with indicated concentrations of L-lysine. Data are presented from three independent experiments in a, e, g and h. Representative of two independent experiments in d and f. Data are presented as mean ± SEM in a, e and g-j. Boxes represent data within the 25-to-75 percentiles in b and c. Whiskers depict the range of all data points. Horizontal lines within boxes represent mean values. Two-tailed unpaired t test for a-c and h, two-way ANOVA followed by multiple comparisons with adjusted p values for e and g, one-way ANOVA followed by multiple comparisons with adjusted p values for i and j. ns, not significant.
Extended Data Fig. 4
Extended Data Fig. 4. Lysine catabolism modulates IFN signalling and cell growth in vitro.
a, GO enrichment analysis of 308 upregulated genes upon GCDH KD, ranked by adjusted p values. b, Representative images and quantification of EdU+ proportion of GSCs with or without GCDH KD. GSCs were exposed to 10 μM EdU for 2 h. Scale bar, 20 μm. c, Heatmap showing the upregulated ISGs and SASP factors from RNA-seq upon GCDH loss in GSCs. d, e, Proportion of EdU+ (d) and SA-β-Gal+ (e) DGCs with or without ECHS1 KD after 21 days in culture. DGCs were exposed to 10 μM EdU for 12 h. Scale bar, 20 μm. f, Dot plot summarizing top 10 signalling pathways enriched in the 468 downregulated genes upon ECHS1 KD in two DGCs, ranked by adjusted p values. g, Heatmap summarizing the DEGs of two GSCs cultured in media with indicated concentrations of L-lysine. h, GSEA of two top pathways among DEGs from two GSCs cultured in media with high or low L-lysine. Normalized enrichment score (NES) and adjusted p values are shown. i, Enrichment analysis of the 278 downregulated genes upon high L-lysine treatment in GSCs, ranked by adjusted p values. j, Venn diagram showing the overlapping genes with increased expression upon GCDH depletion and decreased expression by high-lysine treatment in two GSCs. k, Enrichment analysis of the 181 overlapping genes, ranked by adjusted p values. Representative of two independent experiments in b, d and e, and data are presented as mean ± SEM. One-way ANOVA followed by multiple comparisons with adjusted p values for b, d and e.
Extended Data Fig. 5
Extended Data Fig. 5. IFN signalling suppresses GSC maintenance.
a, IB analysis of GSC23 after GCDH KD at the indicated time. b, ELISA quantification of IFNα and IFNβ in culture supernatants from GSCs with or without GCDH KD. nd, not detected. c, d, IB analysis of GSC23 treated with IFNβ (5 ng/ml, c) or culture supernatants from GSC23 with or without GCDH KD (d) for indicated time. IFNβ was added every 2 days for the duration of experiments. The supernatants with or without IFNAR blocking antibody were replaced every 2 days. e, IF staining for IFNα, Kcr, Kac, Kglu and GCDH in indicated sections from GSC23-derived intracranial tumours (n = 3 biologically independent mice). Scale bar, 20 μm. f, RT-qPCR analysis of human ISGs in GSC23-derived intracranial tumour tissues (n = 4 biologically independent mice). g, The gating strategy of GSCs in flow cytometric analysis. h, i, Flow cytometry plots (h) and quantification (i, n = 4 biologically independent mice) of SOX2+ CD133+ GSCs in CD147+ human tumour cells as indicated. Representative of two independent experiments in a, c and d. Data are presented from three independent experiments in b. In b, f and i, data are presented as mean ± SEM. One-way ANOVA followed by multiple comparisons with adjusted p values for f and i.
Extended Data Fig. 6
Extended Data Fig. 6. Nuclear-localized GCDH interacts with CBP to affect histone H4 Kcr.
a, IF staining of GCDH, Kcr and SOX2 in tumour (n = 3 biologically independent samples) and non-tumour brain tissues of GBM surgical specimens. Arrows, GSC-like tumour cells; arrowheads, differentiated tumour cells. Scale bar, 20 μm. b, IB analysis of cytoplasmic and nuclear fractions of indicated proteins in GSCs. c, IF staining of ECHS1 in GSCs. Scale bar, 20 μm. d, IP-purified Flag-GCDH protein complex from the nuclear fraction of 293T cells was analysed by silver staining and IB. e, IB analysis of GSCs treated with 1 μM A485 or 2 μM SGC-CBP30 for 3 days. f, IB analysis of endogenous interaction between GCDH and CBP in the nuclei of GSCs. g, In vitro interaction assay with recombinant GCDH and CBP proteins. h, i, IB (h) and cell proliferation (i) of GSCs with or without CBP KD cultured in media with indicated concentrations of L-lysine. j, IB analysis of Kcr in GSCs upon P300 KD. k, IB analysis of IP in 293T cells co-transfected with the indicated plasmids. Summary of GCDH fragments used to interact with CBP is shown on the left. l, IF staining of GCDH fragments in GSC23. Scale bar, 20 μm. m, Nuclear GCDH complex crotonylates histone in vitro. Purified cytoplasmic or nuclear GCDH complexes from 293T cells transfected with indicated plasmids were incubated with histone octamer and glutaryl-CoA. n, Representative MS spectrum of histone H4K8 crotonylated peptide from GSC23 cultured in media with 2 mM L-lysine. Heatmap summarizes the quantification of crotonylation signals at H4K5, H4K8 and H4K12 in GSCs. o, IB analysis of H4 Kcr in DGCs with or without ECHS1 KD. Representative of two independent experiments in a-h, j-m and o. Data are presented as mean ± SEM from three independent experiments in i. Two-way ANOVA followed by multiple comparisons with adjusted p values for i.
Extended Data Fig. 7
Extended Data Fig. 7. MYC directly regulates GCDH expression.
a, Diagram depicting the screening strategy to identify enriched TFs with selective dependency in GSCs. b, 12 overlapped TFs responsible for DEGs between GSCs and DGCs/NSCs among the top 20 enriched TFs. c, Top 20 upstream regulators for GCDH transcription, ranked by regulatory potential (RP) score from BETA algorithm. Each dot represents a ChIP-seq sample with analysed TFs labelled on the X axis. TFs with high RP scores are more likely to regulate GCDH. d, Venn diagram showing the overlapped TFs. e, MYC ChIP-seq tracks at GCDH gene locus in 8 human cell lines from ENCODE database. f, The promoter of GCDH harbours a conserved MYC-binding element. g, h, Correlation between GCDH and MYC mRNA (g) or signature (h). i-k, RT-qPCR (i, k) and IB (j) analysis of steady-state mRNA, nascent transcripts or protein of GCDH in GSCs with or without MYC inhibition. NRO, nuclear run-on. l, Cell proliferation of GSC23 cultured in indicated media and treated with or without 0.2 μM MYCi975 for 5 days. m, Lysine levels in serum and brain tissues from healthy NSG mice or NSG mice bearing GSC23-derived intracranial tumours after dietary lysine restriction for 4 weeks (n = 4 biologically independent mice). n, Intracellular lysine levels of GSC23 cultured in indicated media for 5 days. o, Flow cytometry plots and quantification (n = 4 biologically independent mice) of protein synthesis rate in CD147+ human tumour cells as indicated. p, IF staining of indicated sections from GSC23-derived intracranial tumours (n = 3 biologically independent mice). N, non-tumour; T, tumour. Scale bar, 20 μm. Data are presented from three independent experiments in i, k, l and n. Representative of two independent experiments in j. Data are presented as mean ± SEM in i and k-o. Pearson’s correlation with two-tailed test for g and h, one-way ANOVA followed by multiple comparisons with adjusted p values for i, m and n, two-tailed unpaired t test for k and o, two-way ANOVA followed by multiple comparisons with adjusted p values for l. ns, not significant.
Extended Data Fig. 8
Extended Data Fig. 8. Histone Kcr governs retrotransposon expression by remodelling the chromatin landscape.
a, IB analysis of Kac and Kcr by in vitro acetylation and crotonylation assays. b, Kcr and H3K27ac ChIP-seq signals at genomic loci of lysine catabolism-repressed genes in control and GCDH KD GSC23. c, Pie charts showing proportions of increased and lost/unchanged H3K27ac signals within GCDH-dependent Kcr peaks after GCDH loss. d, Percentages of TEs (LTRs, LINEs and SINEs) in GCDH-dependent Kcr peaks. e, GO and KEGG analysis of GCDH-dependent Kcr occupied genes, ranked by adjusted p values. f, Motif sequences (left) and 5 best matched TFs with corresponding p value (right) from de novo motif analysis of GCDH-dependent Kcr peaks. g, Tag density of Kcr and H3K27ac profiles on TEs (LTRs, LINEs and SINEs) upon GCDH loss. h, Heatmap summarizing the differential transcript expression of LTR-containing ERVs from multiple genomic loci between control and GCDH KD GSCs. i-n, RT-qPCR (i, n) and ChIP-qPCR (j-m) analyses of representative TEs with primers that detected overall levels of the corresponding TE subfamilies from multiple genomic loci. Data are presented as mean ± SEM from three independent experiments. Two-tailed unpaired t test was used for statistical analysis. ns, not significant. o, Genome browser snapshots of Kcr, H3K27ac and H3K9me3 signals at indicated genomic loci of TEs (upper panel) and ISGs (bottom panel) from control and GCDH KD GSC23.
Extended Data Fig. 9
Extended Data Fig. 9. Retrotransposons boost IFN signalling through cytosolic dsRNA and dsDNA sensing pathways.
a, IF staining of dsRNA (left panels) and dsDNA (right panels) in GSC23 with or without GCDH KD. Scale bar, 20 μm. b, GO enrichment analysis of 308 upregulated genes upon GCDH KD in two GSCs, ranked by adjusted p values. c, RT-qPCR analysis of indicated retrotransposon transcripts captured by dsRNA-specific antibody (J2) in pulldown assay. Protocol is shown on the left. d, RT-qPCR analysis of ISGs in GSC23 transfected with cytosolic dsRNA or DNA. e-h, IB (e), RT-qPCR analysis of representative TEs (f) and ISGs (g), and cell proliferation (h) of GSC23 with indicated gene depletion or 2mM crotonate supplementation in culture media for 5 days. i, RT-qPCR analysis of representative TEs in MDA5-protected fractions after indicated gene depletion or 2mM crotonate supplementation in culture media for 5 days in GSC23. j-l, IF staining (j), qPCR analysis of TEs in cytosolic DNA (k) and IB analysis (l) of control and GCDH KD GSC23 treated with or without a reverse transcriptase inhibitor (RTi, 10 μM) for 48 h. Each TE level in cytosolic DNA was normalized to its expression in DNA isolated from nuclear lysate and control group. Scale bar, 20 μm. Representative of two independent experiments in a, e, j and l. Data are presented as mean ± SEM from three independent experiments in c, d, f-i and k. One-way ANOVA followed by multiple comparisons with adjusted p values for c, d, f, g, i and k, two-way ANOVA followed by multiple comparisons with adjusted p values for h. ns, not significant.
Extended Data Fig. 10
Extended Data Fig. 10. Lysine catabolism disruption enhances tumour immunogenicity.
a, b, Quantification of in vivo bioluminescence imaging (n = 5 biologically independent mice, a) and H&E-stained coronal sections (b) of immunocompetent mice bearing GL261-derived intracranial tumours at 3 weeks. Scale bar, 2 mm. c, Correlations between lysine catabolism-repressed signature, GCDH mRNA level, activated CD4 T cell, activated CD8 T cell and NK cell in GBM dataset. d, Correlation of GCDH, ECHS1 mRNA levels and immune scores based on ESTIMATE algorithm in TCGA GBM dataset. e, IB analysis of Kcr in GL261 upon Gcdh KD. f, Flow cytometric analysis of CD8+ T cells (upper panel) and Granzyme B+ CD8+ T cells (bottom panel) in GL261-derived intracranial tumours at day 14 post-injection. g, Scatter plots showing the correlation between GCDH expression levels and CD8+ T cell infiltration scores in TCGA GBM dataset from TIMER database. The gray area indicates 95 % confidence interval for the regression line. h, Kaplan-Meier survival plots of immunodeficient mice bearing GL261-derived intracranial tumours fed control or LR diet starting at 7 days before transplantation (n = 5). i, j, In vivo bioluminescence imaging (i) and quantification of total flux (n = 5 biologically independent mice, j) of immunocompetent mice bearing GL261-derived intracranial tumours with anti-PD-1, LR diet or the combination treatment. k, IF staining for CD8, IFNγ and Kcr in indicated sections (n = 3 biologically independent mice). Scale bar, 20 μm. l, A working model showing that disruption of reprogrammed lysine catabolism-derived histone Kcr suppresses GSC maintenance and induces anti-tumour immune response by promoting immunogenic retroelements and IFN signalling. Representative of two independent experiments in e. In a and j, data are presented as mean ± SEM. Two-tailed unpaired t test for a, Pearson’s correlation with two-tailed test for c and d, Spearman’s Rho with two-tailed test was used for g, log-rank test for h, one-way ANOVA followed by multiple comparisons with adjusted p values for j.
Fig. 1
Fig. 1. GSCs upregulate lysine catabolism through SLC7A2.
a, ssGSEA of metabolic gene sets from KEGG database in three GSCs (MGG4, MGG6, MGG8) and matched DGCs. Each cell contains 3 replicates from GSE54791. b, Volcano plots summarizing intracellular amino acid levels across GSCs, DGCs, and NSCs from 5 biological replicates. Fold changes in amino acid levels relative to the average of GSCs are displayed. c, Relative cell number of two GSCs cultured in media with different doses (0.002, 0.02, 0.2, 0.8, 2, 5, 10 mM) of L-lysine for 5 days. d, IB analysis of matched GSCs and DGCs. e, f, Relative intracellular lysine levels (n = 4 biologically independent samples, e) and cell proliferation (f) of GSCs with or without SLC7A2 KD. g, Kaplan-Meier plots showing survival of immunocompromised mice bearing intracranial tumours from GSCs with or without SLC7A2 KD (n = 5). Data are presented from three independent experiments in c and f. Representative of two independent experiments in d. In c, e and f, data are presented as mean ± SEM. Two-tailed unpaired t test for b, one-way ANOVA followed by multiple comparisons with adjusted p values for e, two-way ANOVA followed by multiple comparisons with adjusted p values for f, log-rank test for g.
Fig. 2
Fig. 2. GSCs reprogram lysine catabolism to promote Kcr and tumourigenesis.
a, Diagram showing lysine catabolism pathway. b, Heatmap summarizing gene expression in matched GSCs and DGCs. c, IB analysis of matched GSCs and DGCs. d, Intracellular acyl-CoAs (n = 4 biologically independent samples) in GSCs and DGCs. e, IB analysis of GSCs cultured in typical media. f, Relative cell number of two GSCs with or without GCDH KD cultured in media with increasing doses of L-lysine for 5 days. g, Kaplan-Meier survival plots of immunocompromised mice as indicated (n = 5). h, i, IB (h) and cell proliferation (i) of two GSCs with or without ECHS1 overexpression. j, Cumulative cell number of two DGCs with or without ECHS1 KD. k, Kaplan-Meier survival plots of immunocompromised mice as indicated (n = 5). Representative of two independent experiments in c, e and h. Data are presented from three independent experiments in f, i and j. Data are presented as mean ± SEM in d, f, i and j. Two-tailed unpaired t test for d, two-way ANOVA followed by multiple comparisons with adjusted p values for f, i and j, log-rank test for g and k. ns, not significant.
Fig. 3
Fig. 3. Perturbation of lysine catabolism affects type I IFN signalling.
a, Key metabolic pathways that produce crotonyl-CoA. Red, upregulation. b, c, IB (b) and intracellular acyl-CoAs (n = 5 biologically independent samples from GSC23, c) of control and GCDH KD GSCs cultured in media with indicated concentrations of L-lysine. d, Heatmap summarizing DEGs upon GCDH KD in two GSCs. e, Dot plot summarizing top 10 signalling pathways enriched in the upregulated genes upon GCDH KD in GSCs, ranked by adjusted p values. f, IB analysis of control and 3’UTR-targeted shGCDH GSC23 with or without ectopic expression of WT, GCDH enzymatic mutant (R402W, E414K). g, Heatmap summarizing DEGs upon ECHS1 KD in two early-passage DGCs. h, IB analysis of two DGCs with or without ECHS1 KD. i, GO enrichment analysis of downregulated (blue) and upregulated (red) genes upon ECHS1 KD in two DGCs, ranked by adjusted p values. j, k, IB (j) and SA-β-Gal+ percentage (k) of DGCs with indicated gene depletion or 2mM crotonate supplementation in culture media for 1 week. Representative of two independent experiments in b, f, h and j. Data are presented from three independent experiments in k. In c and k, data are presented as mean ± SEM. One-way ANOVA followed by multiple comparisons with adjusted p values for c and k. ns, not significant.
Fig. 4
Fig. 4. GCDH interacts with CBP in nucleus to modulate Kcr and confer MYC-dependence.
a, IF staining of GCDH in GSCs. Scale bar, 20 μm. b, Nuclear localization of GCDH in GSCs and DGCs. Band intensity of GCDH was measured and normalized to β-actin or Lamin B1 based on the intensity of each lane after background subtraction, and the ratios are shown. WCL, whole cell lysate. c, IB analysis of WCLs and IP of 293T cells transfected with indicated plasmids. d, IB analysis of Kcr by in vitro crotonylation assay. e, f, IB (e) and cell proliferation (f) of control and 3’UTR-targeted shGCDH GSC23 with or without ectopic expression of WT, NLS-tagged and NES-tagged GCDH. g, h, IB analysis of GSCs with or without GCDH (g) or CBP (h) KD. i, IB analysis of GSCs cultured in media with indicated concentrations of L-lysine and treated with or without 0.2 μM MYCi975 for 5 days. j-n, In vivo bioluminescence imaging at 4 weeks post-transplantation (j), quantification of total flux (n = 5 biologically independent mice, k), Kaplan-Meier survival curves (n = 5, l), weekly mice weight (n = 5 biologically independent mice, m) and percentages of SOX2+ CD133+ GSCs (n = 4 biologically independent mice, n) from immunodeficient mice bearing GSC23-derived intracranial tumours with MYCi975, LR diet or the combination treatment. Representative of two independent experiments for a-e and g-i. Data are presented from three independent experiments in f. In f, k, m and n, data are presented as mean ± SEM. Two-way ANOVA followed by multiple comparisons with adjusted p values for f and m, one-way ANOVA followed by multiple comparisons with adjusted p values for k and n, log-rank test for l. ns, not significant.
Fig. 5
Fig. 5. Lysine catabolism disruption stimulates anti-tumour immunity via immunogenic retrotransposons.
a, Genome-wide profiles of Kcr and H3K27ac in control and GCDH KD GSC23. b, Heatmaps of Kcr, H3K27ac and H3K9me3 ChIP-seq signals sorted by differential Kcr peaks between control and GCDH KD GSC23. 26774 peaks exhibited reduced Kcr signals upon GCDH loss were named as GCDH-dependent Kcr peaks. c, Genomic annotations of GCDH-dependent Kcr peaks by chromosome features. d, Heatmaps of Kcr and H3K27ac ChIP-seq signals within GCDH-dependent Kcr peaks in GSC23 cultured in media with indicated concentrations of L-lysine. e, Volcano plot showing transcript levels of TEs in GSCs cultured with 0.2 mM L-lysine versus 2 mM L-lysine, defined by adjusted p < 0.05 and fold change > 1.5. f, RT-qPCR analysis of representative ISGs and LTR-containing ERVs in GSC23. g, IB analysis in control and Gcdh KD GL261 with or without Cgas and Ifih1 KD. h, Kaplan-Meier survival curves of immunocompetent mice bearing GL261-derived intracranial tumours (n = 5). i, Flow cytometric analysis of CD8+ T cells (n = 4 biologically independent mice) and Granzyme B+ CD8+ T cells (n = 3 biologically independent mice) in GL261-derived intracranial tumours at day 14 post-injection. j, Kaplan-Meier survival curves of immunocompetent mice bearing GL261-derived intracranial tumours (n = 5). k, l, Representative IHC staining (k) and quantification (n = 3 biologically independent mice, l) of CD8+ T cells from indicated tumours at day 21 post-transplantation. Scale bar, 20 μm. Data are presented from three independent experiments in f. Representative of two independent experiments for g. In f, i and l, data are presented as mean ± SEM. One-way ANOVA followed by multiple comparisons with adjusted p values for f, i and l, log-rank test for h and j. ns, not significant.

Comment in

References

    1. Gimple RC, Yang K, Halbert ME, Agnihotri S & Rich JN Brain cancer stem cells: resilience through adaptive plasticity and hierarchical heterogeneity. Nat. Rev. Cancer 22, 497–514 (2022). - PubMed
    1. Wang W & Zou W Amino Acids and Their Transporters in T Cell Immunity and Cancer Therapy. Mol. Cell 80, 384–395 (2020). - PMC - PubMed
    1. Lieu EL, Nguyen T, Rhyne S & Kim J Amino acids in cancer. Exp. Mol. Med. 52, 15–30 (2020). - PMC - PubMed
    1. Olin-Sandoval V et al. Lysine harvesting is an antioxidant strategy and triggers underground polyamine metabolism. Nature 572, 249–253 (2019). - PMC - PubMed
    1. Wu Z et al. TPO-Induced Metabolic Reprogramming Drives Liver Metastasis of Colorectal Cancer CD110+ Tumor-Initiating Cells. Cell Stem Cell 17, 47–59 (2015). - PubMed

Publication types