. 2023 May;617(7962):835-841.
doi: 10.1038/s41586-023-06080-x. Epub 2023 May 17.

RNA conformational propensities determine cellular activity

Affiliations

RNA conformational propensities determine cellular activity

Megan L Ken et al. Nature. 2023 May.

Erratum in

Abstract

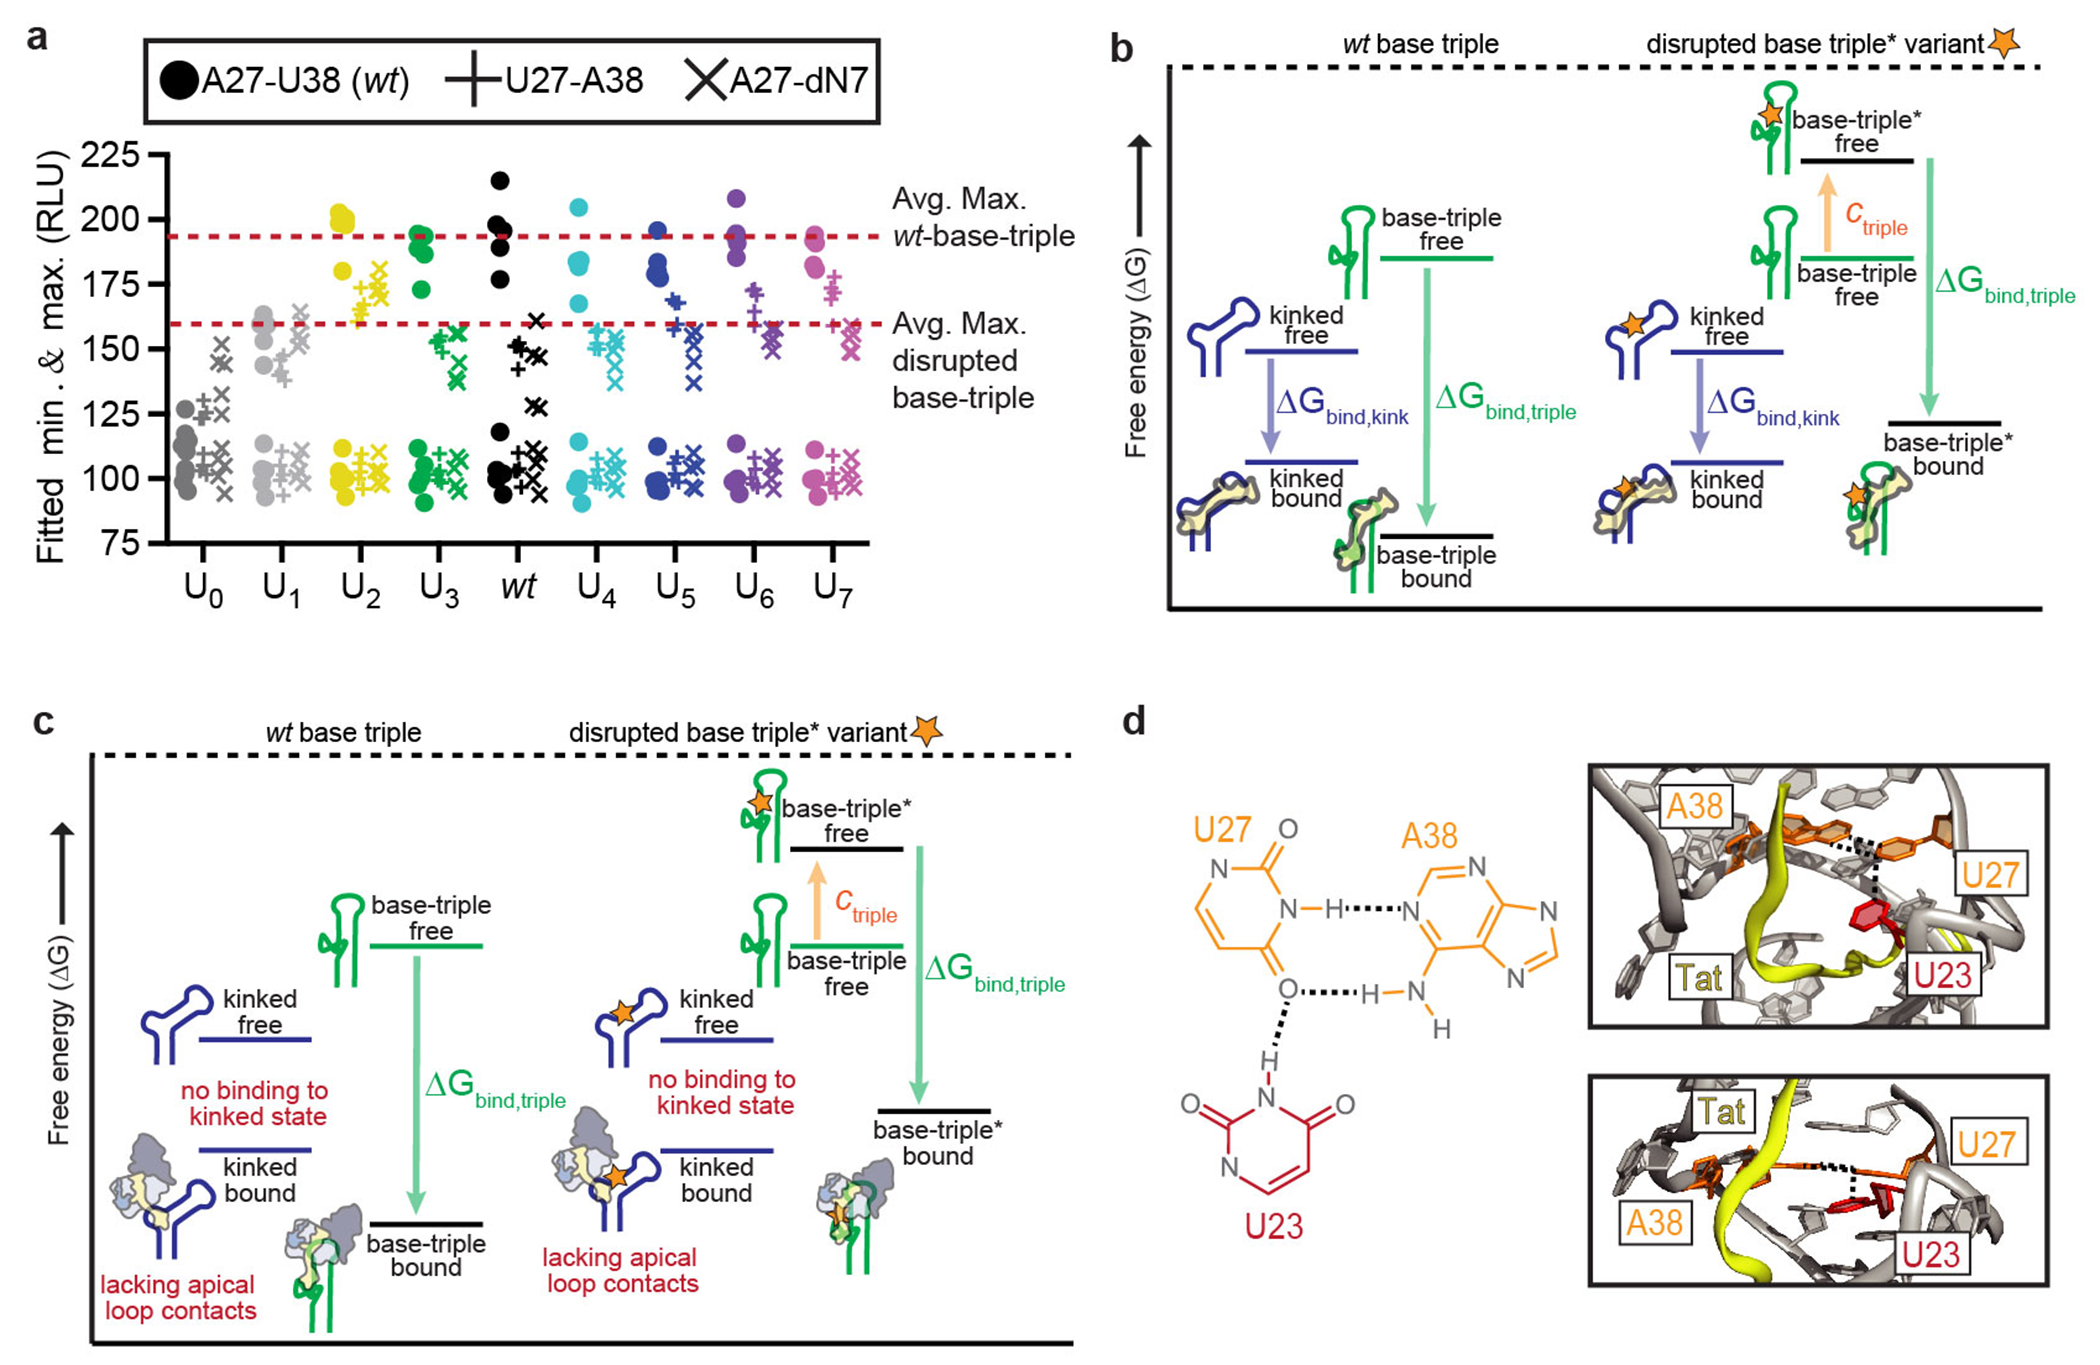
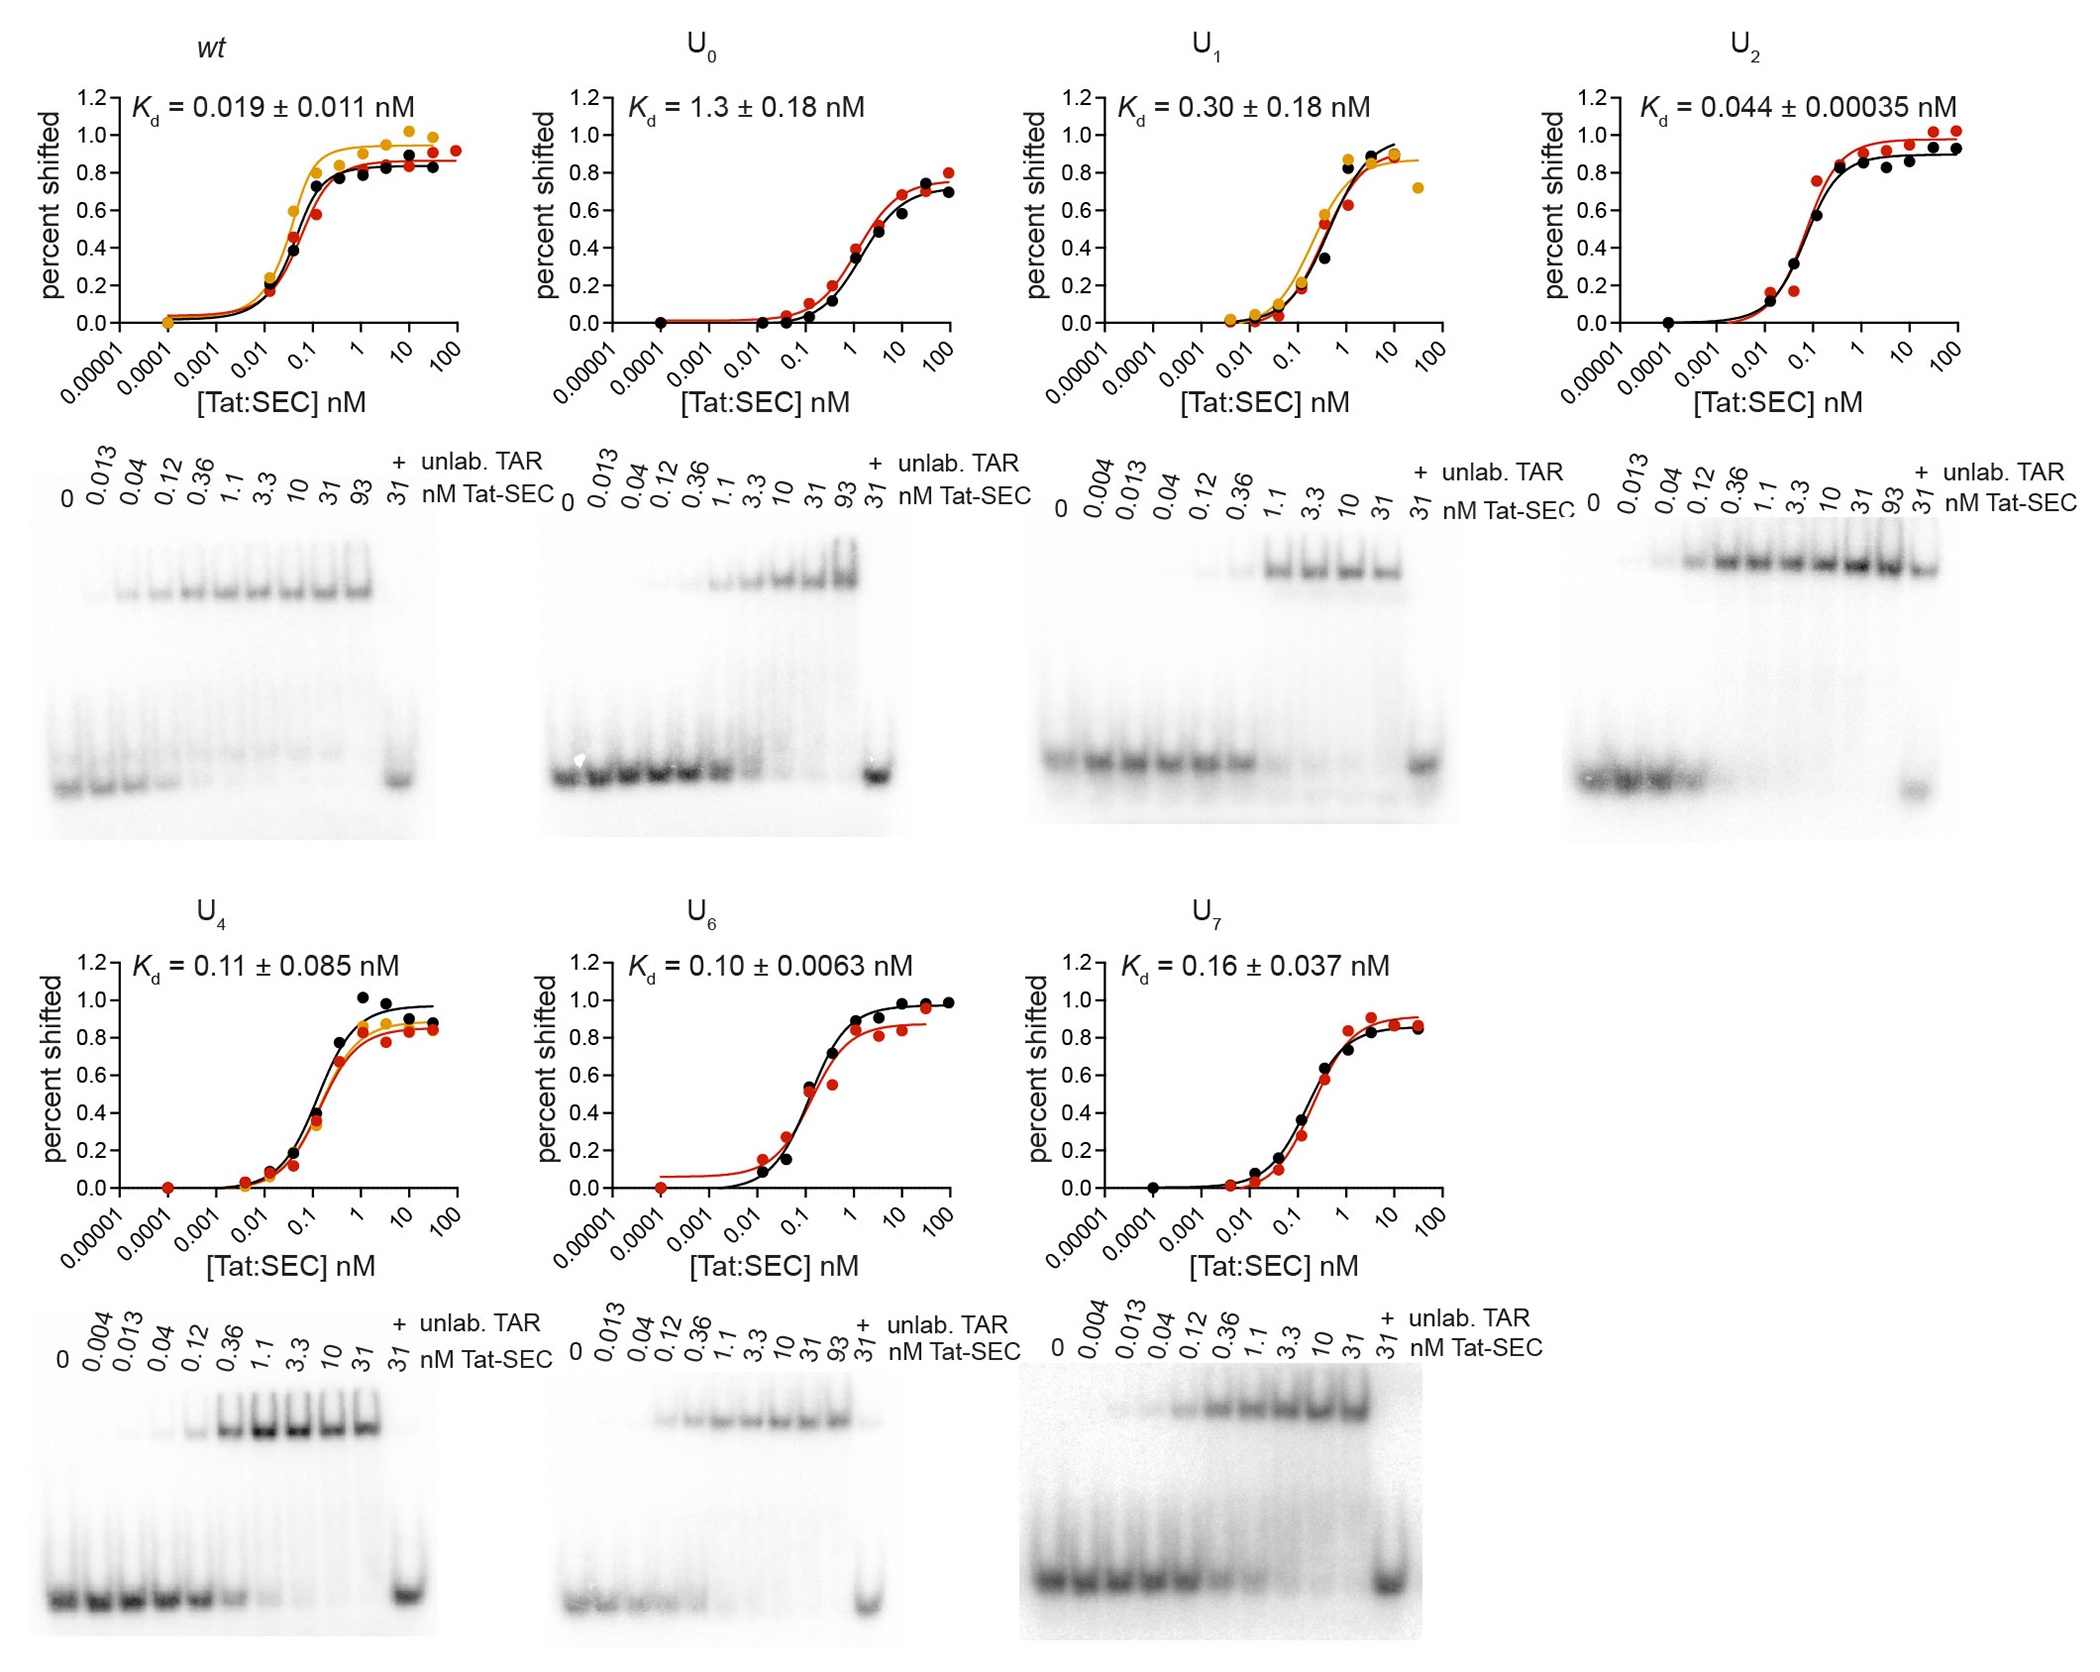
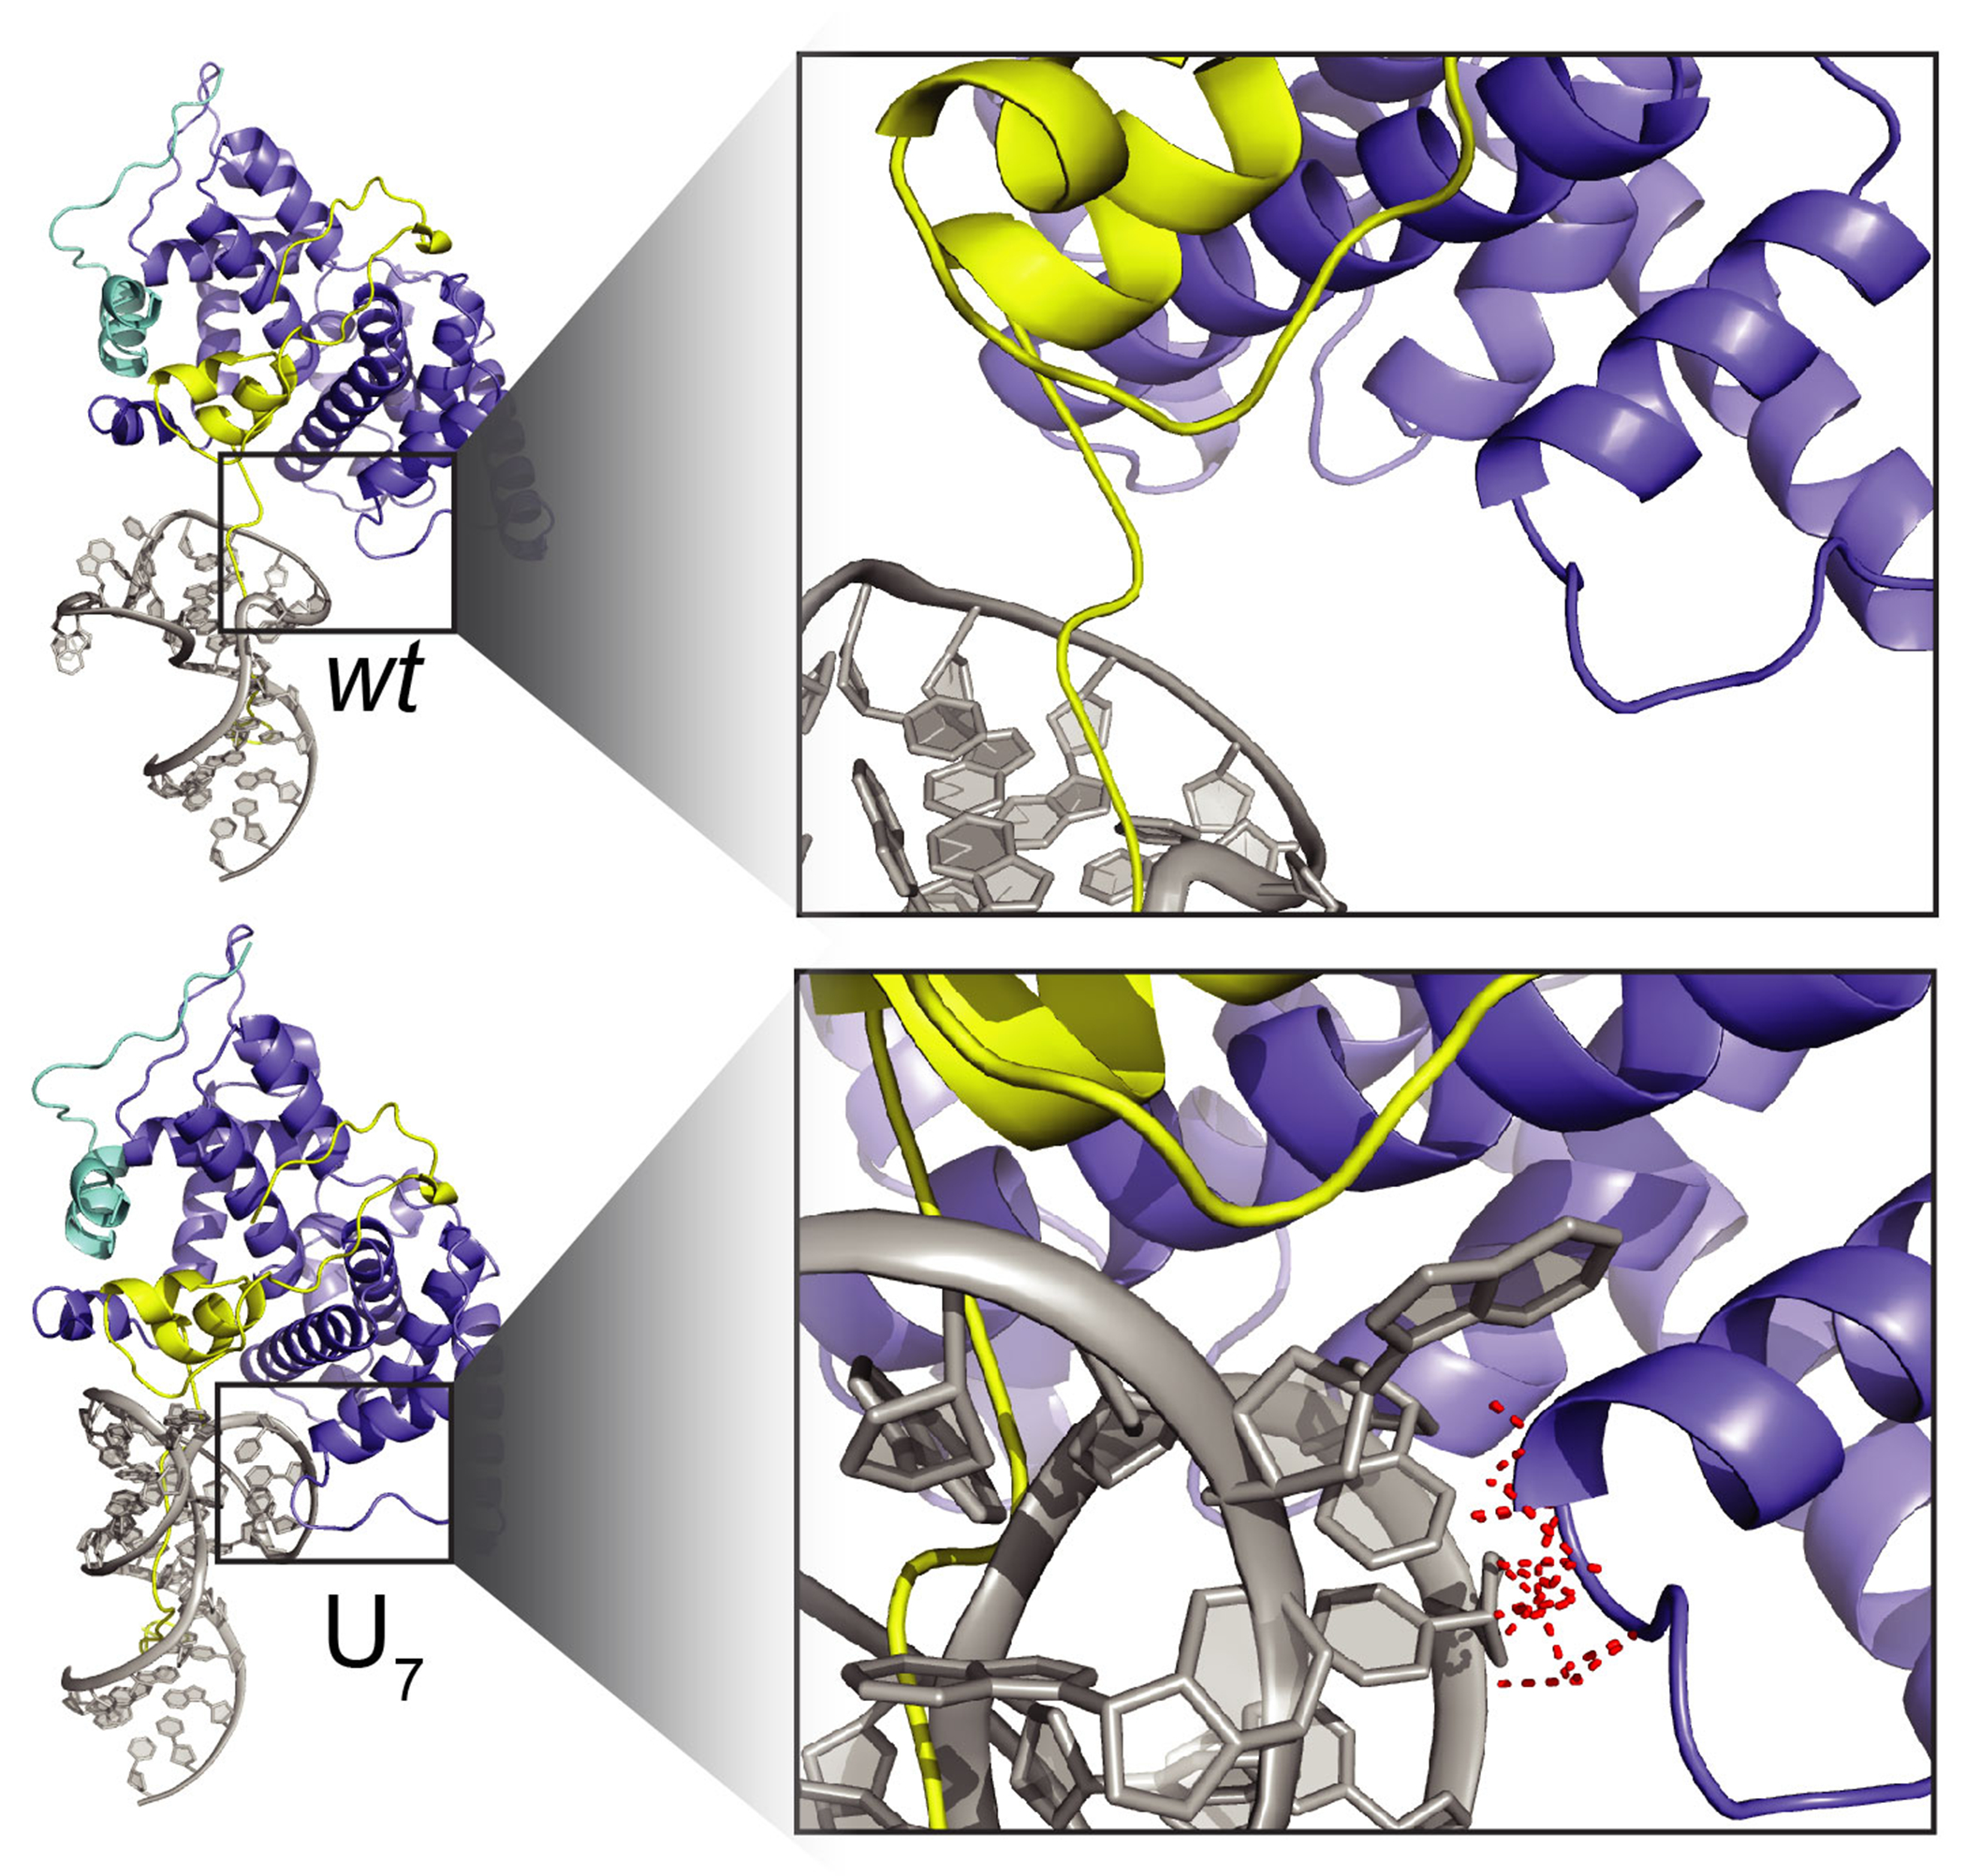
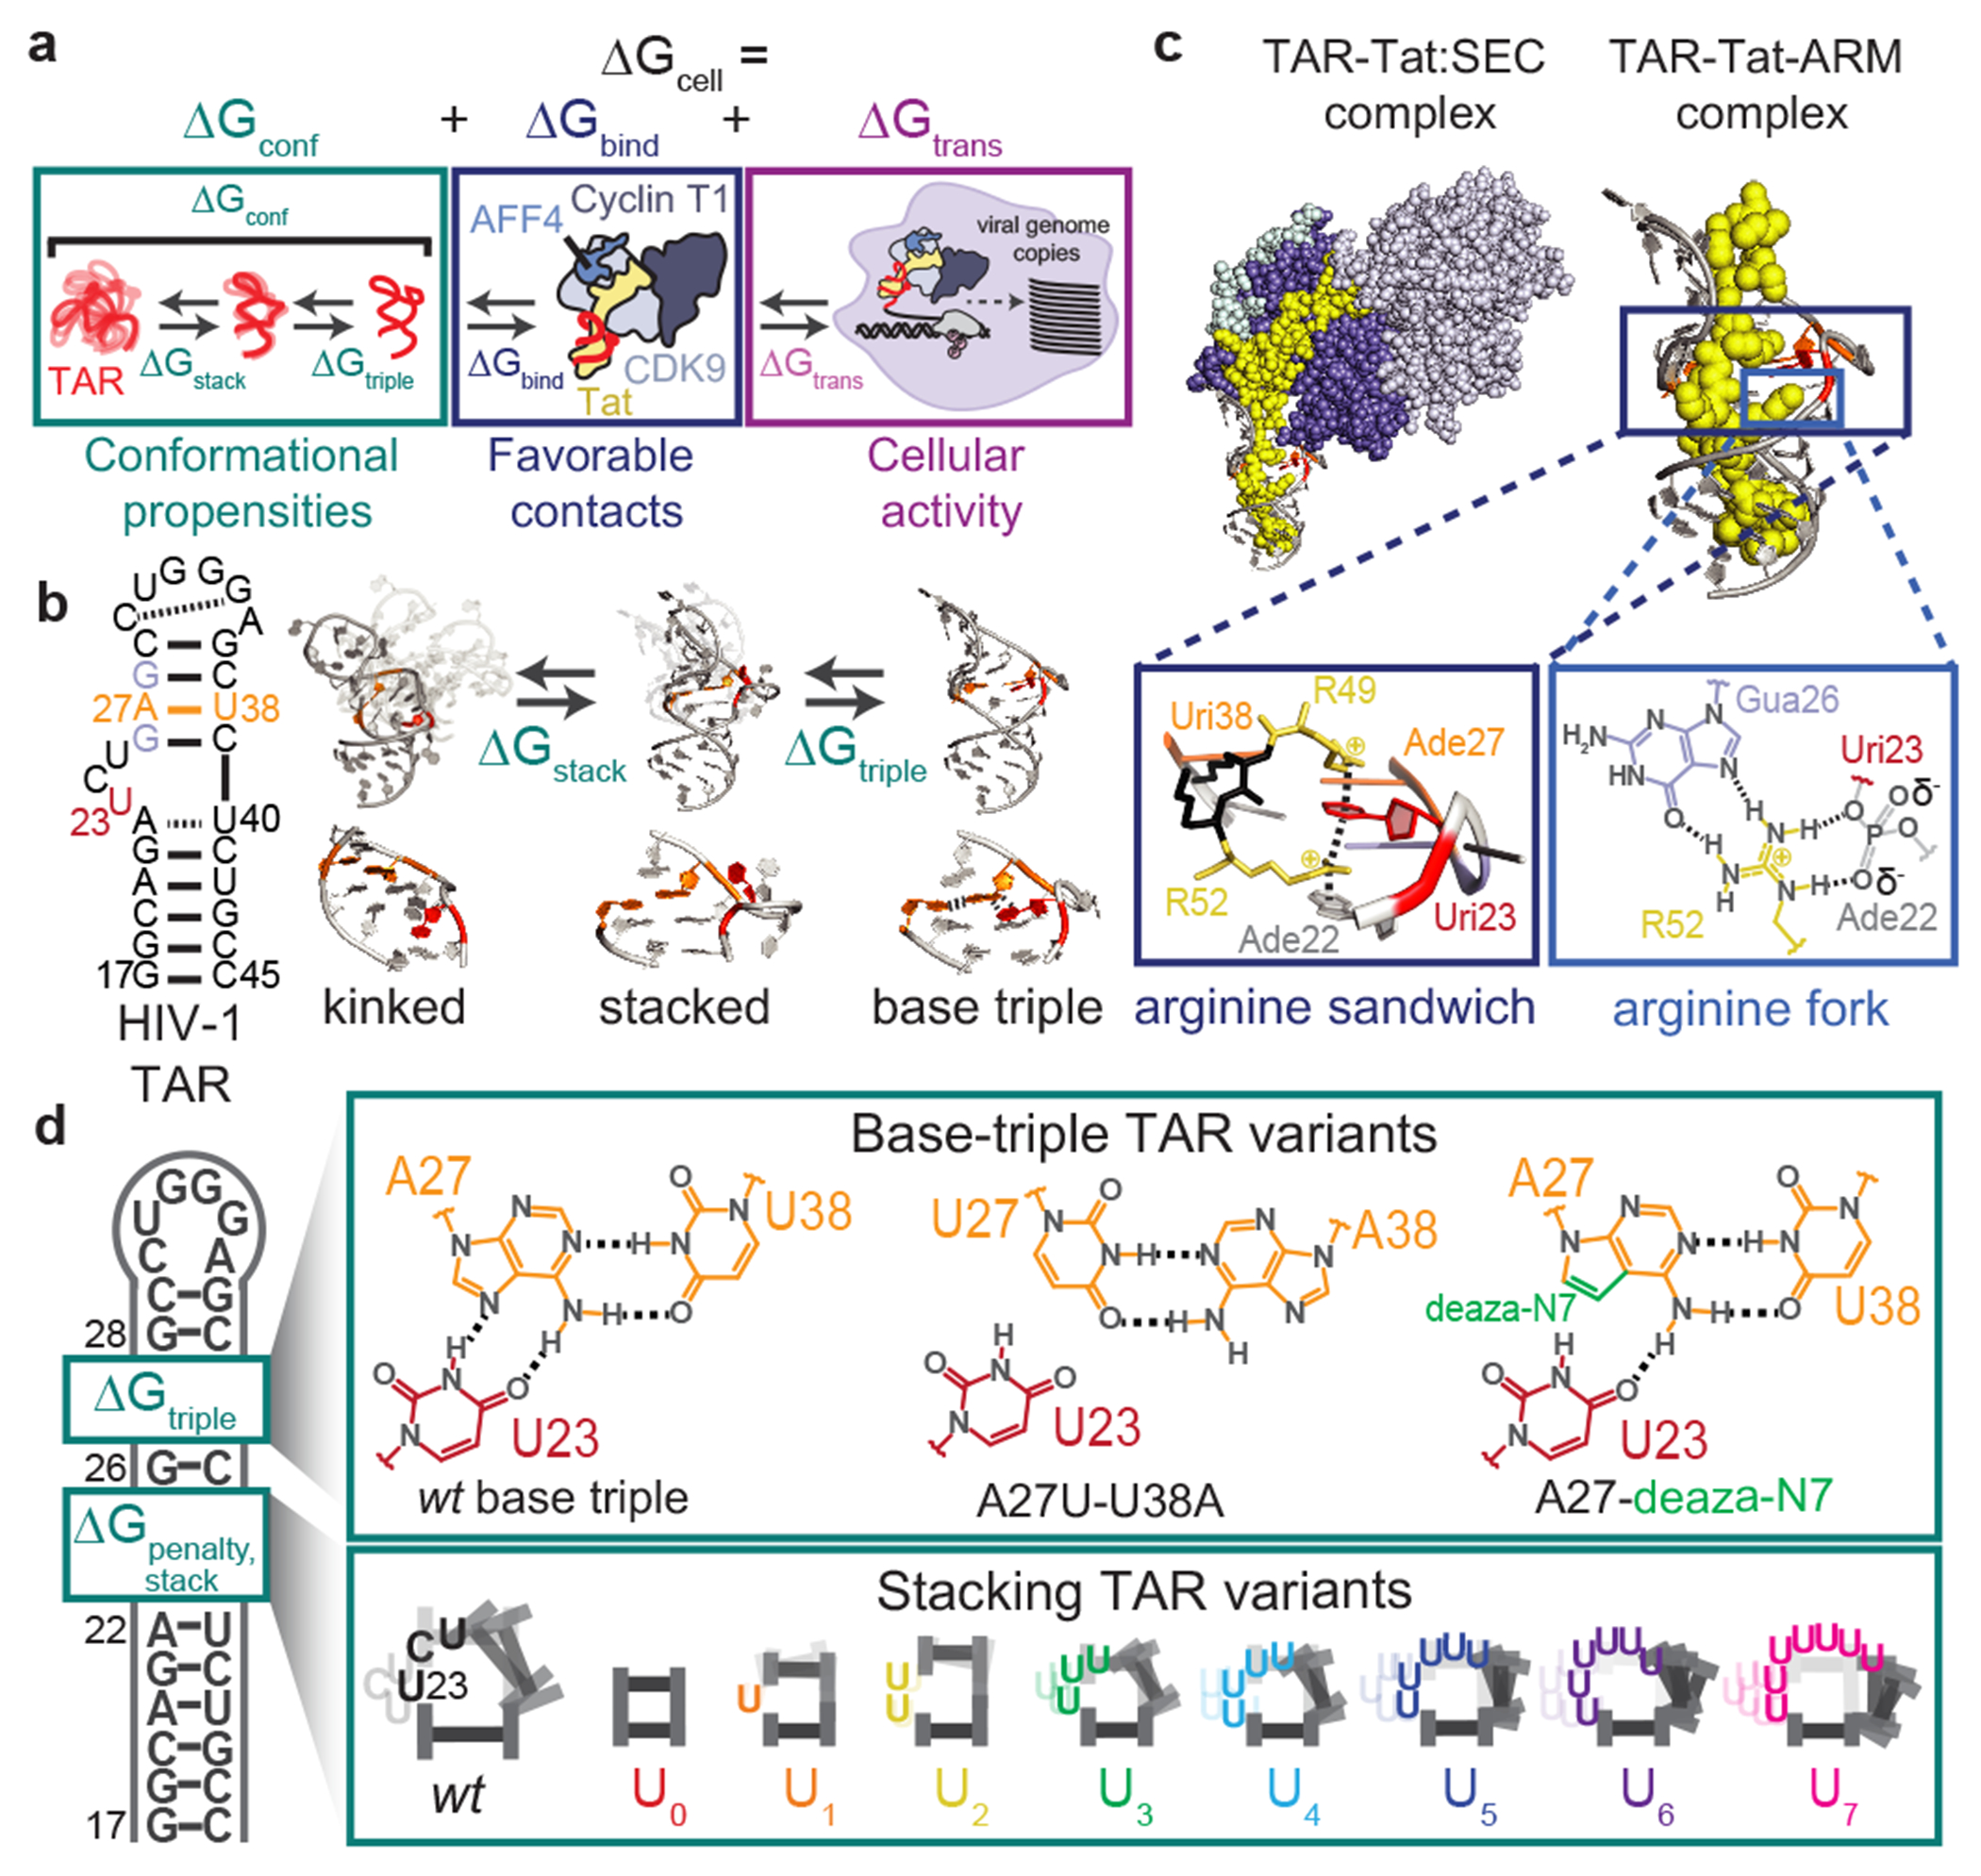
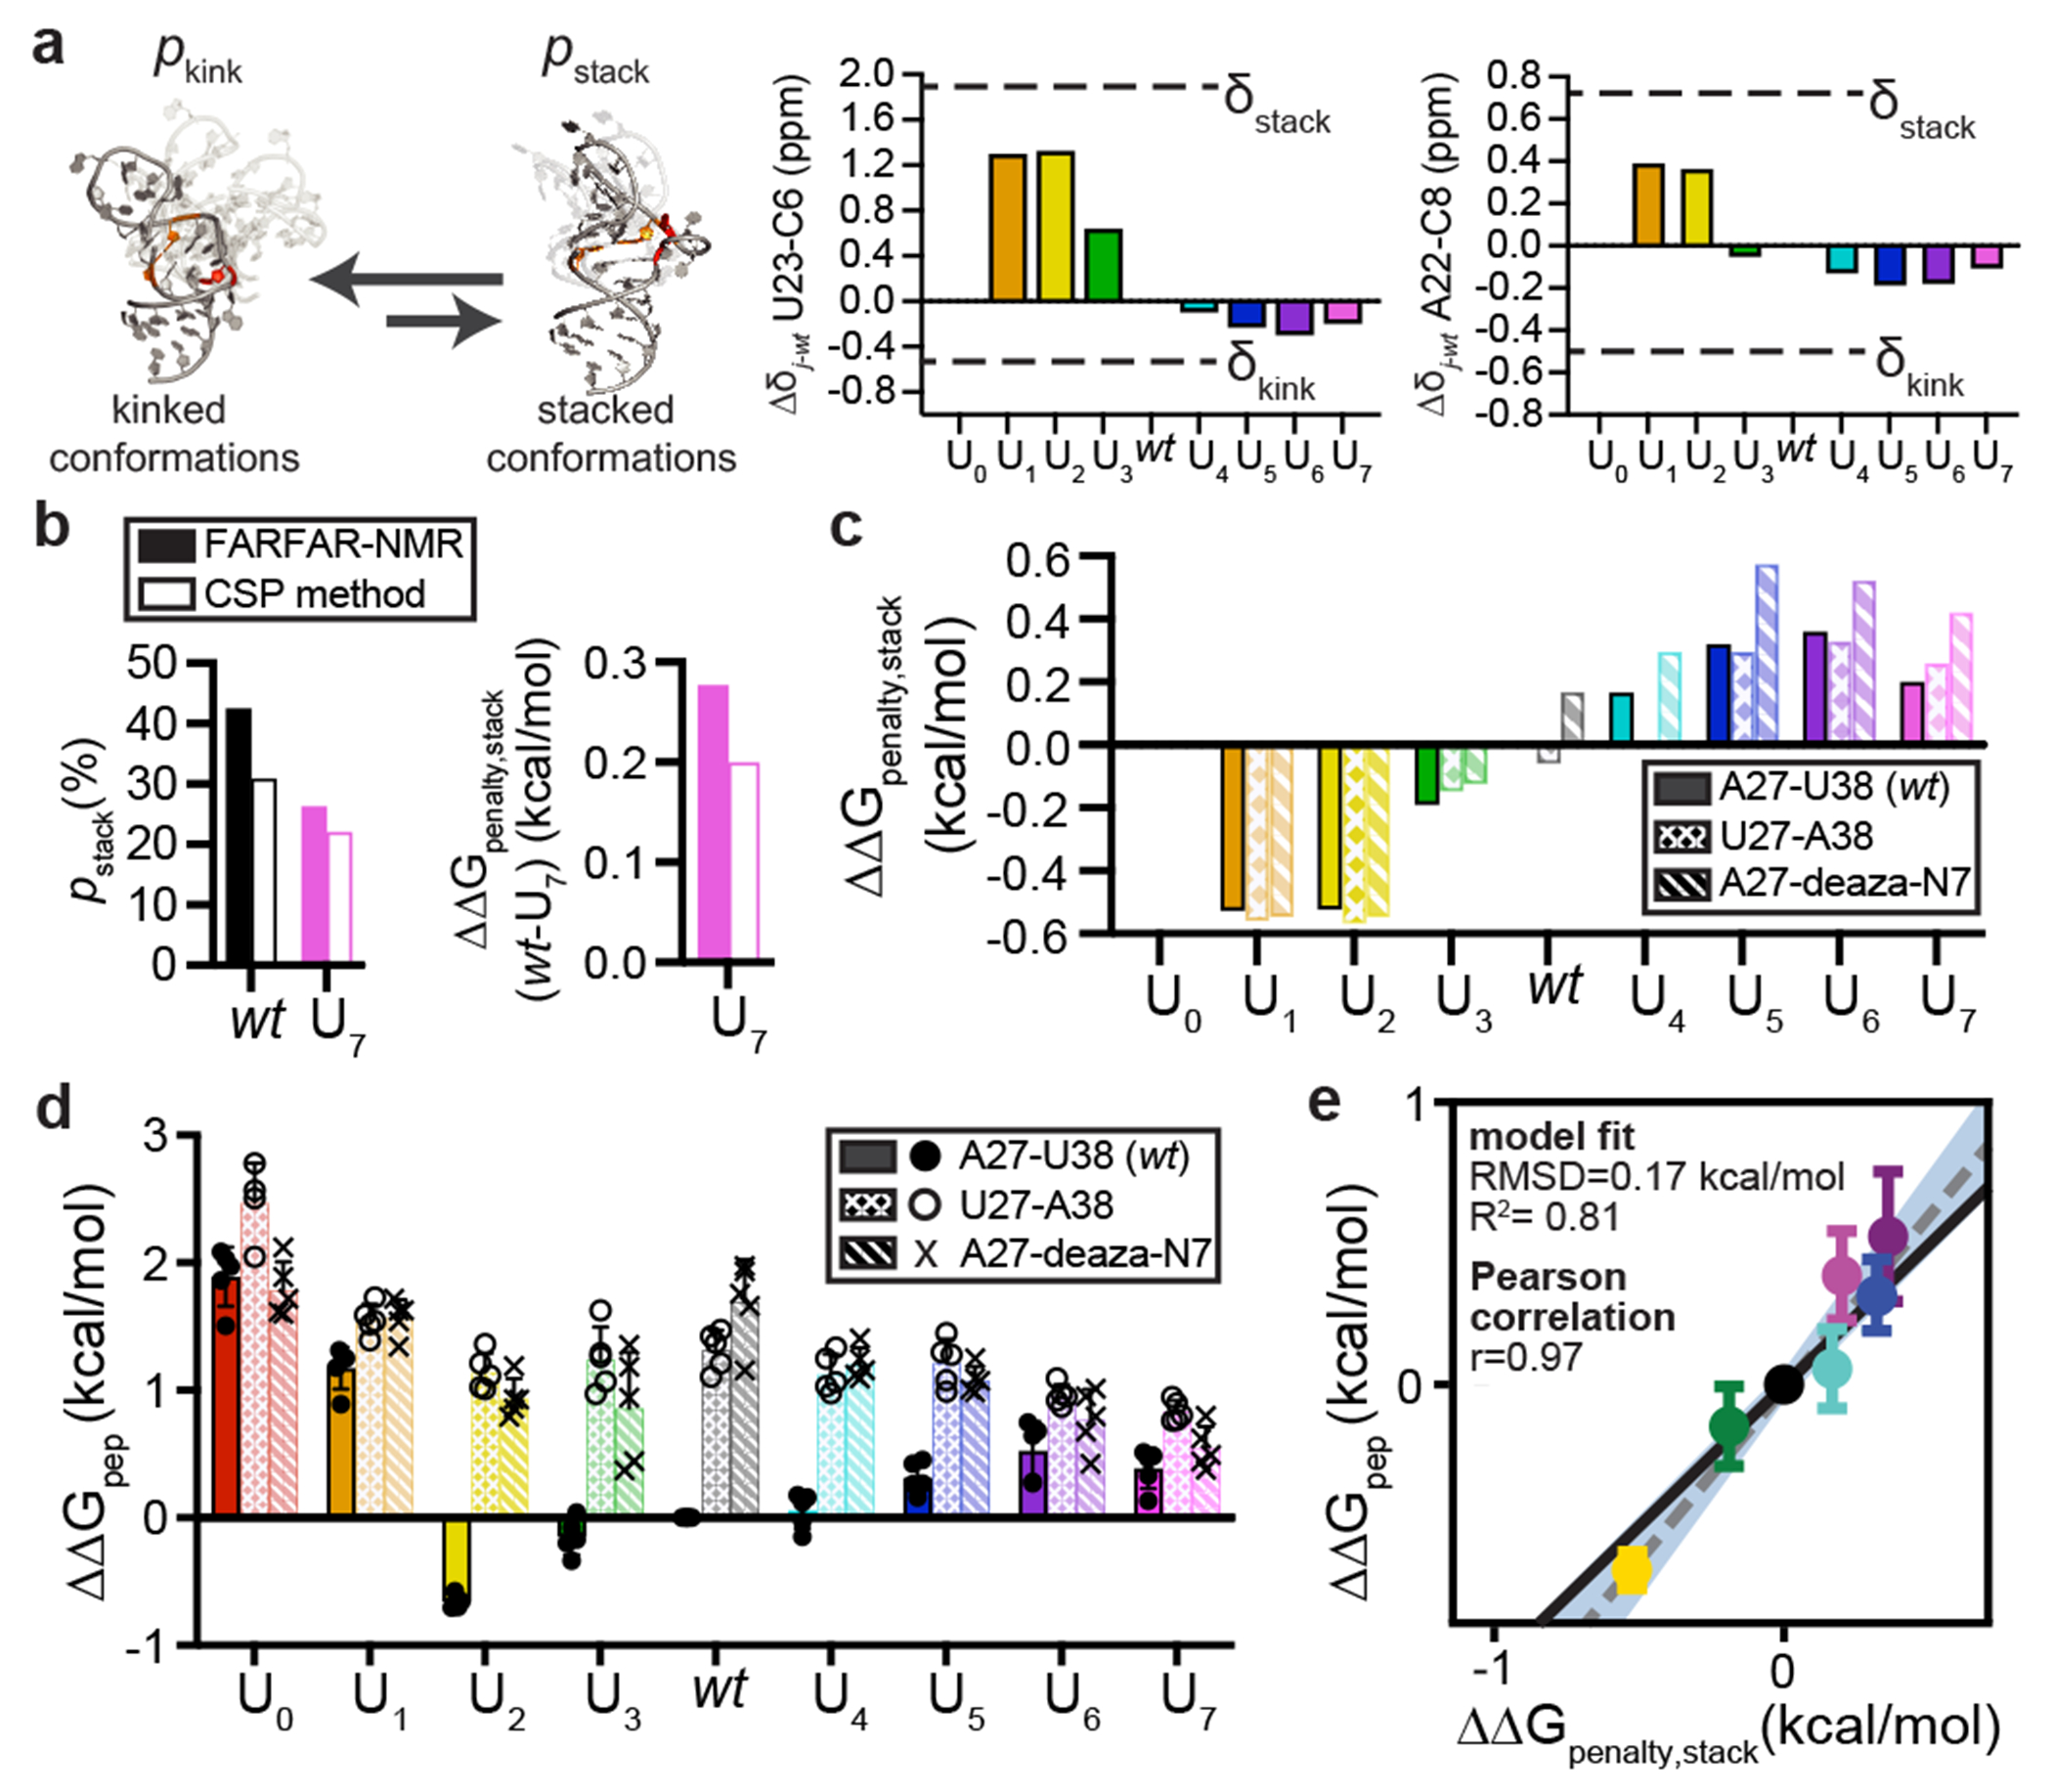
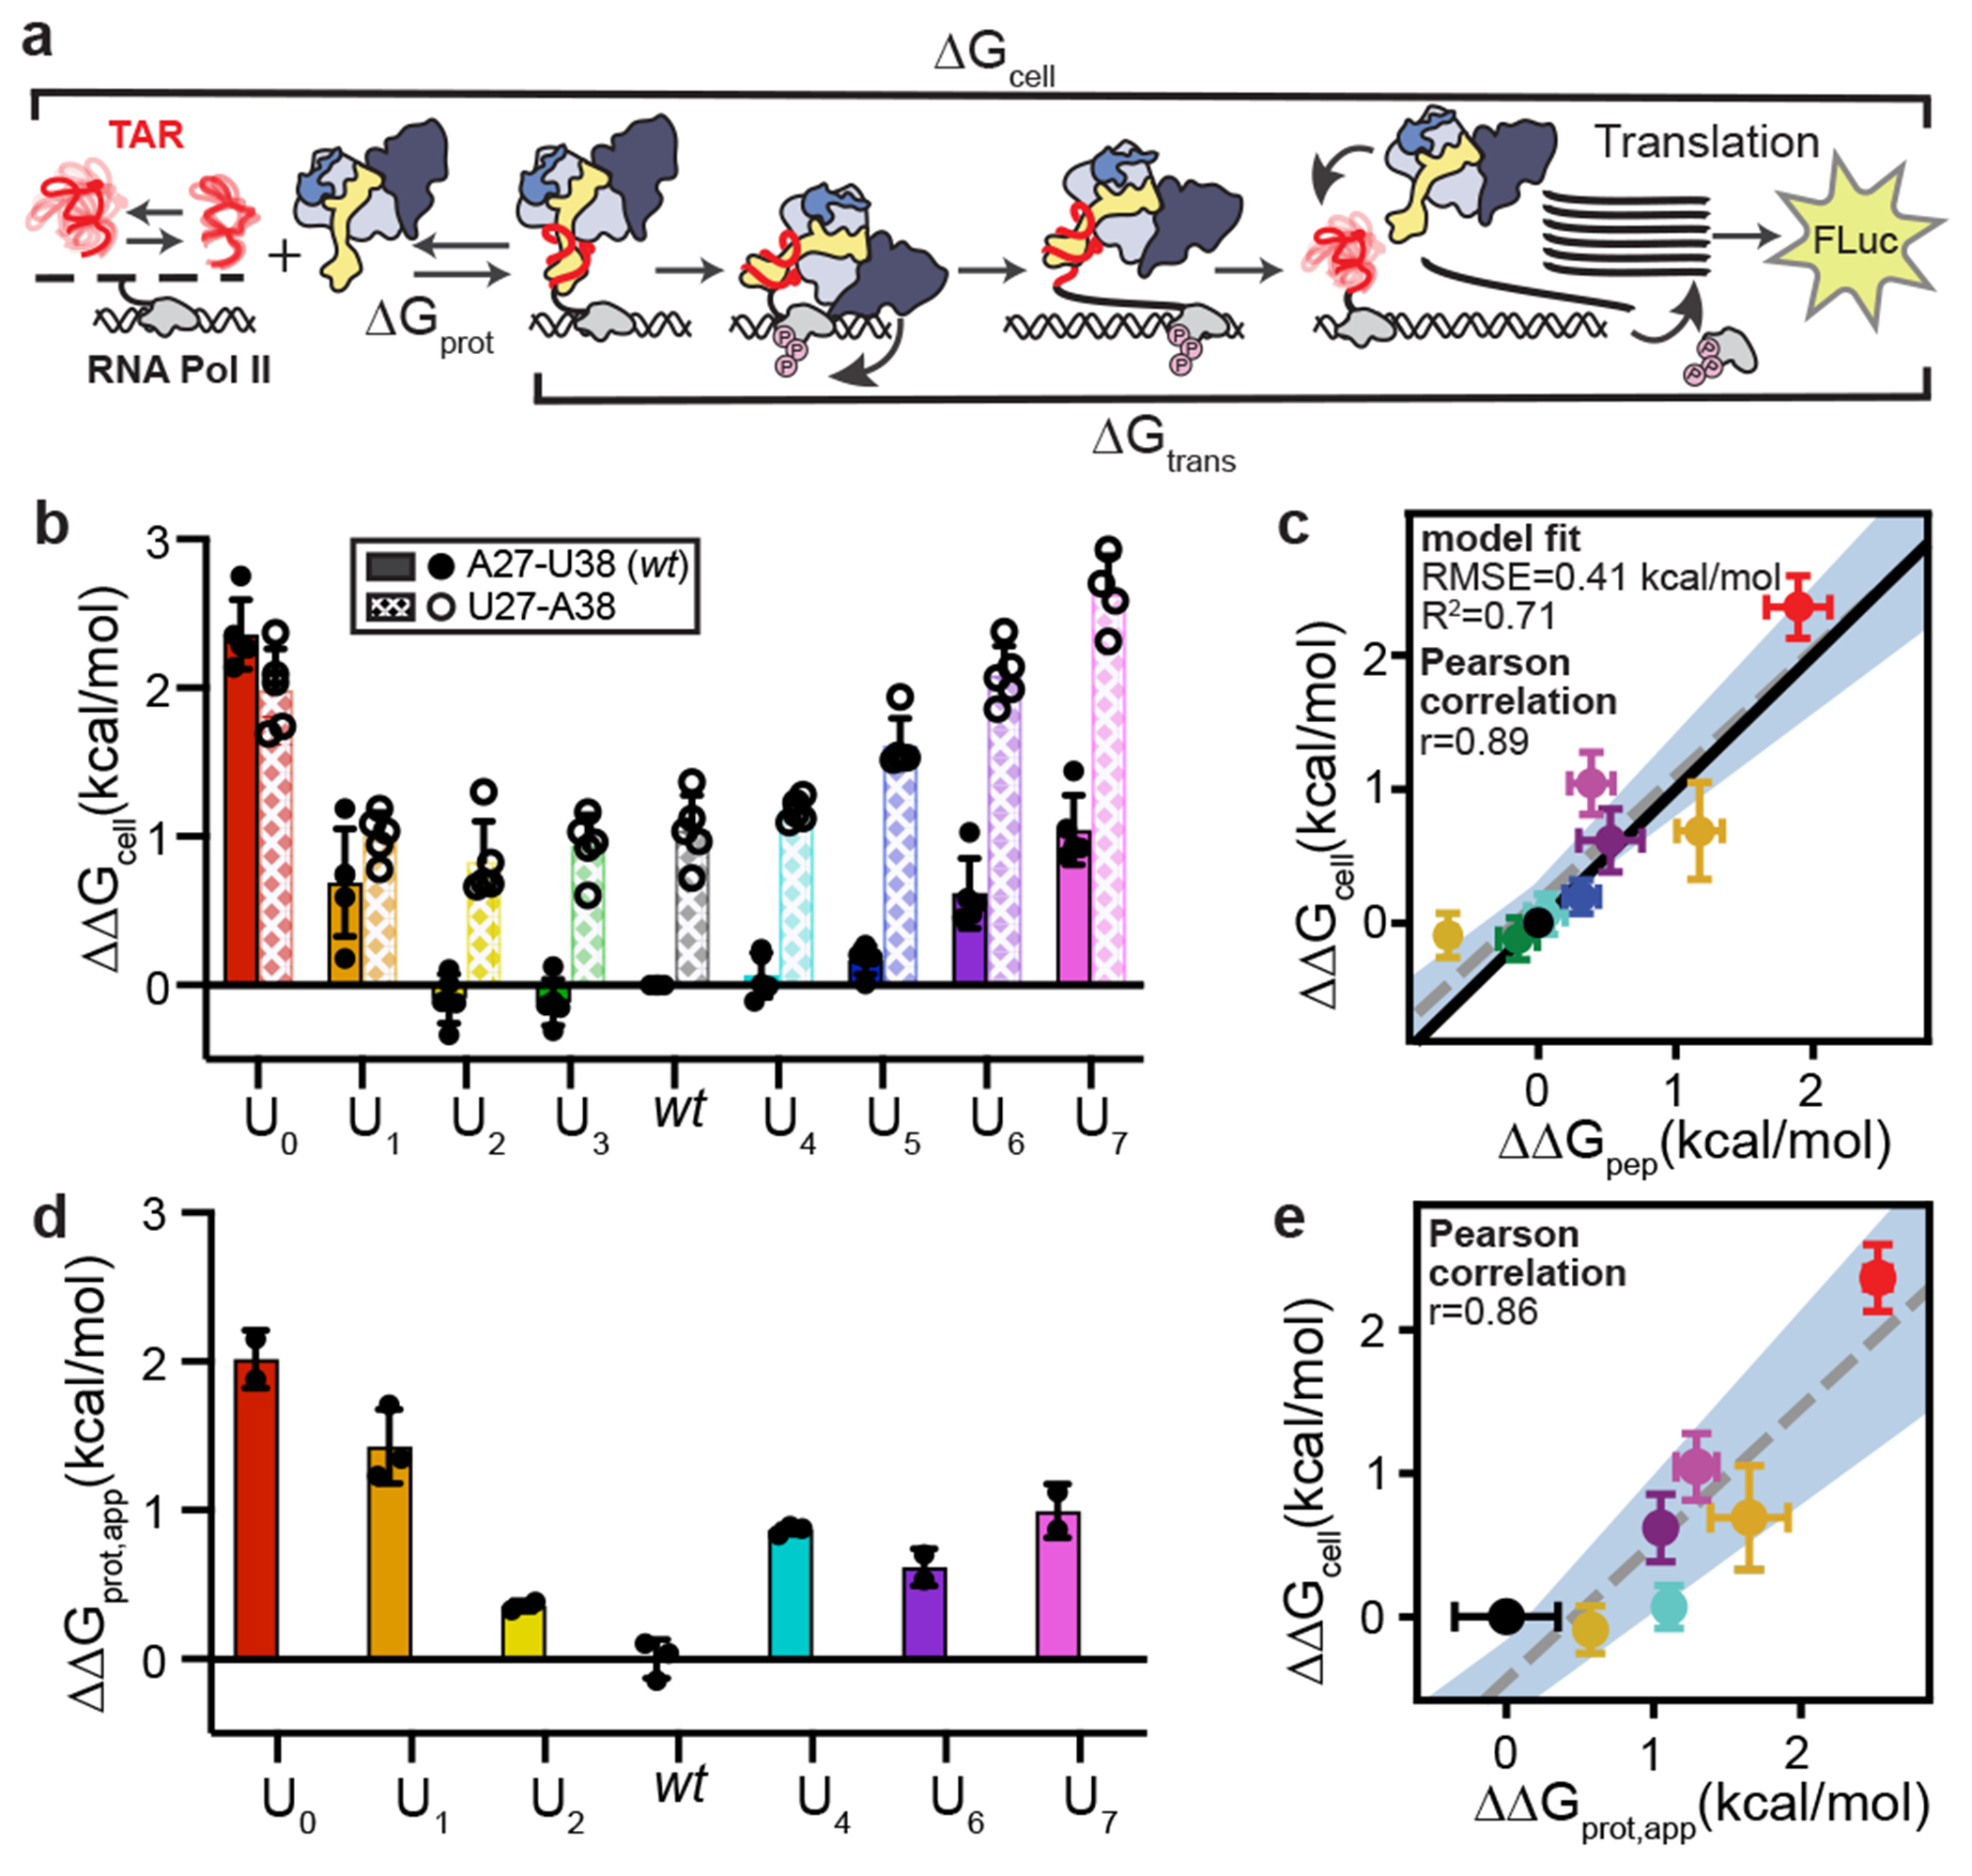
Cellular processes are the product of interactions between biomolecules, which associate to form biologically active complexes1. These interactions are mediated by intermolecular contacts, which if disrupted, lead to alterations in cell physiology. Nevertheless, the formation of intermolecular contacts nearly universally requires changes in the conformations of the interacting biomolecules. As a result, binding affinity and cellular activity crucially depend both on the strength of the contacts and on the inherent propensities to form binding-competent conformational states2,3. Thus, conformational penalties are ubiquitous in biology and must be known in order to quantitatively model binding energetics for protein and nucleic acid interactions4,5. However, conceptual and technological limitations have hindered our ability to dissect and quantitatively measure how conformational propensities affect cellular activity. Here we systematically altered and determined the propensities for forming the protein-bound conformation of HIV-1 TAR RNA. These propensities quantitatively predicted the binding affinities of TAR to the RNA-binding region of the Tat protein and predicted the extent of HIV-1 Tat-dependent transactivation in cells. Our results establish the role of ensemble-based conformational propensities in cellular activity and reveal an example of a cellular process driven by an exceptionally rare and short-lived RNA conformational state.


Conflict of interest statement

Competing interest declaration

HMA is an adviser to and holds an ownership interest in Base4, an RNA-based drug discovery company. DH is a consultant for Radial, an RNA-based drug discovery company.

Figures

Extended Data Figure 1 |
Extended Data Figure 1 |. Measurement of pstack by 2D aromatic [13C, 1H] SOFAST-HMQC44.
a, pstack (see Methods) for all TAR mutants U0-7 and wt with and without the A27U-U38A and A27-deaza-N7 base-triple disrupting mutations. b, Differences in ΔΔGpenalty,stack between the wt A27-U38 version of each bulge variant to its two corresponding base-triple disrupted variants, U27-A38 and N7-deaza-A27, are small (within +/−0.3 kcal/mol). This correspondence in stacking is indicated by the strong linear correlations observed between stacked populations for the wt base triple mutants versus their base triple disrupted counterparts, Pearson correlation (r) and line of best fit shown, where the colors correspond to the bulge length as shown in panel a. c, Sets of overlayed spectra for wt and all bulge mutants U0-7. For each, the wt base triple construct is black and the base-triple disrupting mutants are overlayed, A27U-U38A in blue and A27-deaza-N7 in green. The wt spectrum is fully assigned, for the bulge constructs the stacking reporter residues A22 and U23 are indicated.
Extended Data Figure 2 |
Extended Data Figure 2 |. NMR evidence for U-U wobbles in the U7 TAR variant.
The 1H 1D imino NMR spectrum of the U7 variant shows resonances in the 10-12 ppm region, suggesting the U-rich bulge might transiently form a short helix comprised of U-U wobble mismatches which could in turn promote stacking of the TAR helices.
Extended Data Figure 3 |
Extended Data Figure 3 |. TAR-Tat-ARM peptide binding assay.
a, Binding curves for individual TAR variants, with all five independent experiments overlayed (black: experiment 1, red: experiment 2, orange: experiment 3, yellow: experiment 4, green: experiment 5). The data points for each individual curve represent the mean fluorescence values, and the error bars represent the standard deviation, of 3 technical replicates. Each individual curve was fit to equation 1, and average Kd values +/− the standard deviation over the five independent experiments are displayed for each mutant. b, One experiment (experiment 5) of representative fluorescence binding curves for all TAR mutants overlayed. The data points for each individual curve represent the mean fluorescence values, and the error bars represent the standard deviations, of 3 technical replicates. c, Observed dissociation constants do not change as the concentration of the constant component (Tat-ARM peptide) is varied, as expected for accurate Kd measurements38. Dissociation constants were measured for wt and U2 at multiple concentrations of Tat-ARM peptide, varying 50-fold. The dissociation constants for wt and U2 remain vary < 2-fold over this range. The data points for each individual curve represent the mean fluorescence values, and the error bars represent the standard deviation, of 3 technical replicates. Each individual curve was fit to equation 1, and average Kd values +/− the standard deviation over the 1 (wt-2 nM, wt-100 nM), 2 (U2-2 nM, U2-20 nM, U2-100 nM), or 3 (wt-20 nM) independent experiments are displayed for each mutant. d, Observed dissociation constants do not change as the equilibration time is varied, as expected for accurate Kd measurements38. Shown are Kd measurements for wt at varying timepoints to demonstrate the reaction has reached equilibrium. The Kd value does not decrease with increasing incubation times, indicating the reaction has reached equilibrium at the lowest timepoint. The same assay plate was read at each time point, creating a photobleaching effect at each subsequent timepoint, which is evident in the increasing baseline values. The data points for each individual curve represent the mean fluorescence values, and the error bars represent the standard deviation, of 3 technical replicates. Each individual curve was fit to equation 1, with the resulting Kd values displayed.
Extended Data Figure 4 |
Extended Data Figure 4 |. Stacking and peptide binding energetics for wt and U2-7.
ΔΔGpep versus ΔΔGpenalty,stack for base-triple destabilized mutants, A27U-U38A (left) and A27-deaza-N7 (right), correlates poorly (Pearson correlation shown). Grey lines indicate the best fit (equation shown), and black lines indicate slope of 1, which is the prediction of the model in the absence of the base triple disrupting mutations. Error bars represent the standard deviation of 5 independent experiments measuring ΔΔGpep.
Extended Data Figure 5 |
Extended Data Figure 5 |. Energetics of base-triple disruption in Tat-ARM binding and cellular transactivation
a, Changes in fluorescence upon peptide binding is greater for base-triple competent variants than for base-triple disrupted variants. Shown are the fitted minimum and maximum fluorescence values (from equation 1, see Methods) from the TAR-Tat-ARM peptide binding assay for 5 independent experiments. Red dotted lines indicate average maximum values for the base-triple competent variants (190), and base-triple disrupted variants (155). U0-1 are shown in grey as they are unable to form the base-triple. b, Energy diagram of Tat-ARM peptide binding to base triple competent and base-triple disrupted variants. The peptide can bind a bulge-independent kinked TAR conformation lower in energy than the base-triple disrupted stacked conformation. c, Energy diagram of Tat:SEC binding to TAR in the cellular context. The favorable interactions between Cyclin T1 and the TAR apical loop are unable to form in the kinked state of TAR, and so each base-triple disrupted variant is destabilized by the same amount (ctriple) and binds its non-base triple stacked state (demarcated with an asterisk*). d, Proposed model for an alternative sheared base-triple conformation in the A27U-U38A base-triple disrupting mutants with hydrogen bonds shown as black dashed line (left). Two views of the 3D structural model for the alternative sheared base-triple conformation obtained by replacing A27 with U and U38 with A in the PDBID:6MCE U2 TAR structure (right).
Extended Data Figure 6 |
Extended Data Figure 6 |. Cellular transactivation assay.
a, Representative example of luminescence data for one biological replicate of U0-7 and wt (3 technical replicates). Shown are luminescence values for Firefly luciferase, reporting on transactivation (top), luminescence values for Renilla luciferase under control of a CMV promoter, used as a control for transfection (middle), and the ratio FLuc/RLuc to normalize for differences arising from transient transfection (bottom), with the error bars representing the standard deviations of those values over 3 technical replicates. b, Aggregate FLuc/RLuc data for all TAR mutants over 5 independent experiments (biological replicates). Mutants labelled with (*) indicate the A27U/U38A base-triple disrupting mutation. In all graphs, red data are values when Tat is co-transfected and black data are values without Tat, representing Tat-independent baseline activity. Error bars represent the standard deviation in FLuc/RLuc values over 5 biological replicates. c, Model of Tat-dependent versus Tat-independent transactivation energetics in cells. (Top) The observed level of basal transcription is likely due to many nonspecific binding interactions of the preformed SEC complex to TAR, which does not alter the conformational propensities of the TAR ensemble and has a low probability of achieving an active bound conformation leading to transactivation and transcription. (Bottom) In Tat-dependent transactivation, the presence of Tat increases the binding affinity to form the active bound state, leading to higher levels of transactivation and transcription. d, Tat plasmid titration. In this experiment, the concentration of Tat was varied for wt (black), one of the most transactivating constructs, and U0 (red), one of the least transactivating constructs. We see that for both wt and U0, the level of transactivation (FLuc/RLuc) increases with an increase in Tat, indicating that the reaction is not saturated at the level of Tat we are using (20 ng). Dots are the individual FLuc/RLuc values and error bars represent the standard deviation in these values over 3 independent experiments. e, Larger scale Tat plasmid titrations for wt and U0 covering four orders of magnitude, with the y-axis being FLuc signal normalized to the average FLuc value measured for wt at 20 ng Tat. Again, for both mutants, the level of transactivation continually increases with an increase of Tat plasmid; the value we use in our assays (20 ng, red dot) is at the low end of this spectrum. Dots represent the average, and error bars the standard deviation, of normalized FLuc luminescence values over 3 independent experiments.
Extended Data Figure 7 |
Extended Data Figure 7 |. Measurements of TAR-Tat:SEC binding using electrophoretic mobility shift assay (EMSA).
Shown are EMSA binding curves for TAR bulge mutants U0,1,2,4,6,7 and UCU along with average apparent Kd values (see Methods) for each variant, obtained by fitting data to equation 2 using GraphPad Prism (version 9.3.1). Binding curves from 2 (U0,U2,U6,U7) or 3 (wt, U1,U4) independent experiments are overlayed (black: experiment 1, red: experiment 2, orange: experiment 3). Below the binding curves for each variant is one representative EMSA gel (experiment 1) of 2 total gels (U0,U2,U6,U7) or 3 total gels (wt, U1,U4) for each variant.
Extended Data Figure 8 |
Extended Data Figure 8 |. Model of steric interaction between the U7 bulge and P-TEFb.
(Left) FARFAR models of representative base-triple conformations of wt and U7 bound to the Tat:SEC complex. (Right) Zoomed in view of the bulge interaction with P-TEFb. In dashed red lines are atom distances between bulge residues and P-TEFb that are within 2.5 Å, representing steric overlap. U7 (bottom) has multiple steric overlaps, whereas wt (top) does not.
Fig. 1:
Fig. 1:. Revealing the role of conformational propensities in HIV-1 Tat-dependent cellular transactivation.
a, Thermodynamic model of HIV-1 Tat-dependent transactivation. The energetics of cellular transactivation (ΔGcell) is decomposed into contributions from conformational penalty to redistribute the ensemble into the base-triple bound TAR conformational state (ΔGconf=RTlnpstackRTlnKtriple), binding of Tat:SEC to TAR (ΔGbind=RT lnKbind), and the several steps leading to transactivation (ΔGtrans). ΔG approximately holds for unfavorable and sub-saturating conditions (see methods for derivation of equations). b, Secondary structure of HIV-1 TAR, FARFAR models of the bent and stacked ensembles (see Methods), and base triple conformation (PDB entry 6MCE) with close-ups of the base-triple-forming component conformations below. c, TAR-Tat:SEC complex (modelled using PDB entries 6CYT and 6MCE), TAR-Tat-ARM peptide, and critical contacts between TAR and the Tat arginine rich motif (Tat-ARM). Tat arginine residues R49 and R52 (yellow) form cation-pi interactions (dashed lines) with TAR bases U23 (red) and A22 (grey), with R52 forming a A22/R52/U23 arginine sandwich motif. R52 also forms an arginine fork involving hydrogens bonds (dashed lines) between the guanidinium group and the base of G26 (purple) as well as bridging and non-bridging phosphate groups,. d, Library of TAR variants with two types of mutations which incrementally increase ΔGpenalty,stack through replacement of the wt UCU bulge with increasingly longer uridine bulges (U0U7) or increase ΔGtriple through replacement of A27-U38 with either U27-A38 or deaza-N7 modified A27. Dotted black lines indicate hydrogen bonds in c and d.
Fig. 2:
Fig. 2:. Differences in stacking propensities predict differences in TAR-Tat-ARM binding.
a, TAR exists in dynamic equilibrium between populations of kinked (pkink) and stacked (pstack) inter-helical conformations. ΔGpenalty,stack is the free energy cost to redistribute the unbound TAR ensemble to the stacked state (see Methods). Chemical shift perturbations at reporter resonances U23-C6 and A22-C8 are used to measure pstack (Uncertainty in the 13C chemical shifts are <1% and the chemical shift derived stacked populations <0.02%). b, Comparison of pstack and ΔΔGpenalty,stack(wtU7) deduced using FARFAR-NMR and NMR CSPs (see Methods). c, Differences in stacking propensities (ΔΔGpenalty,stack, referenced to wt) for the bulge variants with (solid bars) and without the base triple destabilizing A27-deaza-N7 and A27U-U38A mutations (stippled bars) obtained from NMR CSPs. Absolute values of ΔΔGpenalty,stack are given in Supplementary Table 2. d, Differences between the Tat-ARM binding energetics (ΔΔGpep, referenced to wt) for TAR bulge variants with and without the A27-deaza-N7 and A27U-U38A base-triple destabilizing mutations. Bar height represents the mean and error bars represent standard deviations for 5 independent experiments. e, Comparison between ΔΔGpep and ΔΔGpenalty,stack relative to wt, for base-triple forming constructs, with Pearson correlation shown. The black line of slope one indicates predictions from our model. Shown is the fit to this model (RMSE and R2), as well as the best fit line (dotted, grey) with the region encompassing the 95% confidence intervals for slope and y-intercept shaded in blue. Each data point represents the measured ΔΔGpenalty,stack value (x-axis), and average ΔΔGpep (y-axis) values. Vertical error bars represent the standard deviation in ΔΔGpep measurements over 5 independent experiments.
Fig. 3:
Fig. 3:. TAR-Tat-ARM binding predicts differences in Tat-dependent cellular transactivation.
a, Transcriptional activation is a multi-step cellular process which is initiated by binding of the Tat:SEC complex to TAR. The cyclin-dependent kinase 9 (Cdk9) in this complex is then activated, which in turn phosphorylates negative (NELF) and positive (C-terminal domain of RNAP II and Spt5) elongation factors to increase the processivity of RNAPII and activate transcription of the retroviral genome. The energetics of Tat-dependent cellular transactivation (ΔGcell) can be decomposed into the conformational penalty of assuming the bound state, mutation sensitive TAR binding to Tat:SEC (ΔGprot,app ), and contributions from other transactivation steps (ΔGtrans) assumed to be unaffected by the mutations in our TAR library. b, Differences between cellular transactivation (ΔΔGcell, referenced to wt) for the bulge variants with (stippled) and without (solid) the base triple destabilizing A27U-U38A mutation. Bar height represents the mean and error bars represent standard deviation for 5 biologically independent experiments. c, Comparison between ΔΔGcell and ΔΔGpep for bulge variants U07 without the base-triple destabilizing mutation, Pearson correlation shown. The black line indicates the prediction from our model. Shown is the fit to this model (RMSE and R2), as well as the best-fit line (dotted, grey) with the region encompassing the 95% confidence intervals for slope and y-intercept shaded in blue. Each data point represents the average ΔΔGpep (x-axis) and ΔΔGcell (y-axis) values, and error bars represent the standard deviation in ΔΔGpep and ΔΔGcell, each over 5 independent experiments. d, Differences in the apparent Tat:SEC binding energetics (ΔΔGprot,app, referenced to wt) for the TAR variants. Bar height represents the mean and error bars represent standard deviation over 2 (U0,U2,U6,U7) or 3 (wt, U1,U4) independent experiments. e, Comparison between ΔΔGcell and ΔΔGprot,app across the TAR variants, Pearson correlation shown. The line of best fit is grey and dotted with the region encompassing the 95% confidence intervals for slope and y-intercept shaded in blue. Each data point represents the average ΔΔGpep (x-axis) and ΔΔGcell (y-axis) values. Error bars represent the standard deviation in ΔΔGprot,app over 2 (U0,U2,U6,U7) or 3 (wt, U1,U4) independent experiments, and the standard deviation in ΔΔGcell over 5 independent experiments.
Fig. 4:
Fig. 4:. The role of conformational propensities in Tat-dependent cellular transactivation.
a, Differences in transactivation for wt and U2-7 variants with the wt-base triple intact (j) and with the A27U-U38A base-triple destabilizing mutation (j*), with dots representing the average value and the errors bars representing the standard deviation. Orange dashed line is the value of ΔΔGj*j predicted by the model (~1.2 kcal/mol) *), with dots representing the average value and the errors bars representing the standard deviation for 5 independent experiments. b, Comparison of ΔΔGcell measured in cells with ΔΔGpep, and ΔΔGpenalty,stack measured in vitro for the base-triple forming variants. Dots represent the average value and errors bars represent the standard deviation for 5 independent experiments in the case of ΔΔGcell and ΔΔGpep, and one NMR chemical shift experiment in the case of ΔΔGpenalty,stack c, Schematic illustrating how conformational propensities shape cellular activity using Tat-dependent transactivation as an example. Increasing or decreasing the conformational propensities to form the RNA conformations bound in the active complex results in corresponding increases or decreases in cellular activity.

References

    1. Ganser LR, Kelly ML, Herschlag D & Al-Hashimi HM The roles of structural dynamics in the cellular functions of RNAs. Nat. Rev. Mol. Cell Biol 20, 474–489 (2019). - PMC - PubMed
    1. Fischer M, Coleman RG, Fraser JS & Shoichet BK Incorporation of protein flexibility and conformational energy penalties in docking screens to improve ligand discovery. Nat. Chem 6, 575–583 (2014). - PMC - PubMed
    1. Parvin JD, Mc Cormick RJ, Sharp PA & Fisher DE Pre-bending of a promoter sequence enhances affinity for the TATA-binding factor. Nature 373, 727 (1995). - PubMed
    1. Denny SK et al. High-Throughput Investigation of Diverse Junction Elements in RNA Tertiary Folding. Cell 174, 377–390.e20 (2018). - PMC - PubMed
    1. Afek A et al. DNA mismatches reveal conformational penalties in protein–DNA recognition. Nat. 2020 5877833 587, 291–296 (2020). - PMC - PubMed

Publication types

MeSH terms

Substances