. 2023 Jun;618(7966):774-781.
doi: 10.1038/s41586-023-06079-4. Epub 2023 May 17.

Polygenic scoring accuracy varies across the genetic ancestry continuum

Affiliations

Polygenic scoring accuracy varies across the genetic ancestry continuum

Yi Ding et al. Nature. 2023 Jun.

Abstract

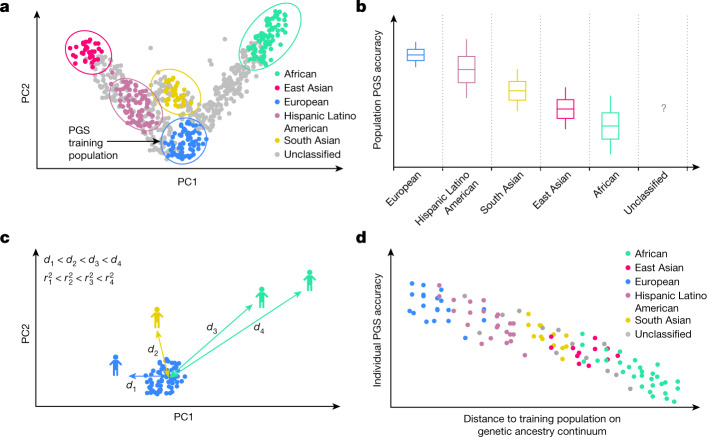
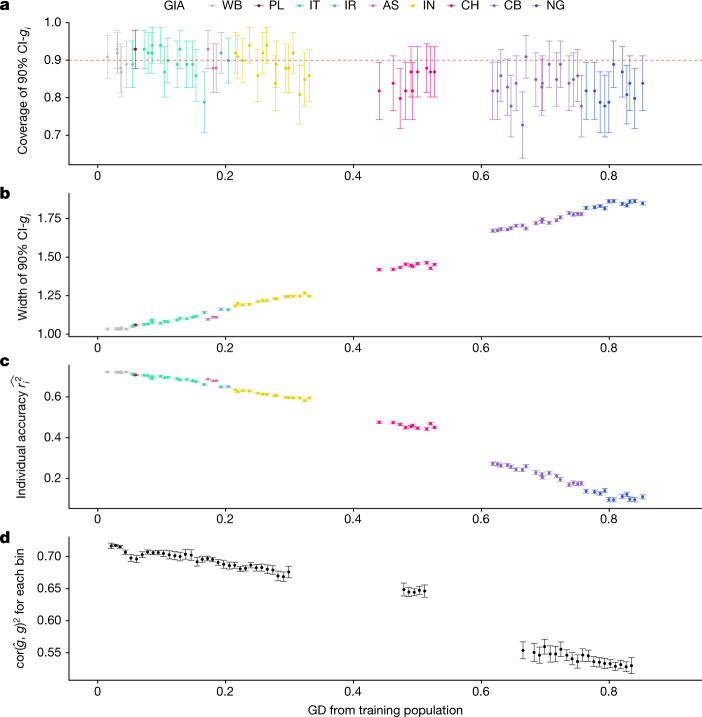
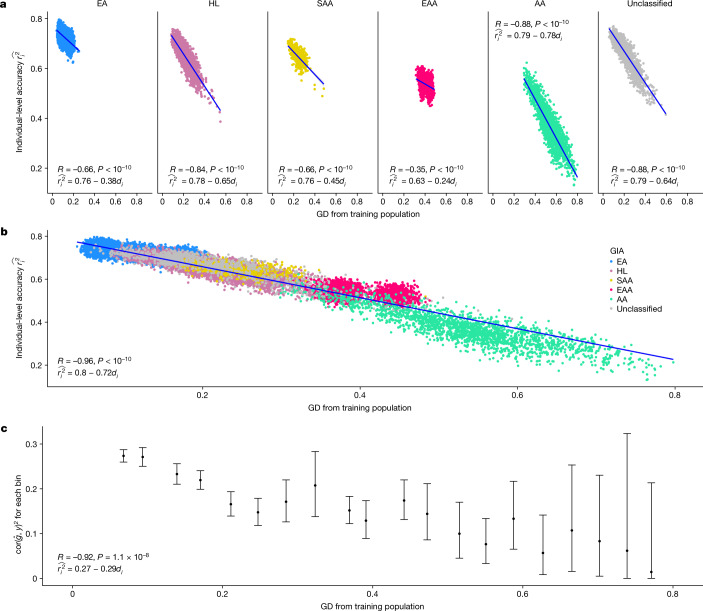
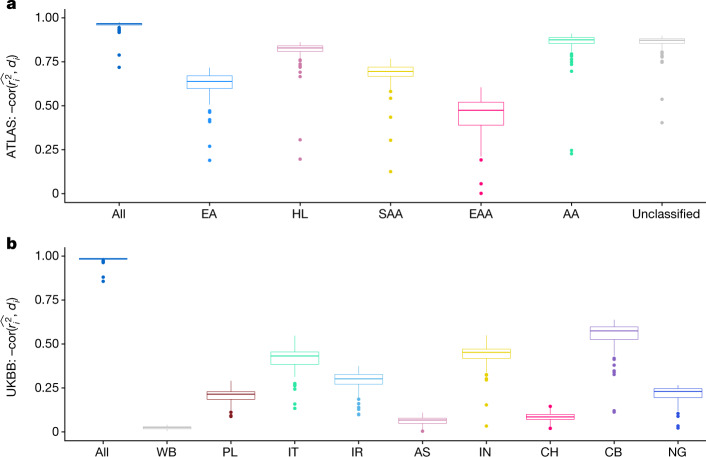
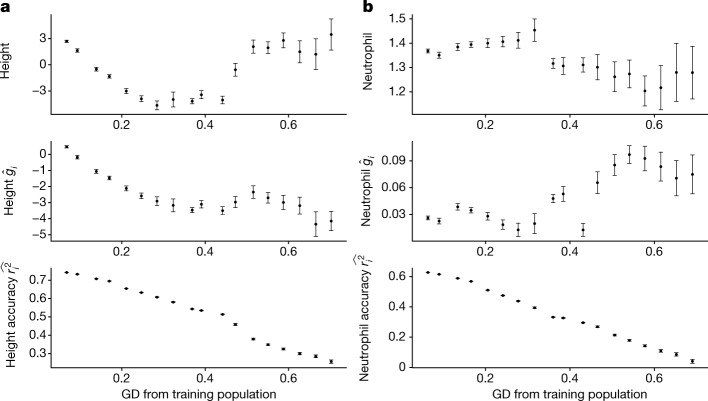
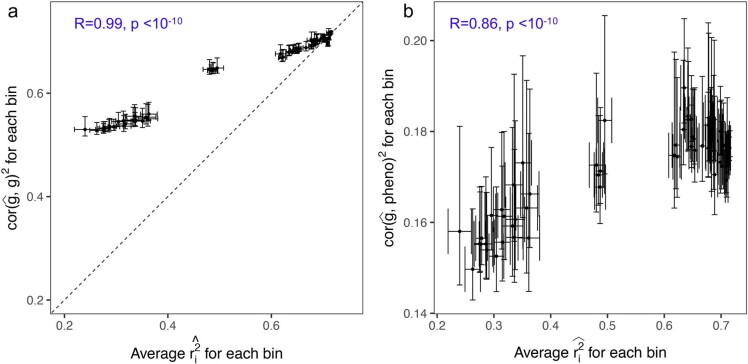
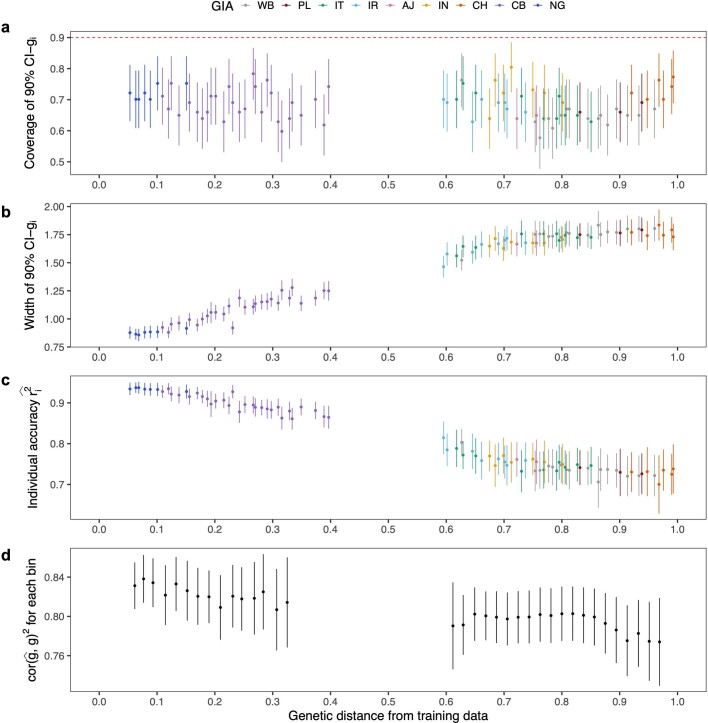
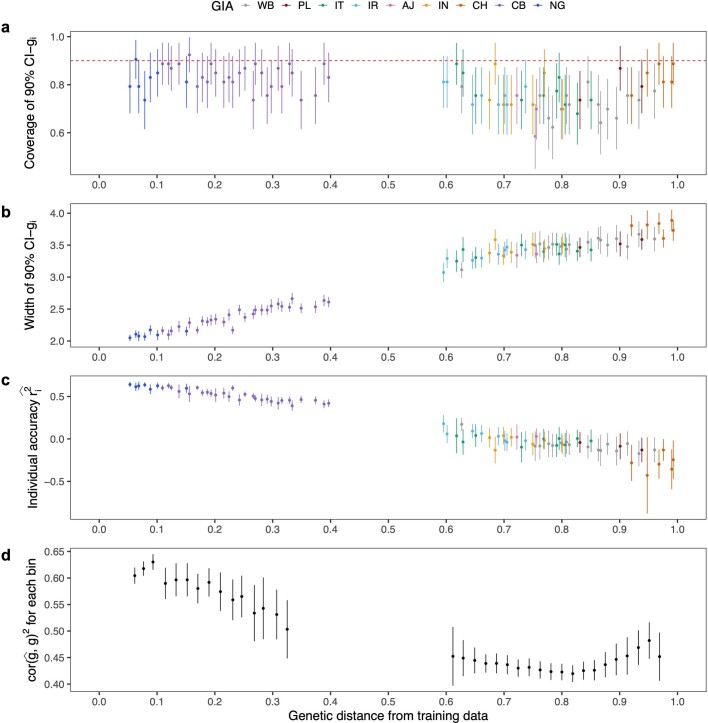
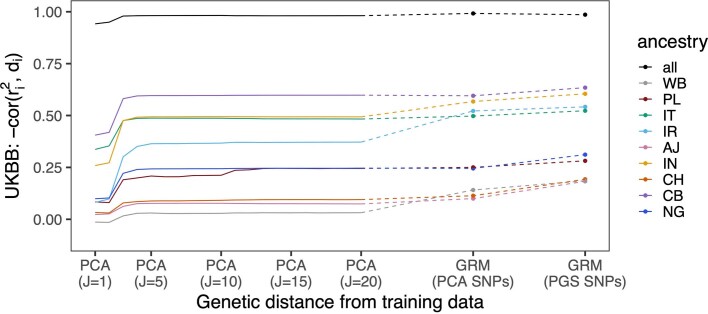
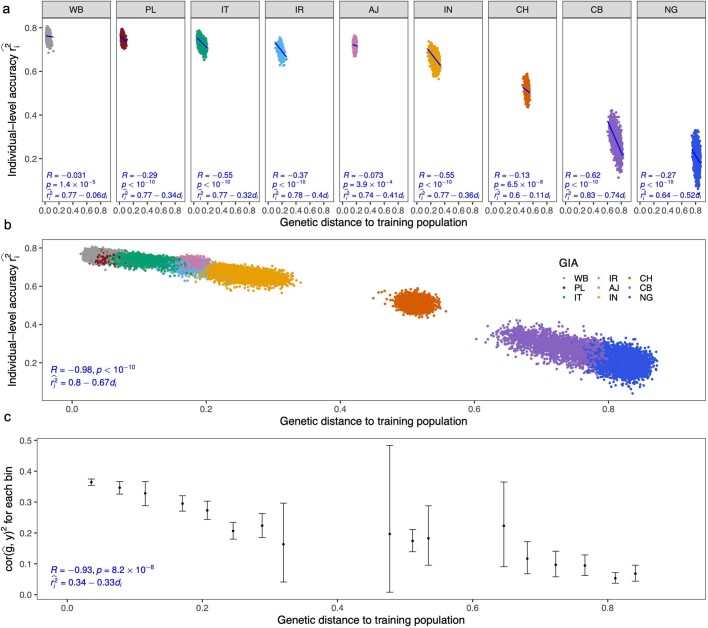
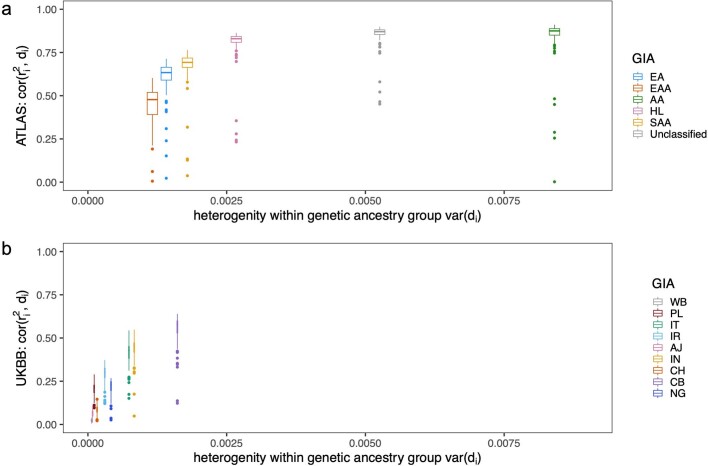
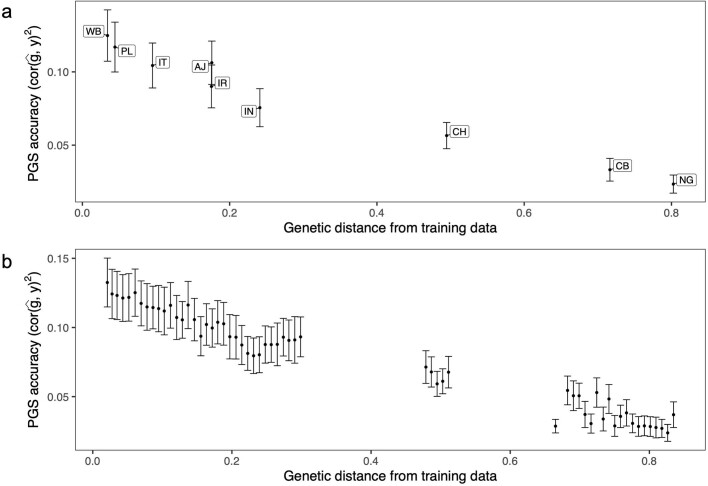
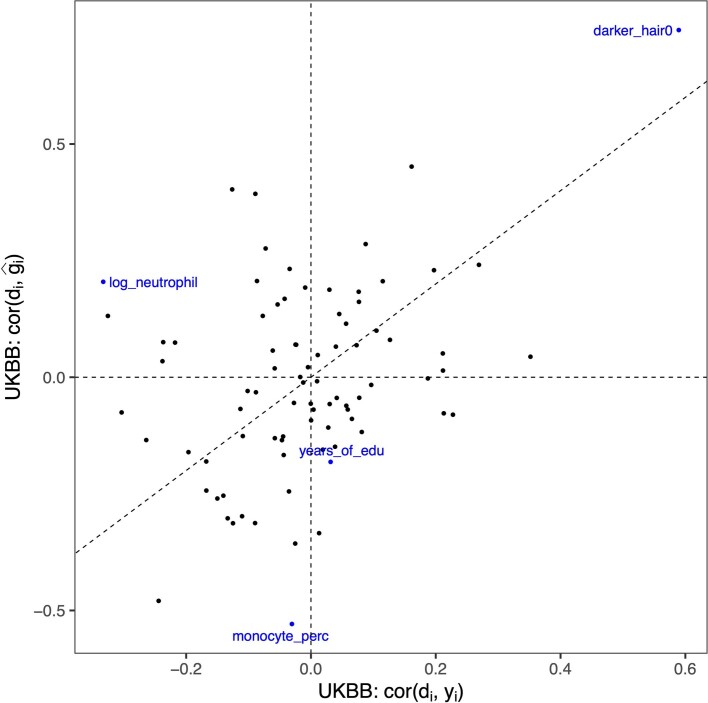
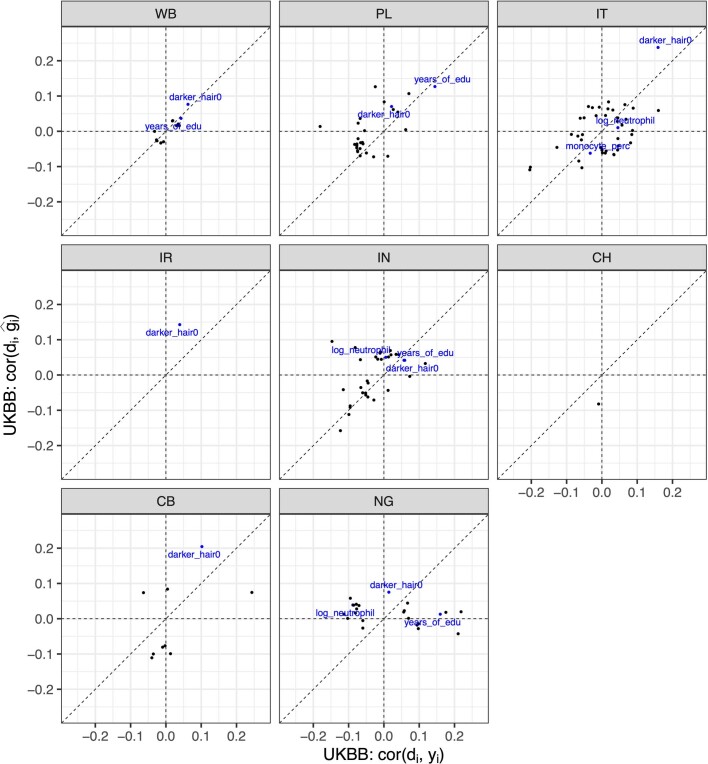
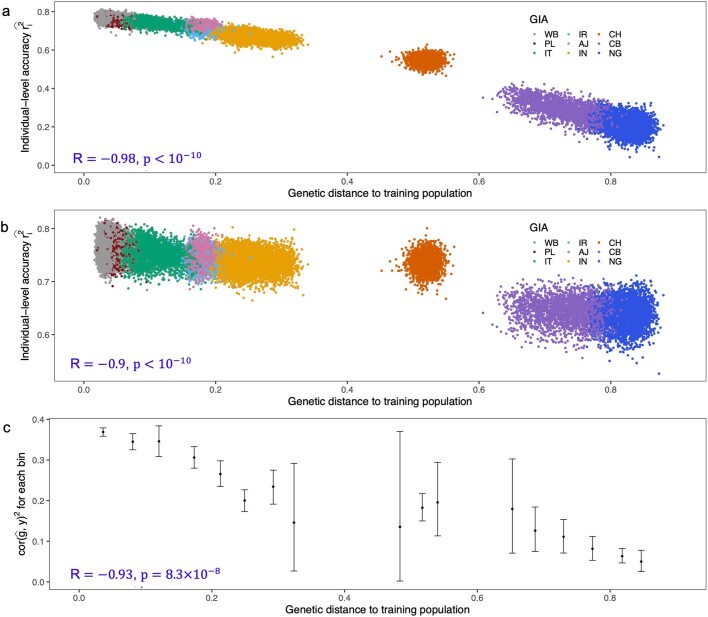
Polygenic scores (PGSs) have limited portability across different groupings of individuals (for example, by genetic ancestries and/or social determinants of health), preventing their equitable use1-3. PGS portability has typically been assessed using a single aggregate population-level statistic (for example, R2)4, ignoring inter-individual variation within the population. Here, using a large and diverse Los Angeles biobank5 (ATLAS, n = 36,778) along with the UK Biobank6 (UKBB, n = 487,409), we show that PGS accuracy decreases individual-to-individual along the continuum of genetic ancestries7 in all considered populations, even within traditionally labelled 'homogeneous' genetic ancestries. The decreasing trend is well captured by a continuous measure of genetic distance (GD) from the PGS training data: Pearson correlation of -0.95 between GD and PGS accuracy averaged across 84 traits. When applying PGS models trained on individuals labelled as white British in the UKBB to individuals with European ancestries in ATLAS, individuals in the furthest GD decile have 14% lower accuracy relative to the closest decile; notably, the closest GD decile of individuals with Hispanic Latino American ancestries show similar PGS performance to the furthest GD decile of individuals with European ancestries. GD is significantly correlated with PGS estimates themselves for 82 of 84 traits, further emphasizing the importance of incorporating the continuum of genetic ancestries in PGS interpretation. Our results highlight the need to move away from discrete genetic ancestry clusters towards the continuum of genetic ancestries when considering PGSs.


Conflict of interest statement

The authors declare no competing interests.

Figures

Fig. 1
Fig. 1. Illustration of population-level versus individual-level PGS accuracy.
a, Discrete labelling of GIA with PCA-based clustering. Each dot represents an individual. The circles represent arbitrary boundaries imposed on the genetic ancestry continuum to divide individuals into different GIA clusters. The colour represents the GIA cluster label. The grey dots are individuals who are left unclassified. b, Schematic illustrating the variation of population-level PGS accuracy across clusters. The box plot represents the PGS accuracy (for example, R2) measured at the population level. The question mark emphasizes that the PGS accuracy for unclassified individuals is unknown owing to the lack of a reference group. Grey dashed lines emphasize the categorical nature of GIA clustering. c, Continuous labelling of everyone’s unique position on the genetic ancestry continuum with a PCA-based GD. The GD is defined as the Euclidean distance of an individual’s genotype from the centre of the training data when projected on the PC space of training genotype data. Everyone has their own unique GD, di, and individual PGS accuracy, ri2. d, Individual-level PGS accuracy decays along the genetic ancestry continuum. Each dot represents an individual and its colour represents the assigned GIA label. Individuals labelled with the same ancestry spread out on the genetic ancestry continuum, and there are no clear boundaries between GIA clusters. This figure is illustrative and does not involve any real or simulated data.
Fig. 2
Fig. 2. PGS performance is calibrated across GD in simulations using UKBB data.
a, The 90% credible intervals of genetic liability (CI-gi) are well calibrated for testing individuals at all GDs. The red dashed line represents the expected coverage of the 90% CI-gi. Each dot represents a randomly selected UKBB testing individual. For each dot, the x-axis is its GD from the training data, the y-axis is the empirical coverage of the 90% CI-gi calculated as the proportion of simulation replicates for which the 90% CI-gi contain the individual’s true genetic liability, and the error bars represent the mean ±1.96 standard error of the mean (s.e.m.) of the empirical coverage calculated from 100 simulations. b, The width of the 90% CI-gi increases with GD. For each dot, the y-axis is the average width of the 90% CI-gi across 100 simulation replicates, and the error bars represent ±1.96 s.e.m. c, Individual PGS accuracy decreases with GD. For each dot, the y-axis is the average individual-level PGS accuracy across 100 simulation replicates, and the error bars represent ±1.96 s.e.m. d, Population-level metrics of PGS accuracy recapitulates the decay in PGS accuracy across the genetic continuum. All UKBB testing individuals are divided into 100 equal-interval bins based on their GD. The x-axis is the average GD for the bin, and the y-axis is the squared correlation between genetic liability and PGS estimates for the individuals within the bin. The dot and error bars represent the mean and ±1.96 s.e.m from 100 simulations, respectively.
Fig. 3
Fig. 3. The individual-level accuracy for height PGS decreases across the genetic ancestry continuum in ATLAS.
a, Individual PGS accuracy decreases within both homogeneous and admixed genetic GIA clusters. Each dot represents a testing individual from ATLAS. For each dot, the x-axis represents its distance from the training population on the genetic continuum; the y-axis represents its PGS accuracy. The colour represents the GIA cluster. b, Individual PGS accuracy decreases across the entire ATLAS. c, Population-level PGS accuracy decreases with the average GD in each GD bin. All ATLAS individuals are divided into 20 equal-interval GD bins. The x axis is the average GD within the bin, and the y axis is the squared correlation between PGS and phenotype for individuals in the bin; the dot and error bar show the mean and 95% confidence interval from 1,000 bootstrap samples. R and P refer to the correlation between GD and PGS accuracy and its significance, respectively, from two-sided Pearson correlation tests without adjustment for multiple hypothesis testing. Any P value below 10−10 is shown as P<1010. EA, European American; HL, Hispanic Latino American; SAA, South Asian American; EAA, East Asian American; AA, African American.
Fig. 4
Fig. 4. The correlation between individual PGS accuracy and GD is pervasive across 84 traits across ATLAS and the UKBB.
a, The distribution of correlation between individual PGS accuracy and GD for 84 traits in ATLAS. b, The distribution of correlation between individual PGS accuracy and GD for 84 traits in the UKBB. Each box plot contains 84 points corresponding to the correlation between PGS accuracy and GD within the GIA group specified by the x-axis for each of the 84 traits. The box shows the first, second and third quartiles of the 84 correlations, and the whiskers extend to the minimum and maximum estimates located within 1.5 × IQR from the first and third quartiles, respectively. Numerical results are reported in Supplementary Tables 2 and 3.
Fig. 5
Fig. 5. Measured phenotype, PGS estimates and accuracy vary across ATLAS.
a, Variation of height phenotype, PGS estimates and accuracy across different GD bins in ATLAS. b, Variation of log neutrophil count phenotype, PGS estimates and accuracy across different GD bins in ATLAS. The 36,778 ATLAS individuals are divided into 20 equal-interval GD bins. Bins with fewer than 50 individuals are not shown owing to large s.e.m. All panels share the same layout: the x axis is the average GD within the bin; the y axis is the average phenotype (top), PGS (middle) and individual PGS accuracy (bottom); the error bars represent ±1.96 s.e.m.
Extended Data Fig. 1
Extended Data Fig. 1. The individual level accuracy is highly correlated with population level accuracy.
All UKBB testing individuals are divided into 100 bins based on their GD. The x-axis is the average individual-level PGS accuracy for the individuals within the bin and the y-axis is (a) the squared correlation between simulated genetic liability and PGS estimates for the individuals within the bin (b) the squared correlation between simulated phenotype and PGS estimates. The dot and error bars represent the mean and ±1.96 s.e.m from 100 simulations. Both p-values were derived from two-sided Pearson correlation tests without adjustment for multiple hypothesis testing. Any p-value below 1010 is annotated as p<1010.
Extended Data Fig. 2
Extended Data Fig. 2. PGS performance varies across GD in simulations using CB and NG as training data (hg2=0.8 and pcausal=0.1%).
(a) The coverage of the 90% credible intervals of genetic liability (CI-gi) is approximately uniform across testing individuals at all GDs. The red dotted line represents the expected coverage of 90% CI-gi. Each dot represents a randomly selected UKBB testing individual. For each dot, the x-axis is its GD from African training data, the y-axis is the empirical coverage of 90% CI-gi calculated as the proportion of simulation replicates where the 90% credible intervals contain the individual’s true genetic liability, and the error bars represent mean ±1.96 standard error of the mean (s.e.m) of the empirical coverage calculated from 100 simulations. (b) The width of 90% CI-gi increases with GD. For each dot, the y-axis is the average width of 90% CI-gi across 100 simulation replicates, and the error bars represent ±1.96 s.e.m. (c) Individual PGS accuracy decreases with GD. For each dot, the y-axis is the average individual level PGS accuracy across 100 simulation replicates, and the error bars represent ±1.96 s.e.m. (d) Population-level metrics of PGS accuracy recapitulates the decay in PGS accuracy across genetic continuum. All UKBB testing individuals are divided into 100 equal-interval bins based on their GD. The x-axis is the average GD for the bin and the y-axis is the squared correlation between genetic liability and PGS estimates for the individuals within the bin. The dot and error bars represent the mean and ±1.96 s.e.m from 100 simulations.
Extended Data Fig. 3
Extended Data Fig. 3. PGS performance varies across GD in simulations using CB and NG as training data (hg2=0.8 and pcausal=1%).
(a) The coverage of the 90% credible intervals of genetic liability (CI-gi) is approximately uniform across testing individuals at all GDs. (b) The width of 90% CI-gi increases with GD. (c) Individual PGS accuracy decreases with GD. (d) Population-level metrics of PGS accuracy recapitulates the decay in PGS accuracy across genetic continuum. See Extended Data Fig. 2 for a detailed figure description.
Extended Data Fig. 4
Extended Data Fig. 4. The effect of different metrics of GD on the correlation between GD and accuracy.
The y-axis corri2,di is the correlation between the GD and PGS accuracy; a larger correlation means GD has a better prediction of accuracy. The x-axis are different GD metrics: (1) GD based on PCA with varying number of PCs (from J = 1 to J = 20) and (2) GD based on GRM using pruned PCA SNPs only or all SNPs in PGS models. The GRM GD is computed as di(GRM)=1Kk=1Kxixk2, where xi is the standardized genotype of ith testing individual and xk is the standardized genotype of kth training individual.
Extended Data Fig. 5
Extended Data Fig. 5. The individual-level accuracy for height PGS decreases across the genetic ancestry continuum in UKBB.
(a) Individual PGS accuracy decreases within subcontinental GIA clusters. Each dot represents a testing individual from UKBB. For each dot, the x-axis represents its distance from the training population on the genetic continuum; the y-axis represents its PGS accuracy. The color represents the GIA cluster. (b) Individual PGS accuracy decreases across the entire UKBB. (c) The population PGS accuracy decreases with the average GD in each bin. All UKBB individuals are divided into 20 equal-interval GD bins. The x-axis is the average GD within the bin; the y-axis is the squared correlation between PGS and phenotype for individuals in the bin. The dot and error bar show mean and 95% confidence interval from 1000 bootstrap samples. R and p refer to the correlation between GD and PGS accuracy and its significance from two-sided Pearson correlation tests without adjustment for multiple hypothesis testing. Any p-value below 1010 is shown as p<1010.
Extended Data Fig. 6
Extended Data Fig. 6. Lower heterogeneity within the genetic ancestry group corresponds to a lower correlation between genetic distance and individual PGS accuracy.
(a) The distribution of correlations between PGS accuracy and GD for 84 traits in ATLAS. (b) The distribution of correlations between PGS accuracy and GD for 84 traits in UKBB. The x-axis is the homogeneity of the genetic ancestry clusters measured as the variance of GD within a genetic ancestry cluster; a larger var(di) indicates a larger variation of genetic background. Each boxplot contains 84 points corresponding to the correlation between PGS accuracy and GD within the group specified by x-axis for each of the 84 traits. The box shows the first, second and third quartile of the 84 correlations, and whiskers extend to the minimum and maximum estimates located within 1.5 × IQR from the first and third quartiles, respectively.
Extended Data Fig. 7
Extended Data Fig. 7. Empirical PGS accuracy decreases with genetic distance in UKBB averaged across 84 traits.
(a) Empirical PGS accuracy decreases across subcontinental GIA clusters. (b) Empirical PGS accuracy decreases across bins of GD. The x-axis is the average GD for all individuals within each GIA cluster or GD bin; the y-axis is the accuracy for each GIA cluster or GD bin. The dot and error bar show mean and ±1.96 standard error of the mean across 84 traits.
Extended Data Fig. 8
Extended Data Fig. 8. Discordant directions of phenotype/PGS-distance correlations in UKBB.
The x axis is the correlation between phenotype and GD and the y axis is the correlation between PGS estimates and GD for all 48,586 testing individuals in UKBB. Numerical results are reported in Supplementary Table 4.
Extended Data Fig. 9
Extended Data Fig. 9. The correlation of PGS/phenotype with GD within each ancestry clusters in UKBB.
Only traits that exhibit significant correlation between GD and PGS/phenotype are shown as dots in the figure. The Ashkenazi cluster is not included because no significant correlations are observed.
Extended Data Fig. 10
Extended Data Fig. 10. Comparison of individual accuracy for height in UKBB.
(a) Accuracy computed from equation (1), with varβ(xiβ) set as fixed heritability; (b) Accuracy computed from equation (1), with varβ(xiβ) estimated from Monte Carlo sampling from prior distribution of β. (c) Empirical accuracy estimated as the squared correlation between PGS and height for each genetic distance bin. All UKBB individuals are divided into 20 equal-interval GD bins. The x-axis is the average GD within the bin; the y-axis is the squared correlation between PGS and phenotype for individuals in the bin. The dot and error bar show mean and 95% confidence interval from 1000 bootstrap samples. Both (a) and (b) reflect the decreasing trend of empirical accuracy in (c). All p-values were derived from two-sided Pearson correlation tests without adjustment for multiple hypothesis testing. Any p-value below 1010 is shown as p<1010.

References

    1. Martin AR, et al. Clinical use of current polygenic risk scores may exacerbate health disparities. Nat. Genet. 2019;51:584–591. - PMC - PubMed
    1. Mostafavi H, et al. Variable prediction accuracy of polygenic scores within an ancestry group. Elife. 2020;9:e48376. - PMC - PubMed
    1. Wang Y, Tsuo K, Kanai M, Neale BM, Martin AR. Challenges and opportunities for developing more generalizable polygenic risk scores. Annu. Rev. Biomed. Data Sci. 2022;5:293–320. - PMC - PubMed
    1. Lambert SA, Abraham G, Inouye M. Towards clinical utility of polygenic risk scores. Hum. Mol. Genet. 2019;28:R133–R142. - PubMed
    1. Johnson R, et al. Leveraging genomic diversity for discovery in an electronic health record linked biobank: the UCLA ATLAS Community Health Initiative. Genome Med. 2022;14:104. - PMC - PubMed

Publication types