. 2023 Jun;618(7963):151-158.
doi: 10.1038/s41586-023-06073-w. Epub 2023 May 17.

Uridine-derived ribose fuels glucose-restricted pancreatic cancer

Affiliations

Uridine-derived ribose fuels glucose-restricted pancreatic cancer

Zeribe C Nwosu et al. Nature. 2023 Jun.

Abstract

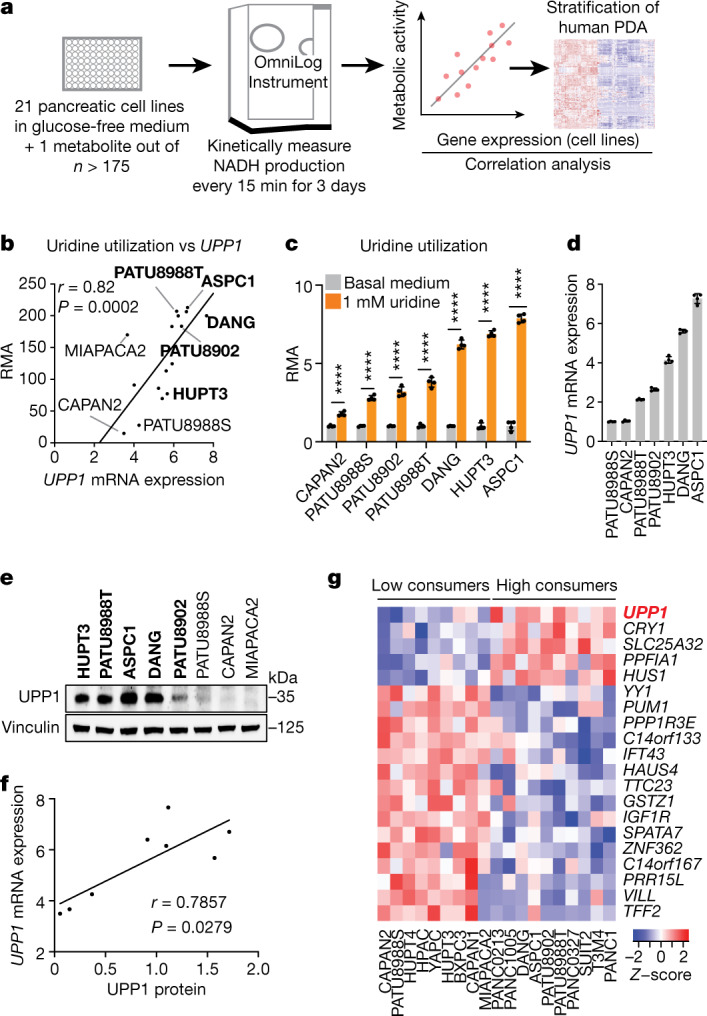
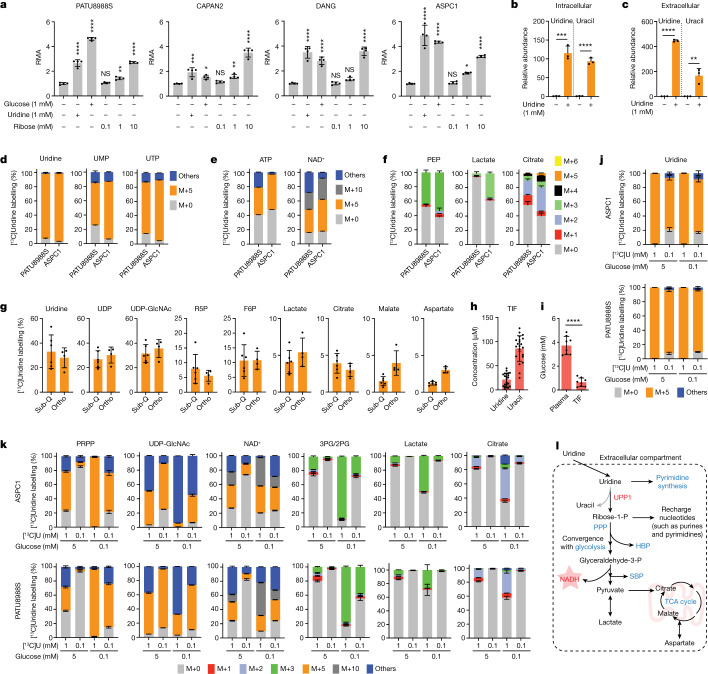
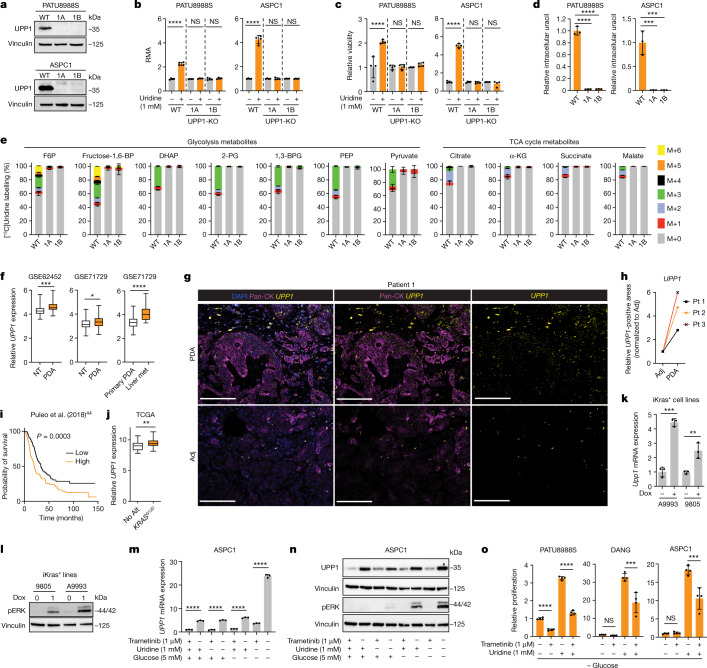
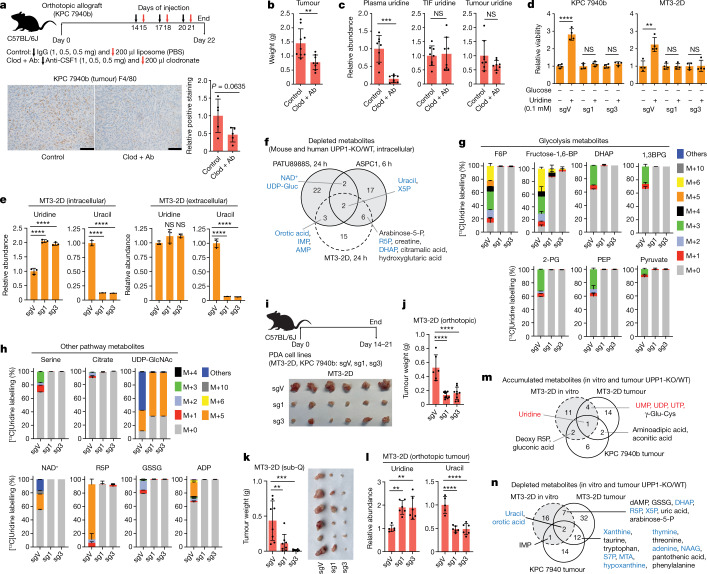
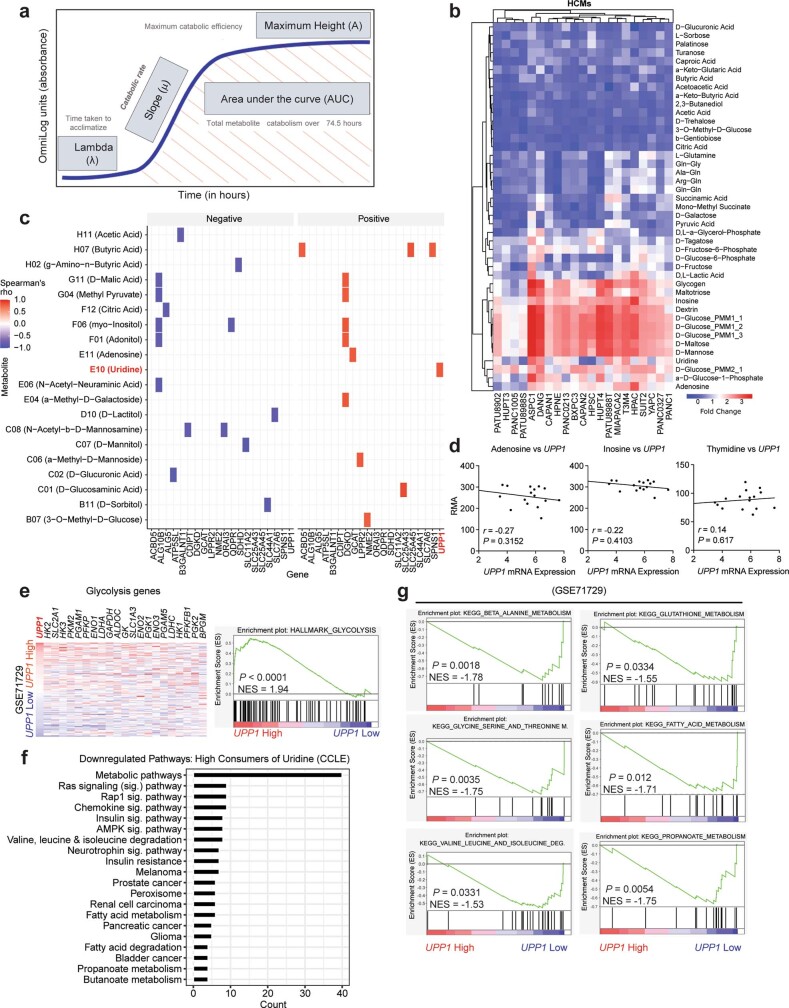
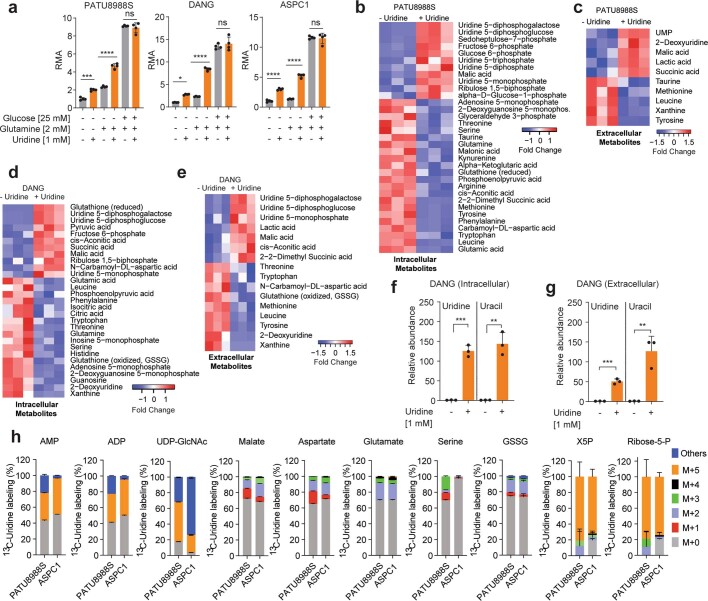
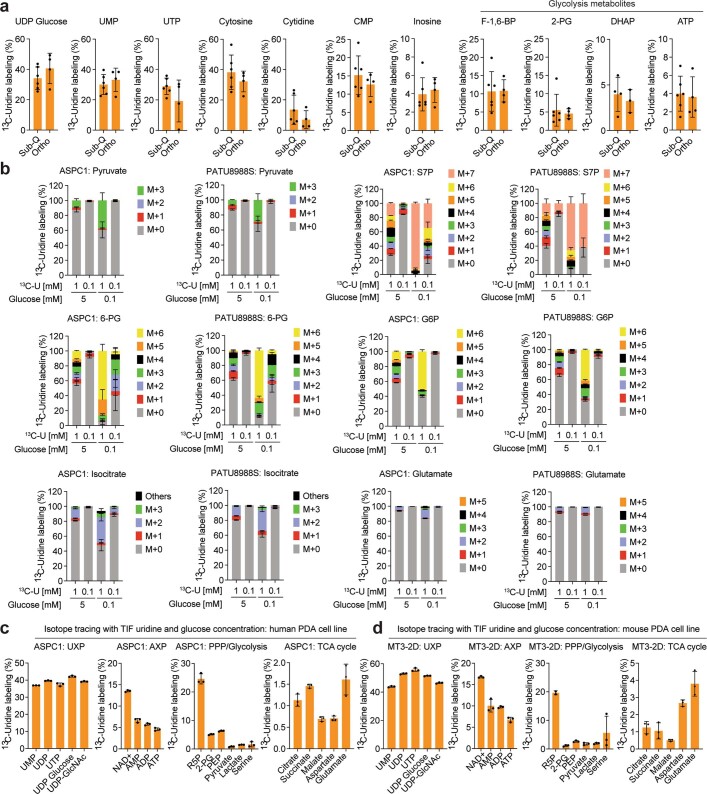
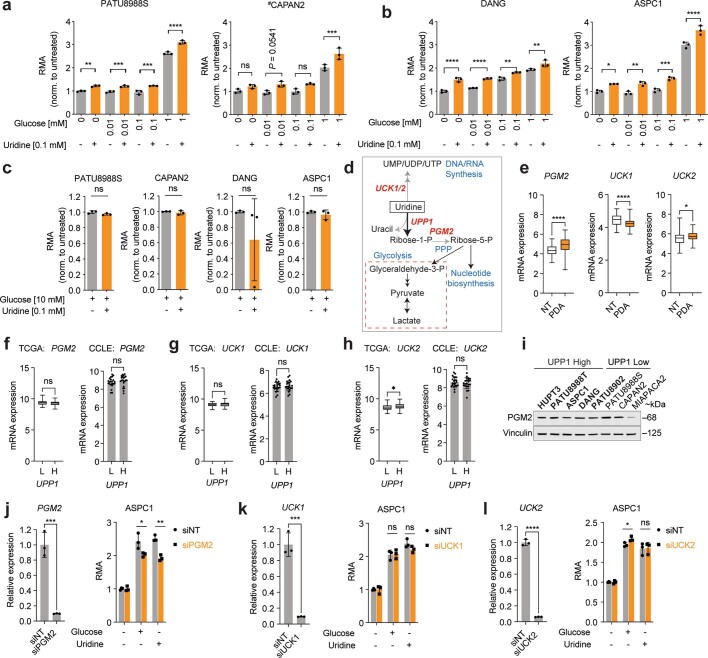
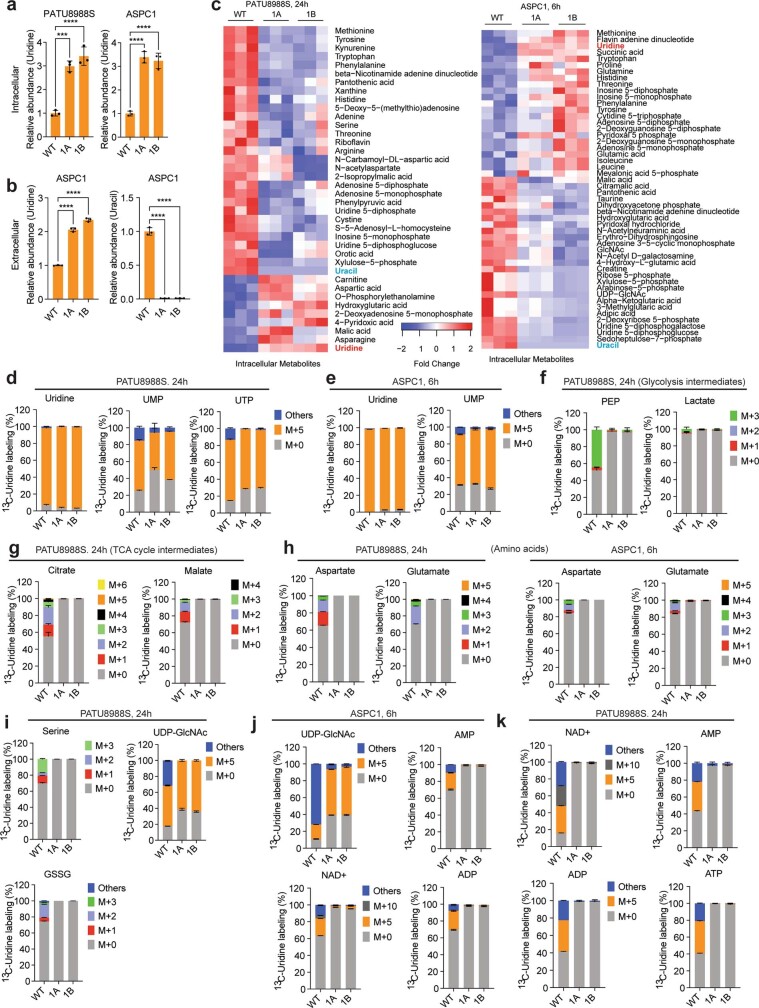
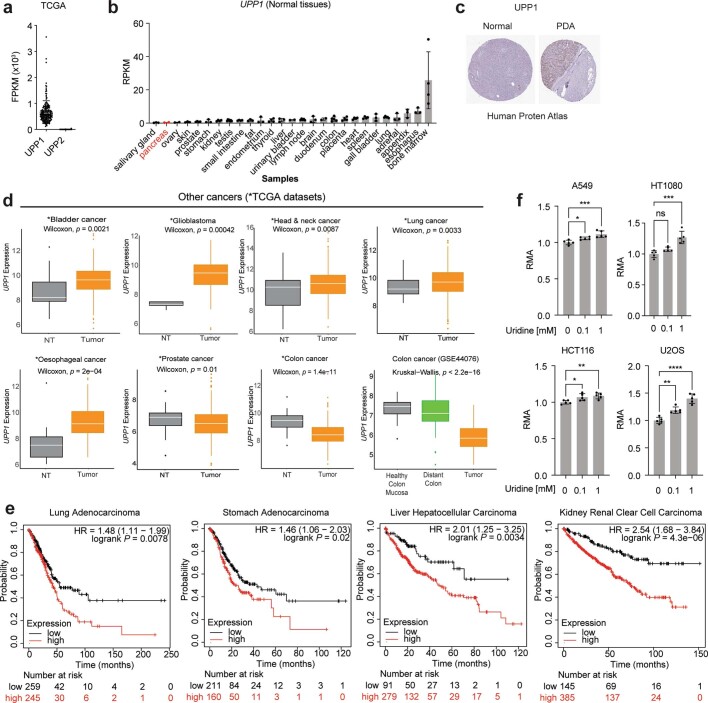
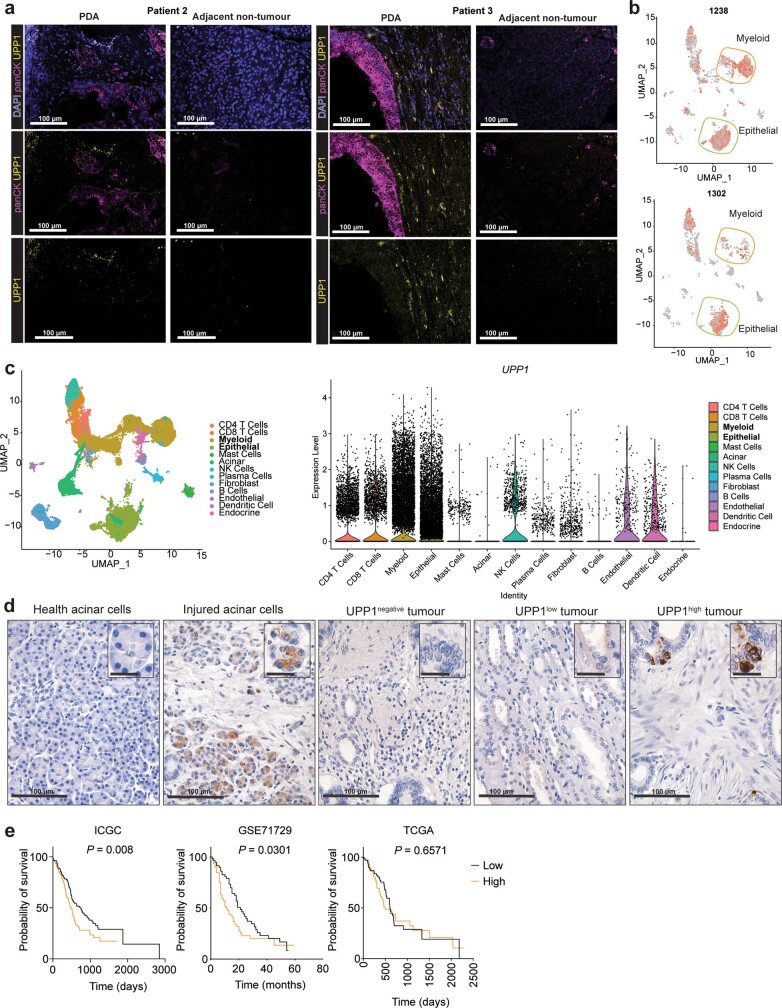
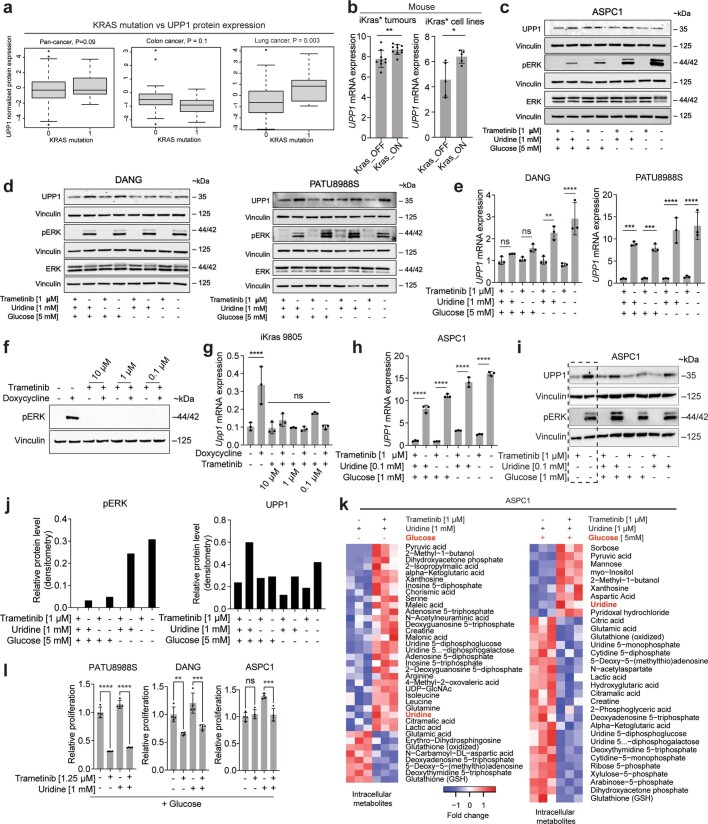
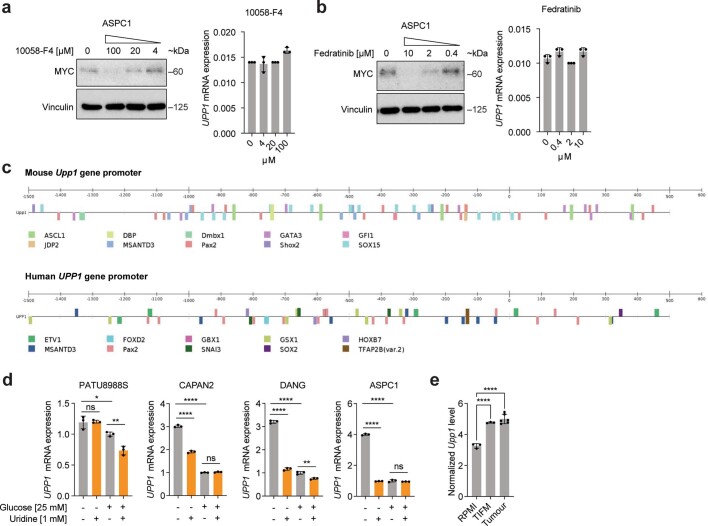
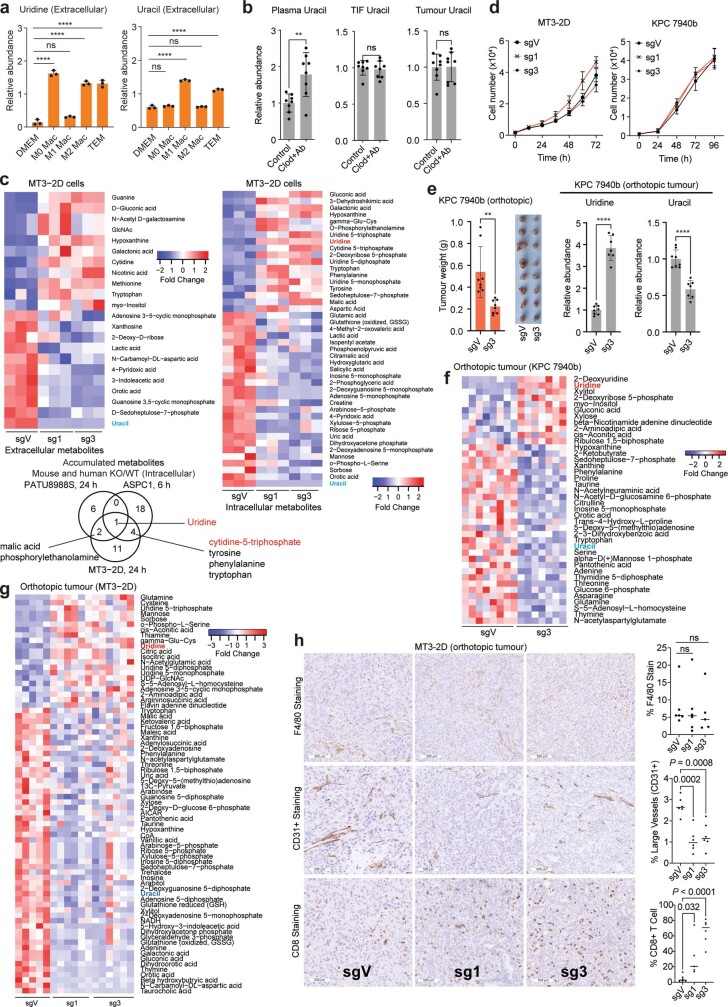
Pancreatic ductal adenocarcinoma (PDA) is a lethal disease notoriously resistant to therapy1,2. This is mediated in part by a complex tumour microenvironment3, low vascularity4, and metabolic aberrations5,6. Although altered metabolism drives tumour progression, the spectrum of metabolites used as nutrients by PDA remains largely unknown. Here we identified uridine as a fuel for PDA in glucose-deprived conditions by assessing how more than 175 metabolites impacted metabolic activity in 21 pancreatic cell lines under nutrient restriction. Uridine utilization strongly correlated with the expression of uridine phosphorylase 1 (UPP1), which we demonstrate liberates uridine-derived ribose to fuel central carbon metabolism and thereby support redox balance, survival and proliferation in glucose-restricted PDA cells. In PDA, UPP1 is regulated by KRAS-MAPK signalling and is augmented by nutrient restriction. Consistently, tumours expressed high UPP1 compared with non-tumoural tissues, and UPP1 expression correlated with poor survival in cohorts of patients with PDA. Uridine is available in the tumour microenvironment, and we demonstrated that uridine-derived ribose is actively catabolized in tumours. Finally, UPP1 deletion restricted the ability of PDA cells to use uridine and blunted tumour growth in immunocompetent mouse models. Our data identify uridine utilization as an important compensatory metabolic process in nutrient-deprived PDA cells, suggesting a novel metabolic axis for PDA therapy.


Conflict of interest statement

C.A.L. has received consulting fees from Astellas Pharmaceuticals, Odyssey Therapeutics, and T-Knife Therapeutics, and is an inventor on patents pertaining to KRAS-regulated metabolic pathways, redox control pathways in pancreatic cancer, and targeting the GOT1-pathway as a therapeutic approach (US patent 2015126580-A1, 05/07/2015; US patent 20190136238, 05/09/2019; international patent WO2013177426-A2, 04/23/2015). A.S. received grants from Merck, Pierre Fabre and Bristol Myers Squibb and is an inventor on patents on colorectal cancer classification with differential prognosis and personalized therapeutic responses (PCT/IB2013/060416); prognostic and treatment response prediction in gastric cancer (priority patent CSC/BP7295892); patient classification and prognostic method (GEP-NET) (priority patent EP18425009.0); and molecular predictors of therapeutic response to specific anti-cancer agents (US9506926B2).

Figures

Fig. 1
Fig. 1. Profiling of metabolite utilization in PDA cells identifies uridine.
a, Scheme of the nutrient metabolism screening assay and the correlation with gene expression in PDA cell lines and tumours. b, Spearman correlation (r) between the normalized relative metabolic activity (RMA) for uridine catabolism in the screening data and UPP1 mRNA expression data from an independent dataset (16 PDA cell lines). UPP1-high cell lines are shown in bold. c, The RMA in a subset of PDA cell lines following supplementation with 1 mM uridine for 3 days in glucose-free condition. d, Quantitative PCR (qPCR) validation of UPP1 mRNA expression in a subset of PDA cell lines. e, Immunoblot showing basal UPP1 expression in PDA cell lines. Blots are representative of three technical replicates with similar results. f, Spearman correlation (r) between protein densitometry analysis of the blot in e and UPP1 mRNA expression in the eight PDA cell lines highlighted in e. g, Top 20 genes differentially expressed by the PDA cell lines that were identified as uridine-high consumers/metabolizers compared with uridine-low consumers from the nutrient metabolism screen. Data source: Cancer Cell Line Encyclopedia (CCLE). Data in c,d are mean ± s.d. See Methods ‘Statistics and reproducibility’ section for additional information.
Fig. 2
Fig. 2. Uridine-derived ribose supports nutrient-restricted PDA.
a, RMA of four PDA cell lines supplemented with glucose, uridine or ribose under nutrient-limiting culture conditions (0 mM glucose, 0.3 mM glutamine and 5% dialysed FBS). b,c, Intracellular and extracellular uridine and uracil after 24 h culture of PATU8988S cells in medium with no glucose and 10% dialysed FBS with or without 1 mM uridine as measured by LC–MS. df, Mass isotopologue distribution of carbon derived from [13C5]uridine in uridine, UMP and UTP (d), ATP and NAD+ (e) and phosphoenolpyruvate (PEP), lactate and citrate (f) in the indicated cell lines after 24 h culture with 1 mM uridine. g, Isotope tracing showing [13C5]uridine-derived carbon labelling in subcutaneous (sub-Q) or orthotopically (ortho) implanted KPC 7940b tumours collected 1 h after injecting the mice with 0.2 M [13C5]uridine. F6P, fructose-6-phosphate; R5P, ribose-5-phosphate; UDP-GlcNAc, uridine diphosphate N-acetylglucosamine; h, Absolute quantification via metabolomics of uridine and uracil concentration in the TIF of orthotopic PDA tumours from syngeneic mouse KPC cells. i, Absolute quantification via metabolomics of glucose concentration in the pancreatic TIF and plasma of mice orthotopically implanted with KPC 7490b syngeneic tumours. j,k, Mass isotopologue distribution of [13C5]uridine ribose-derived carbon after 24 h culture of ASPC1 and PATU8988S cells in medium supplemented with 1 mM or 0.1 mM uridine and each with 5 mM or 0.1 mM glucose. j, Uridine. k, PRPP, UDP-GlcNAc, NAD+, 3-phosphoglycerate/2-phosphoglycerate (3PG/2PG), lactate and citrate. PRPP, phosphoribosyl pyrophosphate. l. Schematic depicting the fate of uridine-derived ribose carbon in PDA cells actively catabolizing uridine. Glyceraldehyde-3-P, glyceraldehyde-3-phosphate; HBP, hexosamine biosynthetic pathway; PPP, pentose phosphate pathway; ribose-1-P, ribose-1-phosphate; SBP, serine biosynthesis pathway. See Methods ‘Statistics and reproducibility’ section for additional information.
Fig. 3
Fig. 3. KRAS-driven UPP1 liberates ribose and is increased in PDA.
a, Western blot validation of UPP1-KO in human PDA cell lines. 1A and 1B denote UPP1-KO cells. WT, wild type. b,c, RMA from tetrazolium assay showing uridine-derived reducing potential (b) and CellTiter Glo showing ATP production (c) in UPP1-KO and wild-type PATU8988S and ASPC1 cells cultured with or without 1 mM uridine for 48 h. d, Relative intracellular uracil as determined by LC–MS in wild-type and UPP1-KO human PDA clones cultured with 1 mM uridine for 24 h (PATU8988S) or 6 h (ASPC1). e, Mass isotopologue distribution of 1 mM [13C5]uridine-derived carbon in glycolysis and TCA cycle metabolites in wild-type or UPP1-KO ASPC1 cells after 6 h. α-KG, α-ketoglutarate; 1,3-BPG, 1,3-bisphosphoglycerate; DHAP, dihydroxyacetone phosphate; fructose-1,6-BP, fructose-1,6-bisphosphate. f, UPP1 mRNA expression in PDA tumours and non-tumoural pancreas tissues in microarray datasets. Liver met, liver metastasis; NT, non-tumour tissue. g,h, RNAscope showing representative UPP1 mRNA expression in tumour and adjacent normal tissue (adj) sections (g) and quantification from three patients (Pt 1–3) with PDA (h). Scale bars, 100 μm. i, Kaplan–Meier overall survival analysis (log-rank test) based on ranked UPP1 expression in the PDA dataset published previously. j, Comparison of UPP1 mRNA expression in human PDA tumours annotated as KRASG12D or with no alteration (No Alt) in KRAS from the TCGA dataset. k, qPCR data showing Upp1 expression in mouse cell lines (A9993 and 9805) with doxycycline-inducible oncogenic Kras (iKras*). l, Western blot validation of MAPK pathway induction as indicated by phosphorylated ERK (pERK) in the iKras* cell lines. m,n, qPCR for UPP1 mRNA (m) and western blot for pERK and UPP1 (n) in ASPC1 cells cultured with or without 5 mM glucose, 1 mM uridine and 1 μM trametinib for 48 h. o, MTT assay showing relative proliferation of PDA cell lines with 1.25 μM trametinib and 1 mM uridine in the absence of glucose. See Methods ‘Statistics and reproducibility’ section for additional information.
Fig. 4
Fig. 4. UPP1-KO impairs the growth of orthotopic pancreatic tumour allografts.
a, Schematic of macrophage depletion (top) and validation by immunohistochemistry with F4/80 monoclonal antibody (bottom). Scale bars, 100 μm. Clod + Ab denotes anti-mouse CSF1 antibody and clodronate liposome. b, Tumour weight from control and macrophage-depleted mice at end point. c, Relative plasma, TIF and whole-tumour uridine levels in samples from the control and macrophage-depleted groups, measured by LC–MS. d, CellTiter Glo assay indicating relative viability (via ATP) of UPP1-KO (sg1 and sg3) and non-targeting control vector (sgV) mouse PDA cells. e, Relative intracellular and extracellular uridine and uracil levels in the control and UPP1-KO MT3-2D mouse PDA cell lines after 1 mM uridine supplementation, as determined by LC–MS. f, Venn diagram showing metabolites depleted in vitro upon UPP1-KO in the human (PATU8988S and ASPC1) and mouse (MT3-2D) PDA cell lines, determined by LC–MS. Metabolites in blue are those from the glycolysis, nucleotide biosynthesis or pentose phosphate pathways. Arabinose-5-P, arabinose-5-phosphate; IMP, inosine monophosphate; UDP-Gluc, uridine diphosphate-glucose; X5P, xylulose 5-phosphate. g,h, Stable isotope tracing showing mass isotopologue distribution of 1 mM [13C5]uridine-derived carbon in metabolites from glycolysis (g) and other pathways (h) in the MT3-2D cells after 6 h culture. 1,3BPG, 1,3-bisphosphoglcerate; GSSG, oxidized glutathione. i, Top, schematic of tumour studies. Bottom, representative photograph of tumours collected from mice orthotopically implanted with the control vector (sgV) or UPP1-KO (sg1, sg3) MT3-2D cells. j, Tumour weight at end point of C57BL/6J mice orthotopically implanted with the MT3-2D cells. k, Weight and photograph of tumours collected at the end point after subcutaneous implantation of MT3-2D cells into the left and right flanks of C57BL/6J mice. l, Relative tumour uridine and uracil abundance in the orthotopic tumour samples described in i,j, as determined by LC–MS. m,n, Venn diagram showing metabolites commonly accumulated (m) and depleted (n) in UPP1-KO tumours implanted in mice and UPP1-KO cultured cells versus the wild type, as determined by LC–MS. m, Metabolites in red are associated with nucleotide biosynthesis. n, Metabolites in blue are associated with glycolysis, nucleotide biosynthesis or PPP. MTA, 5′-methylthioadenosine; NAAG, N-acetylaspartylglutamic acid; S7P, sedoheptulose 7-phosphate. See Methods ‘Statistics and reproducibility’ section for additional information.
Extended Data Fig. 1
Extended Data Fig. 1. Correlation of nutrient utilization with gene expression identifies uridine and UPP1.
a. Schematic overview of the parameters measured by the Biolog Phenotype Microarray. b. Heatmap showing the high confidence metabolites (HCMs), namely, the metabolites that were utilized above or below the median of negative controls as determined by one-tailed Wilcoxon rank sum test. Legend denotes fold change relative to median negative control signal, where red shows high utilization and blue shows low utilization. c. Spearman correlation plot, indicating the genes that showed positive or negative correlation with metabolites’ RMA in the Biolog screen. d. Spearman correlations, r, between UPP1 expression in cell lines (ref. ) and RMA of nucleosides that were included in the Biolog screen. n = 16 PDA cell lines. e. Heatmap showing the expression of glycolysis genes in human PDA tumours ranked based on UPP1 expression (dataset: GSE71729, UPP1 low, n = 72; high, n = 73). On the right: GSEA plot indicating the enrichment of glycolysis hallmark in the UPP1 high relative to the low tumours. NES, normalized enrichment score. f. Downregulated pathways in PDA cell lines that metabolize uridine at a high level, as revealed by gene ontology (GO) analysis of the differentially expressed genes (P < 0.05). GO analysis was performed with DAVID (https://david.ncifcrf.gov/tools.jsp). Analysis was based on the differential genes derived from CCLE data and part of the data shown in Fig. 1g. g. GSEA plots of significantly enriched KEGG pathways in UPP1-high PDA tumours relative to UPP1 low tumours. Plots are part of the data (e) from the analysis of GSE71729 human PDA dataset. Statistics and reproducibility: a, The kinetic measurement evaluated several parameters, including the time taken for cells to adapt to and catabolize a nutrient (lambda), the rate of uptake and catabolism (mu or slope), the total metabolic activity (area under the curve; AUC), and the maximum metabolic activity. The values from the maximum catabolic efficiency (maximum height, A) of the respective metabolites were used to determine relative metabolic activity (RMA).
Extended Data Fig. 2
Extended Data Fig. 2. Nutrient-deprived PDA use uridine to support metabolism.
a. Relative RMA upon uridine supplementation with or without glucose and glutamine. n = 4 biologically independent samples per group per cell line. b. Differential changed (P < 0.05) intracellular and c) extracellular metabolites from PATU8988S cells supplemented with 1 mM uridine in glucose-free medium for 24 h, as determined by LC-MS metabolomics. n = 3 biologically independent samples per group. d. Differentially changed (P < 0.05) intracellular and e) extracellular metabolites from DANG cells supplemented with 1 mM uridine in glucose-free medium for 24 h, as determined by LC-MS metabolomics. n = 3 biologically independent samples per group. f. Intracellular and g) extracellular uridine and uracil from DANG cells supplemented with 1 mM uridine in glucose-free medium for 24 h, as determined by LC-MS. Plots in f-g are from the same experiment as d-e. n = 3 biologically independent samples per group. Statistical significance was measured using two-tailed unpaired t-test. Intracellular – comparison between no uridine and 1 mM uridine: *** P = 0.0001 for uridine, ** P = 0.0011 for uracil. Extracellular – comparison between no uridine and 1 mM uridine: *** P = 0.0002 for uridine, ** P = 0.0044 for uracil. h. Mass isotopologue distribution of 13C5-uridine ribose-derived carbon in the displayed metabolites after 24 h culture in a glucose-free medium supplemented with 1 mM uridine. n = 3 biologically independent samples per cell line. Tracing experiments were performed twice in these cells with similar results. Data (a, f, g, h) are shown as mean ± s.d. ADP, adenosine diphosphate; AMP, adenosine monophosphate; GSSG, oxidized glutathione; NADH, nicotinamide adenine dinucleotide; UDP-GlcNAc, uridine diphosphate N-acetylglucosamine; X5P, xylulose 5-phosphate. Statistics and Reproducibility: a, n = 4 biologically independent samples per group per cell line. Statistical significance was measured using one-way ANOVA with Tukey’s multiple comparisons test. PATU8988S (comparison between cells cultured in (−) glucose/glutamine/uridine and (−) glucose/glutamine/+uridine: *** P = 0.0007, comparison between (−) and (+) uridine in the presence of glutamine and without glucose: **** P < 0.00001, comparison between (−) and (+) uridine in the presence of glutamine and glucose: P = ns (0.8856)). DANG (comparison between cells cultured in (−) glucose/glutamine/uridine and (−) glucose/glutamine/+uridine: * P = 0.0165, comparison between (−) and (+) uridine in the presence of glutamine and without glucose: **** P < 0.0001, comparison between (−) and (+) uridine in the presence of glutamine and glucose: P = ns (0.7971)). ASPC1 (comparison between cells cultured in (−) glucose/glutamine/uridine and (−) glucose/glutamine/+uridine: **** P < 0.0001, comparison between (−) and (+) uridine in the presence of glutamine and without glucose: **** P < 0.00001, comparison between (−) and (+) uridine in the presence of glutamine and glucose: P = ns (0.9968)).
Extended Data Fig. 3
Extended Data Fig. 3. PDA metabolize uridine via central carbon metabolism in vitro and in vivo.
a. Isotope tracing showing 13C5-uridine ribose-derived carbon labelling in subcutaneous (Sub-Q) or orthotopically (Ortho) implanted KPC 7940b tumours collected 1 h after injecting the mice with 200 µL or 50 µL (Sub-Q) 0.2 M 13C5-uridine. Number of samples: Sub-Q = 6 tumours from 3 mice injected on the left and right flanks; Ortho = 4 tumours from 4 mice. Mode of uridine injection is intratumoural for Sub-Q and intraperitoneal for Ortho. b. Mass isotopologue distribution of 13C5-uridine ribose-derived carbon after 24 h culture of ASPC1 and PATU8988S cells in medium supplemented with 1 mM or 0.1 mM uridine, each with 5 mM or 0.1 mM glucose concentration. n = 4 biologically independent samples per group. M – mass; ‘Others’ – indicate M other than M+0 or M+5, where applicable. c–d. Isotope tracing showing metabolite labelling upon supplementation with 13C5-uridine at the TIF uridine and glucose concentrations shown in Fig. 2h,i, after 12 h of culturing c) human PDA cell line ASPC1 and d) murine PDA cell line MT3-2D. The cell lines were cultured in medium supplemented with 25 µM 13C5-uridine and 0.65 mM glucose. n = 3 biologically independent samples per cell line. AXP – AMP, ADP, ATP, and related metabolites; UXP – UMP, UDP, UTP and related metabolites. The experiments (a-d) were performed once. Data (a-d) are shown as mean ± s.d, where applicable. 2-PG, 2-phosphoglycerate; 6-PG, 6-phosphogluconate; ADP, adenosine diphosphate; AMP, adenosine monophosphate; ATP, adenosine triphosphate; DHAP, dihydroxyacetone phosphate; F1,6-BP, fructose 1,6-bisphosphate; CMP, cytidine monophosphate; G6P, glucose 6-phosphate; NAD+, nicotinamide adenine dinucleotide; R5P, ribose 5-phosphate; PEP, phosphoenolpyruvate; PPP, pentose phosphate pathway; TCA, tricarboxylic acid; S7P, sedoheptulose 7-phosphate; UDP, uridine diphosphate; UMP, uridine monophosphate; UTP, uridine triphosphate; UDP-GlcNAc, uridine diphosphate N-acetylglucosamine.
Extended Data Fig. 4
Extended Data Fig. 4. Cellular pathways for ribose salvage from uridine.
a–c. Relative metabolic activity (RMA) of PDA cell lines depicting the preferential use of uridine at (a,b) low glucose concentration (0-1 mM) but not at c) the high glucose concentration (10 mM), over a 96 h culture. d. Schematic depicting metabolic pathways for uridine utilization. e. Expression of PGM2, UCK1, and UCK2 in non-tumour (NT) and PDA tissue samples from the GSE71729 dataset. Number of samples: NT = 46, PDA = 145. f–h. Expression of PGM2, UCK1 and UCK2 in TCGA (human PDA tumour) and CCLE (human cell line) data separated into UPP1 low (L) and high (H) subsets. i. Western blot for PGM2 in PDA cell lines. Presented in bold are cells that express high UPP1. These samples are the same batch as the data shown in Fig. 1e and the blot was generated during one of the technical replicates of that western blotting. kDa, unit for molecular weight. j. qPCR for PGM2 in ASPC1 cells transfected with siPGM2 compared to non-targeting (siNT) control. On the right: RMA in PGM2 knockdown cells +/− uridine (1 mM) or glucose (1 mM). k. qPCR for UCK1 in ASPC1 cells transfected with siUCK1 compared to non-targeting (siNT) control. On the right: RMA in UCK1 knockdown cells +/− uridine (1 mM) or glucose (1 mM). l. qPCR for UCK2 in ASPC1 cells transfected with siUCK2 compared to non-targeting (siNT) control. On the right: RMA in UCK2 knockdown cells +/− uridine (1 mM) or glucose (1 mM). Statistics and reproducibility: a–c, n = 3 biologically independent samples. Statistical significance for data in a-b was measured using one-way ANOVA with Tukey’s multiple comparisons test. PATU8988S (comparison between no glucose and no glucose + uridine [0.1 mM]: **P = 0.0017; 0.01 mM glucose and 0.01 mM glucose + uridine: ***P = 0.0008; 0.1 mM glucose and 0.1 mM glucose + uridine: ***P = 0.0002; 1 mM glucose and 1 mM glucose + uridine: ****P < 0.0001). CAPAN2 (comparison between no glucose and no glucose + uridine: P = ns (0.5673); 0.01 mM glucose and 0.01 mM glucose + uridine: P = ns (0.0541); 0.1 mM glucose and 0.1 mM glucose + uridine: P = ns (0.092); 1 mM glucose and 1 mM glucose + uridine: ***P = 0.0007. #All four group comparisons have significant P: 0.0468, 0.014, 0.0089, 0.0222, respectively, when directly compared using two-tailed unpaired t test). DANG (comparison between no glucose and no glucose + uridine: ****P < 0.0001; 0.01 mM glucose and 0.01 mM glucose + uridine: ****P < 0.0001; 0.1 mM glucose and 0.1 mM glucose + uridine: **P = 0.0051; 1 mM glucose and 1 mM glucose + uridine: **P = 0.0051). ASPC1 (comparison between no glucose and no glucose + uridine: *P = 0.0203; 0.01 mM glucose and 0.01 mM glucose + uridine: **P = 0.0031; 0.1 mM glucose and 0.1 mM glucose + uridine: ***P = 0.0003; 1 mM glucose and 1 mM glucose + uridine: ****P < 0.0001). Statistical significance for data in c was measured using two-tailed unpaired t test and P = ns (0.0852, 0.3509, 0.3021 and 0.3875 for PATU8988S, CAPAN2, DANG and ASPC1, respectively, in the comparison of no uridine vs 0.1 mM uridine groups in the presence of 10 mM glucose). d. Uridine can be channeled into DNA or RNA synthesis by direct phosphorylation from UCK1/2. Uridine can also be catabolized via UPP1 to produce uracil and ribose 1-phosphate. Ribose 1-phosphate is converted to ribose-5-phosphate by PGM2 and fuel pentose phosphate pathway, nucleotide biosynthesis and glycolysis. e. Statistical significance was measured using two-tailed unpaired t test with Welch’s correction. Comparison between NT and PDA: PGM2, ****P < 0.0001; UCK1, ****P < 0.0001; UCK2, *P = 0.018. Box plot statistics – PGM2 (NT: minima = 3.097, maxima = 5.527, median = 4.335, 25th percentile = 3.992, 75th percentile = 4.74; PDA: minima = 2.386, maxima = 6.433, 25th percentile = 4.424, median = 4.961, 75th percentile = 5.457), UCK1 (NT: minima = 3.7, maxima = 5.1, median = 4.5, 25th percentile = 4.2, 75th percentile = 4.7; PDA: minima = 3.6, maxima = 5.1, median = 4.2, 25th percentile = 4, 75th percentile = 4.4), UCK2 (NT: minima = 4.034, maxima = 7.615, median = 5.577, 25th percentile = 5.095, 75th percentile = 5.9; PDA: minima = 4.556, maxima = 6.93, median = 5.727, 25th percentile = 5.458, 75th percentile = 6.059). f-h. Number of samples: TCGA – UPP1 low = 75, high = 75; CCLE – UPP1 low = 22, high = 22. Statistical significance was measured using two-tailed unpaired t test with Welch’s correction. Comparison between L and H groups in TCGA (PGM2: P = ns (0.1226), UCK1: P = ns (0.311); UCK2: *P = 0.0327). In the CCLE L versus H comparison, PGM2, UCK1 and UCK2 have P = ns (0.3486, 0.4645, 0.4381, respectively). TCGA – The Cancer Genome Atlas, CCLE – Cancer Cell Line Encyclopaedia. i. Vinculin is used as a loading control. j. Number of samples: qPCR = 3, RMA = 3 biologically independent samples per group. qPCR – statistical significance was measured using unpaired t test; comparison between siNT and siPGM2: ***P = 0.0007. RMA – statistical significance was measured using multiple unpaired t tests with two-stage two-step method; comparison of siNT and siPGM2 in the presence of 1 mM glucose and no uridine: *P = 0.0452, and **P = 0.0014 in the presence of 1 mM uridine and no glucose. k. Number of samples: qPCR = 3, RMA = 3 biologically independent samples per group. qPCR – statistical significance was measured using two-tailed unpaired t test; comparison between siNT and siUCK1: ***P = 0.0004. RMA – statistical significance was measured using multiple unpaired t tests with two-stage two-step method. Comparison of siNT and siUCK1 knockdown samples in the presence of 1 mM glucose and no uridine: P = ns (0.8652), and P = ns (0.131) in the presence of 1 mM uridine and no glucose. l. Number of samples: qPCR = 3, RMA = 3 biologically independent samples per group. qPCR – statistical significance was measured using unpaired t test; comparison between siNT and siUCK2: ****P < 0.0001. RMA – statistical significance was measured using multiple unpaired t tests with two-stage two-step method; comparison of siNT and siUCK1 knockdown cells in the presence of 1 mM glucose and no uridine: *P = 0.035, and P = ns (0.8653) in the presence of 1 mM uridine and no glucose. Data (a–c, f–h, j–l) are shown as mean ± s.d. The experiments were performed once (a–c, k), and twice (j,l) with similar results.
Extended Data Fig. 5
Extended Data Fig. 5. UPP1 mediates the liberation of uridine-derived ribose for central carbon metabolism.
a. Relative intracellular uridine level in the UPP1 knockout PATU8988S cells (after 24 h) and ASPC1 cells (6 h) compared to the wild type supplemented with 1 mM uridine in medium with 10% dialyzed FBS and no glucose. n = 3 biologically independent samples per group per cell line. Statistical significance was measured using one-way ANOVA with Dunnett’s multiple comparisons test. PATU8988S (intracellular uridine) – comparison between WT and 1A, ***P = 0.0002; comparison between WT and 1B, ****P < 0.0001. ASPC1 (intracellular uridine) – comparison between WT and 1A or 1B, ****P < 0.0001. b. Relative extracellular uridine and uracil in UPP1 knockout ASPC1 cells compared to the wild type supplemented with 1 mM uridine for 6 h in medium with 10% dialyzed FBS and no glucose. n = 3 biologically independent samples per group. Statistical significance was measured using one-way ANOVA with Dunnett’s multiple comparisons test. Extracellular uridine: comparison between WT and 1A or 1B, ****P < 0.0001; extracellular uracil: comparison between WT and 1A or 1B, ****P < 0.0001. c. Heatmaps of significantly altered intracellular metabolites (P < 0.05) in PATU8988S cells after 24 h (left) and ASPC1 after 6 h (right), as measured by LC-MS. Data used for the intracellular uridine/uracil plots (a-b) were extracted from this profiling study. d–k. Mass isotopologue distribution of 1 mM 13C5-uridine ribose-derived carbon into the indicated metabolic pathways in wildtype (WT) or UPP1-KO PATU8988S and ASPC1 cells. M – mass; ‘Others’ – indicate M other than M+0 or M+5, where applicable. 1A and 1B denote UPP1-KO sgRNA clones. Data (a–b, d–k) are shown as mean ± s.d. Metabolomics experiments were done once. Statistics and reproducibility: Abbreviations – ADP, adenosine diphosphate; ATP, adenosine triphosphate; AMP, adenosine monophosphate; GSSG, oxidized glutathione; NAD+ nicotinamide adenine dinucleotide; PEP, phosphoenolpyruvate; TCA cycle, tricarboxylic acid cycle; UDP-GlcNAc, uridine diphosphate N-acetylglucosamine; UMP, uridine monophosphate; UTP, uridine triphosphate.
Extended Data Fig. 6
Extended Data Fig. 6. UPP1 expression is elevated in PDA and other cancer types.
a. TCGA RNA seq data showing the expression of UPP1 and its paralog UPP2. FPKM, fragments per kilobase of exon per million mapped fragments. b. RNA seq showing UPP1 expression in various normal human tissues (Human Protein Atlas data), as obtained from the National Center for Biotechnology Information (NCBI) portal. c. Histological data showing UPP1 protein expression in normal pancreatic tissue compared to PDA. d. UPP1 expression in human non-PDA cancers accessed in publicly accessible datasets. e. Kaplan-Meier plot of survival probability (log-rank test) as obtained from KM-plotter (https://kmplot.com/analysis/) using the default parameters. f. Relative Metabolic Activity (RMA), reflecting NADH levels, in human non-PDA cancer cell lines supplemented with uridine (as indicated) in 1 mM glucose medium. n = 5 biologically independent samples per group per cell line. Statistical significance was measured using one-way ANOVA with Dunnett’s multiple comparisons test. A549 (lung cancer cell line, comparison between no uridine and 0.1 mM uridine, *P = 0.0405 or 1 mM uridine, ***P = 0.0004); HT1080 (fibrosarcoma cell line, comparison between no uridine and 0.1 mM uridine, P = ns (0.1773) or 1 mM uridine, ***P = 0.0001); HCT116 (colon cancer cell line, comparison between no uridine and 0.1 mM uridine, *P = 0.0294 or 1 mM uridine, **P = 0.0081); U2OS (osteosarcoma cell line, comparison between no uridine and 0.1 mM uridine, **P = 0.002 or 1 mM uridine, ****P < 0.0001). Statistics and reproducibility: a, n = 150 samples each. b. Sample size, n: salivary gland = 3, pancreas = 2, ovary = 2, skin = 3, prostate = 4, stomach = 3, kidney = 4, testis = 7, small intestine = 4, fat = 3, endometrium = 3, thyroid = 4, liver = 3, urinary bladder = 2, lymph node = 5, brain = 3, duodenum = 2, colon = 5, placenta = 4, heart = 4, spleen = 4, gall bladder = 3, lung = 5, adrenal = 3, appendix = 3, esophagus = 3, bone marrow = 4. RPKM, reads per kilobase of exon per million reads mapped. UPP1 expression in normal pancreas is extremely low (second lowest of the > 25 tissues compared). c. Data obtained from the Human Protein Atlas (URL for ‘Normal’ - https://www.proteinatlas.org/ENSG00000183696-UPP1/tissue/pancreas; PDA – https://www.proteinatlas.org/ENSG00000183696-UPP1/pathology/pancreatic+cancer#img). d. Sample size, n: NT = 19, tumour = 408 (bladder cancer, TCGA); NT = 5, tumour = 154 (glioblastoma, TCGA); NT = 44, tumour = 520 (head and neck cancer, TCGA); NT = 59, tumour = 551 (lung cancer, TCGA); NT = 11, tumour = 184 (oesophageal cancer, TCGA); NT = 52, tumour = 497 (prostate cancer, TCGA); NT = 41, tumour = 452 (colon cancer); health colon mucosa = 50, distant colon = 98, tumour = 98 (colon cancer, GSE44076). NT – non-tumour/adjacent normal tissue. Data (a-b, f) shown as mean ± s.d. The experiments were performed three times with similar results. Box plot statistics – TCGA, bladder carcinoma (primary: minima = 5.83, maxima = 13.5, median = 9.77, 25th percentile = 9.015, 75th percentile = 10.47; normal: minima = 6.61, maxima = 12.43, median = 8.35, 26th percentile = 8.03, 75th percentile = 9.59); glioblastoma multiforme (primary: minima = 5.71, maxima = 11.84, median = 9.585, 25th percentile = 8.79, 75th percentile = 10.143; normal: minima = 7.04, maxima = 7.63, median = 7.4, 25th percentile = 7.36, 75th percentile = 7.61); head and neck squamous cell carcinoma (primary: minima = 6.59, maxima = 15.64, median = 10.75, 25th percentile = 9.787, 75th percentile = 11.565; normal: minima = 6.38, maxima = 13.73, median = 10.42, 25th percentile = 8.672, 75th percentile = 11.065); lung adenocarcinoma (primary: minima = 6.45, maxima = 13.44, median = 9.8, 25th percentile = 9.13, 75th percentile = 10.49; normal: minima = 8.3, maxima = 11.39, median = 9.3, 25th percentile = 8.945, 75th percentile = 9.93); esophageal carcinoma (primary: minima = 6.7, maxima = 13.08, median = 9.26, 25th percentile = 8.578, 75th percentile = 10.21; normal: minima = 6.17, maxima = 12.39, median = 7.62, 25th percentile = 6.7, 75th percentile = 8.26); prostate adenocarcinoma (primary: minima = 3.96, maxima = 9.69, median = 6.58, 25th percentile = 5.98, 75th percentile = 7.14; normal: minima = 4.56, maxima = 8.62, median = 6.97, 25th percentile = 6.447, 75th percentile = 7.24); colon cancer (primary: minima = 6.41, maxima = 12.96, median = 8.535, 25th percentile = 8.068, 75th percentile = 9.07; normal: minima = 7.76, maxima = 11.29, median = 9.57, 25th percentile = 9.09, 75th percentile = 9.92). Colon cancer (GSE44076, primary: minima = 4.564, maxima = 7.608, median = 5.917, 25th percentile = 5.487, 75th percentile = 6.405; normal: minima = 4.568, maxima = 9.154, median = 7.18, 25th percentile = 6.781, 75th percentile = 7.824; healthy colon mucosal cells: minima = 5.884, maxima = 8.279, median = 7.529, 25th percentile = 7.153, 75th percentile = 7.74). Statistical significance was tested using two-sided Wilcoxon or Kruskal-Wallis tests.
Extended Data Fig. 7
Extended Data Fig. 7. UPP1 is expressed in PDA and TME cells and predicts survival outcome.
a. RNAscope images showing UPP1 expression in tumour (PDA) compared to the adjacent non-tumour tissues. Pan-cytokeratin (PanCK) indicates the tumour cells; DAPI, nuclear stain. The images are representative of three 20x acquisitions per tissue slide, and of two independent experiments. Scale bar indicates 100 µm. b. UMAP plot showing the expression of UPP1 at the transcript level, as determined by single cell RNA seq of PDA tissues from two patients (#1238 and 1302). c. Violin plots showing UPP1 expression in various tumour microenvironment cell types, including myeloid and epithelial cells where UPP1 is highest. Right, UMAP plot showing the specific cell compartments expressing UPP1 for all patients’ samples combined (n = 16). Data used in plots b-c are from a previously published dataset. d. Immunohistochemistry of UPP1 in patient biopsy sections from previously published tissue microarray. Micrographs are representative from 213 patient samples in the microarray and two independent experiments. Large scale bar indicates 100 µm; scale bar on insets indicates 25 µm. e. Kaplan-Meier plot showing survival probability (log-rank test) based on UPP1 expression in three separate datasets. Each dataset was split into two – UPP1 high and UPP1 low – based on the ranked UPP1 expression value. Sample size: low = 133, high = 134 (ICGC); low = 62, high = 63 (GSE71729), low = 73, high = 73 (TCGA). TME – tumour microenvironment.
Extended Data Fig. 8
Extended Data Fig. 8. KRAS-MAPK pathway activation and nutrient availability drive UPP1 expression.
a. Normalized UPP1 protein expression in Kras wildtype and mutant cell lines based on CCLE protein data accessed via the DepMap portal. b. Upp1 mRNA expression in iKras* orthotopic tumours and cell lines from dataset GSE32277. c-d. Western blot showing UPP1 expression in human PDA cell lines c) ASPC1 cells and d) DANG and PATU8988S after 24 h culture +/– trametinib [MEK inhibitor], uridine, or glucose. kDa, unit for molecular weight. e. qPCR for UPP1 in human PDA cell lines DANG and PATU8988S treated for 24 h with trametinib (1 µM), uridine (1 mM), or 5 mM glucose. f. Western blot showing pERK upon treatment of murine iKras 9805 cells for 24 h with trametinib or doxycycline (1 µg/mL). g. qPCR for Upp1 in iKras* 9805 mouse PDA cells, 24 h after treatment with trametinib or doxycycline (1 µg/mL). h. qPCR for UPP1 in ASPC1 cells treated for 48 h with trametinib and at 0.1 mM uridine or 1 mM glucose concentrations. i. Western blot for UPP1 and pERK treated for 48 h with trametinib and low glucose [1 mM] and near physiological uridine concentration [0.1 mM]. j. Densitometric quantification of pERK and UPP1 in the ASPC1 blots shown in Fig. 3n. k. Metabolomics profiling showing the spectrum of metabolic changes induced in ASPC1 upon pERK inhibition with trametinib [1 µM], 24 h after culture. l. MTT assay showing relative proliferation of PDA cell lines treated with 1.25 μM trametinib [MEK inhibitor] +/− 1 mM uridine in the presence of glucose [5 mM] at 96 h. Statistics and reproducibility: a, Sample size – wild type 0 and mutation 1: 304 and 69 (pan-cancer), 15 and 15 (colon cancer), 54 and 25 (lung cancer). Box plot statistics – pan-cancer (KRAS = 0: minima = −4.8237, maxima = 4.8004, median = −0.3029, 25th percentile = −1.3212, 75th percentile = 0.7687; minima = −2.1805, maxima = 3.7445, median = −0.3019, 25th percentile = −0.815, 75th percentile = 1.2867), colon (KRAS = 0: minima = −2.3253, maxima = 3.1201, median = -0.5127, 25th percentile = −0.8908, 75th percentile = −0.0958; KRAS = 1: minima = −2.1805, maxima = 0.2672, median = −0.9153, 25th percentile = −1.3926, 75th percentile = −0.5595), lung (KRAS = 0: minima = −2.7979, maxima = 4.0884, median = 0.4201, 25th percentile = -1.305, 75th percentile = 0.6032; KRAS = 1: minima = −0.9357, maxima = 3.7445, median = 0.8446, 25th percentile = −0.4923, 75th percentile = 1.3752). b. Sample size: tumours (Kras_OFF = 9, Kras_ON = 10), cell lines (Kras_OFF = 5, Kras_ON = 5). Statistical significance was measured using two-tailed unpaired t test. Comparison of Kras_OFF to Kras_ON: **P = 0.0088 (tumours) and *P = 0.0244 (cell lines). c-d. pERK is used as a readout for MAPK pathway induction/activity. ERK and Vinculin are used as loading controls. Blots are representative of two biological and technical replicates for ASPC1 and one biological replicate for PATU8988S and DANG with similar results. e. n = 3 biologically independent samples per group. Statistical significance was measured with one-way ANOVA with Tukey’s multiple comparisons test. Comparisons between groups for DANG (from left to right): P = ns (0.9097), P = ns (0.5014), **P = 0.0025 and ****P < 0.0001. Comparisons between groups for PATU8988S (from left to right): ***P = 0.0002, ***P = 0.001, ****P < 0.0001 and ****P < 0.0001. f. Vinculin is used as a loading control. g. n = 3 biologically independent samples per group. Statistical significance was measured with one-way ANOVA with Dunnett’s multiple comparisons test. Comparison between (–) and (+) doxycycline, ****P < 0.0001. Comparison between (–) doxycycline: vs 10 µM trametinib, P = ns (0.9997); 10 µM trametinib + doxycycline, P = ns (0.8226); 1 µM trametinib, P = ns (0.9997); 1 µM trametinib + doxycycline, P = ns (0.9994); 0.1 µM trametinib, P = ns (0.1904); 0.1 µM trametinib + doxycycline, P = ns (>0.9999). h. n = 3 biologically independent samples per group. Statistical significance was measured with one-way ANOVA with Tukey’s multiple comparisons test. Comparisons between groups (from left to right): ****P < 0.0001, ****P < 0.0001, ****P < 0.0001 and ****P < 0.0001. The experiments (e, g, h) were performed once with similar results on UPP1 displayed by the three cell lines. i. n = 3 biologically independent samples per group. This blot was run on the same gel as Fig. 3n hence the first two columns (separated by a box) overlap between the two blots. j. Blots (c,i) are representative of two independent experiments; blot e experiment was done once. k. n = 3 biologically independent samples per group. The statistical significance (P < 0.05) was determined using limma package version 3.38.3 in R. l. Statistical significance was measured using one-way ANOVA with Tukey’s multiple comparisons test. n = 4 biologically independent samples per group. PATU8988S (comparison between cells cultured with and without trametinib in the absence of uridine: ****P < 0.0001, and with uridine supplementation: ****P < 0.0001); DANG (comparison between cells cultured with and without trametinib in the absence of uridine: **P = 0.0055, and with uridine supplementation: ***P = 0.0009); ASPC1 (comparison between cells cultured with and without trametinib in the absence of uridine: P = not significant, and with uridine supplementation: ****P = 0.0006). Data (b, e, g-h, l) shown as mean ± s.d.
Extended Data Fig. 9
Extended Data Fig. 9. Regulation of UPP1 expression is independent of c-MYC.
a. Western blot showing Myc inhibition by 10058-F4 in ASPC1 cells after 24 h of culture. On the right: UPP1 mRNA expression determined by qPCR. kDa, unit for molecular weight. b. Western blot of Myc inhibition by Fedratinib in ASPC1 cells after 24 h of culture. On the right: UPP1 mRNA expression determined by qPCR. c. CiiDER analysis of transcription factor binding sites in the promoters of mouse and human UPP1. Myc binding sites were not detected. Details of analysis is in the “Methods” section. d. qPCR showing UPP1 expression upon uridine supplementation with or without basal glucose concentration in culture medium. e. RNA seq data showing the expression of Upp1 in sorted tumour cells and in KPC cells cultured in vitro in regular RPMI culture medium or tumour interstitial fluid medium (TIFM). Sample sizes: Tumour, n = 6, RPMI, n = 3 biologically independent cell samples, TIFM, n = 3 biologically independent cell samples. Normalized by log transformation [log2 (count +1)]. Statistical significance was measured using one-way ANOVA with Dunnett’s multiple comparisons test. Comparison between RPMI and TIFM group, ****P < 0.0001 or tumour group, ****P < 0.0001. Statistics and reproducibility: a, qPCR, n = 3 biologically independent samples per group. b. n = 3 biologically independent samples per group. Blots shown (a-b) are representative of two biological and technical replicate analyses with similar results. d. n = 3 biologically independent samples per group per cell line. Statistical significance was measured using one-way ANOVA with Tukey’s multiple comparisons test. PATU8988S (comparison between no glucose and no glucose + 1 mM uridine: P = ns (0.994); comparison between cells cultured in glucose-containing medium with and without uridine: **P = 0.005); comparison between no glucose and glucose: *P = 0.0316; CAPAN2 (comparison between no glucose and no glucose + 1 mM uridine: ****P < 0.0001; comparison between cells cultured in glucose-containing medium with and without uridine: P = ns (0.8688); DANG (comparison between no glucose and no glucose + 1 mM uridine: ****P < 0.0001; comparison between cells cultured in glucose-containing medium with and without uridine: *P = 0.0021); ASPC1 (comparison between no glucose and no glucose + 1 mM uridine: ****P < 0.0001; comparison between cells cultured in glucose-containing medium with and without uridine: P = ns (0.5339). Comparison between no glucose and glucose for CAPAN2, DANG and ASPC1: ****P < 0.0001. Data (a,b,d,e) shown as mean ± s.d.
Extended Data Fig. 10
Extended Data Fig. 10. Knockout of UPP1 suppresses in vivo uridine catabolism and tumour growth.
a. LC-MS analysis of extracellular uridine and uracil in unpolarized bone marrow-derived macrophages (M0; 10 ng/mL M-CSF), those polarized toward an M1 fate (10 ng/mL LPS), an M2 fate (10 ng/mL murine IL-4), or a tumour-educated (TEM) phenotype with 75% PDA conditioned medium and compared to growth medium (DMEM). n = 3 biologically independent samples per group. Data was extracted from a previously published metabolomics. b. Relative uracil abundance in plasma, tumour interstitial fluid (TIF), and bulk tumour from the experiment described in Fig. 4a, where Clod + Ab indicates the macrophage-depleted group. c. Extracellular (left) and intracellular (right) profiles of significantly changed (P < 0.05) metabolites from sgV and UPP1-KO (sg1, sg3) MT3-2D cells. The cells were cultured in medium with 1 mM uridine and no glucose for 24 h, as determined by metabolomics. d. Proliferation assay of sgVector (sgV) and UPP1-KO (sg1, sg3) MT3-2D and KPC 7940b mouse PDA cell lines cultured over 72 h and 96 h, respectively, in normal growth medium with 10% dialyzed FBS. e. Tumour weight and photograph and bulk tumour uridine and uracil from the orthotopic implantation of sgV and UPP1-KO (sg3) KPC 7940b cell lines into C57BL/6J mice; see Fig. 4i for experimental details. f,g. Tumour metabolomics profile indicating statistically significant (P < 0.05) metabolites from sgV and UPP1-KO f) KPC 7940b and g) MT3-2D-derived tumours. h. Immunohistochemistry (IHC) staining of macrophages (F4/80), large blood vessels (CD31+), and cytotoxic cells (CD8) using tissue sections of MT3-2D orthotopic tumours. Micrographs are representative of 10 fields per image obtained per experiment group. Scale bar 500 µm. On the right is the respective quantification of each IHC stain. Statistics and reproducibility: a, Statistical significance was measured using one-way ANOVA and Dunnett’s multiple comparisons test. Uridine – DMEM: comparison to M0 Mac group ****P < 0.0001; to M1 Mac group P = ns (0.0758); to M2 Mac group ****P < 0.0001; to TEM group ****P < 0.0001. Uracil – DMEM: comparison to M0 Mac P=ns (0.5476); to M1 Mac group ****P < 0.0001; to M2 Mac group P=ns (0.9894); to TEM group ****P < 0.0001. b. Statistical significance was measured using a two-tailed unpaired t-test – Plasma uracil **P = 0.0045 with n = 8 biologically independent replicates in both groups, TIF uracil P = ns (0.6872) with n = 8 biologically independent replicates in both groups– and using Welch’s t-test P=ns (0.9682) with n = 8 biologically independent replicates in both groups. c. n = 3 biologically independent samples per group. Color scale denotes fold change. Below: Venn diagram showing overlapping metabolites that accumulated in both human (PATU8988S and ASPC1) and mouse (MT3-2D) cell lines upon UPP1 knockout. d. MT3-2D, n = 4 and KPC 7940b, n = 3 biologically independent samples per group. e. n = 8 biologically independent samples per group. Statistical significance measured using two-tailed unpaired t-test with Welch’s correction, **P = 0.0059. On the right: bulk tumour uridine and uracil as measured using metabolomics. Sample size: sgV = 8, sg3 = 7. Uridine: ****P < 0.0001. Uracil: ****P < 0.0001. f,g. Sample size: KPC 7940b sgV = 8 and sg3 = 7, MT3-2D sgV = 5 sg1 = 6 and sg3 = 6 biologically independent samples from mice with orthotopic pancreatic tumours. h. Sample size: F4/80 sgV = 7, sg1 = 6, sg3 = 5; CD31 n = 6 per group; CD8+ sgV = 6, sg1 = 5, sg3 = 6, all biologically independent samples per group. Statistical significance was measured using one-way ANOVA with Dunnett’s multiple comparisons test. Comparison between % F4/80 sgV and sg1 P = ns (>0.9968), and sgV and sg3 P = ns (0.9583). Data (a, b, d, e) shown as mean ± s.d; horizontal bars in h represent mean value.

Comment in

  • Uridine: as sweet as sugar for some cells?
    Ward MH, Nwosu ZC, Lyssiotis CA. Ward MH, et al. Cell Res. 2023 Dec;33(12):898-899. doi: 10.1038/s41422-023-00860-w. Cell Res. 2023. PMID: 37567975 Free PMC article. No abstract available.

References

    1. Singhi AD, Koay EJ, Chari ST, Maitra A. Early detection of pancreatic cancer: opportunities and challenges. Gastroenterology. 2019;156:2024–2040. doi: 10.1053/j.gastro.2019.01.259. - DOI - PMC - PubMed
    1. Wood LD, Canto MI, Jaffee EM, Simeone DM. Pancreatic cancer: pathogenesis, screening, diagnosis, and treatment. Gastroenterology. 2022;163:386–402.e1. doi: 10.1053/j.gastro.2022.03.056. - DOI - PMC - PubMed
    1. Ho WJ, Jaffee EM, Zheng L. The tumour microenvironment in pancreatic cancer—clinical challenges and opportunities. Nat. Rev. Clin. Oncol. 2020;17:527–540. doi: 10.1038/s41571-020-0363-5. - DOI - PMC - PubMed
    1. DuFort CC, DelGiorno KE, Hingorani SR. Mounting pressure in the microenvironment: fluids, solids, and cells in pancreatic ductal adenocarcinoma. Gastroenterology. 2016;150:1545–1557.e2. doi: 10.1053/j.gastro.2016.03.040. - DOI - PMC - PubMed
    1. Encarnación-Rosado J, Kimmelman AC. Harnessing metabolic dependencies in pancreatic cancers. Nat. Rev. Gastroenterol. Hepatol. 2021;18:482–492. doi: 10.1038/s41575-021-00431-7. - DOI - PMC - PubMed

Publication types