

Using cognitive load theory to evaluate and improve preparatory materials and study time for the flipped classroom
- PMID: 37198639
- PMCID: PMC10193725
- DOI: 10.1186/s12909-023-04325-x
Using cognitive load theory to evaluate and improve preparatory materials and study time for the flipped classroom
Abstract
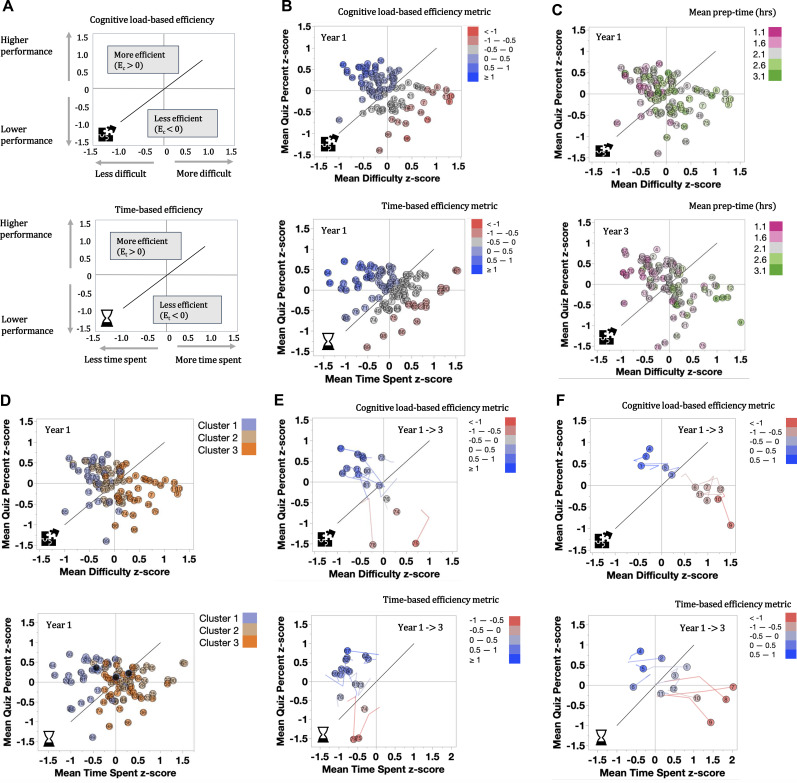
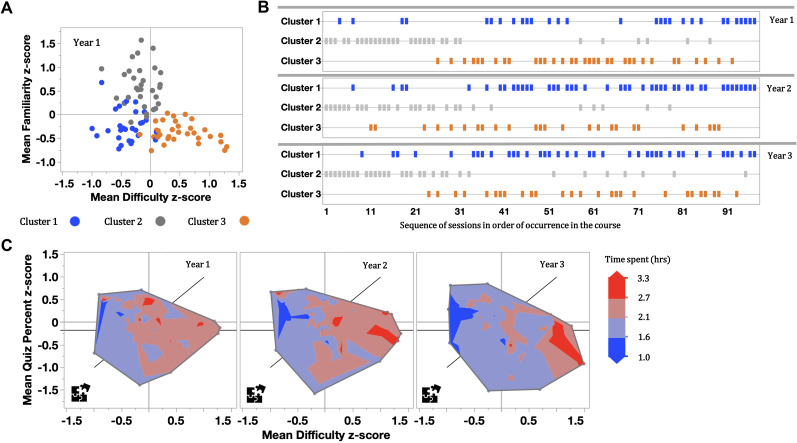
Background: Preclinical medical education is content-dense and time-constrained. Flipped classroom approaches promote durable learning, but challenges with unsatisfactory student preparation and high workload remain. Cognitive load theory defines instructional design as "efficient" if learners can master the presented concepts without cognitive overload. We created a PReparatory Evaluation Process (PREP) to systematically assess and measure improvement in the cognitive-load efficiency of preparatory materials and impact on study time (time-efficiency).
Methods: We conducted this study in a flipped, multidisciplinary course for ~ 170 first year students at Harvard Medical School using a naturalistic post-test design. For each flipped session (n = 97), we assessed cognitive load and preparatory study time by administering a 3-item PREP survey embedded within a short subject-matter quiz students completed before class. Over three years (2017-2019), we evaluated cognitive load- and time- based efficiency to guide iterative revisions of the materials by content experts. The ability of PREP to detect changes to the instructional design (sensitivity) was validated through a manual audit of the materials.
Results: The average survey response rate was ≥ 94%. Content expertise was not required to interpret PREP data. Initially students did not necessarily allocate the most study time to the most difficult content. Over time, the iterative changes in instructional design increased the cognitive load- and time-based efficiency of preparatory materials with large effect sizes (p < .01). Furthermore, this increased the overall alignment of cognitive load with study time: students allocated more time to difficult content away from more familiar, less difficult content without increasing workload overall.
Conclusions: Cognitive load and time constraints are important parameters to consider when designing curricula. The PREP process is learner-centered, grounded in educational theory, and works independently of content knowledge. It can provide rich and actionable insights into instructional design of flipped classes not captured by traditional satisfaction-based evaluations.
Keywords: Cognitive load theory; Educational quality improvement; Efficiency; Flipped classroom; Instructional design.
© 2023. The Author(s).
Conflict of interest statement
The authors declare that they have no competing interests.
Figures
Similar articles
-
Flipping around the classroom: Accelerated Bachelor of Science in Nursing students' satisfaction and achievement.Nurse Educ Today. 2017 Sep;56:41-46. doi: 10.1016/j.nedt.2017.06.003. Epub 2017 Jun 19. Nurse Educ Today. 2017. PMID: 28654815
-
Examining the effects of student-centered flipped classroom in physiology education.BMC Med Educ. 2023 Apr 12;23(1):233. doi: 10.1186/s12909-023-04166-8. BMC Med Educ. 2023. PMID: 37046277 Free PMC article. Clinical Trial.
-
Flipped Classroom Use in Veterinary Education: A Multinational Survey of Faculty Experiences.J Vet Med Educ. 2019 Spring;46(1):97-107. doi: 10.3138/jvme.0517-058r1. Epub 2018 Nov 12. J Vet Med Educ. 2019. PMID: 30418806
-
Impact of blended learning on learning outcomes in the public healthcare education course: a review of flipped classroom with team-based learning.BMC Med Educ. 2021 Jan 28;21(1):78. doi: 10.1186/s12909-021-02508-y. BMC Med Educ. 2021. PMID: 33509176 Free PMC article. Review.
-
Flipped classroom: Challenges and benefits of using social media in English language teaching and learning.Front Psychol. 2022 Sep 23;13:996294. doi: 10.3389/fpsyg.2022.996294. eCollection 2022. Front Psychol. 2022. PMID: 36211927 Free PMC article. Review.
Cited by
-
Effective and Engaging Active Learning in the Medical School Classroom: Lessons from Case-Based Collaborative Learning.J Med Educ Curric Dev. 2025 Jan 28;12:23821205251317149. doi: 10.1177/23821205251317149. eCollection 2025 Jan-Dec. J Med Educ Curric Dev. 2025. PMID: 39877674 Free PMC article.
-
Training for the future of the genetic counseling profession: Exploring the assessment and adaptation of graduate programs' didactic curriculum.J Genet Couns. 2025 Feb;34(1):e2023. doi: 10.1002/jgc4.2023. J Genet Couns. 2025. PMID: 39828963 Free PMC article.
-
Reducing Nurses' Barriers to Reporting Adverse Events Using a WeChat-Based Cognitive Load Training Platform: An Open-Label, Randomized Controlled Trial.Risk Manag Healthc Policy. 2025 Mar 21;18:947-961. doi: 10.2147/RMHP.S482233. eCollection 2025. Risk Manag Healthc Policy. 2025. PMID: 40134523 Free PMC article.
-
Mediator effects of cognitive load on the relationship between task complexity and guideline adherence among clinical nurses: a cross-sectional survey of nurses in China.J Res Nurs. 2025 Aug 7:17449871251329197. doi: 10.1177/17449871251329197. Online ahead of print. J Res Nurs. 2025. PMID: 40787650 Free PMC article.
References
MeSH terms
LinkOut - more resources
Full Text Sources
Miscellaneous
