. 2023 May 17;11(1):82.
doi: 10.1186/s40478-023-01578-x.

Senescence-related impairment of autophagy induces toxic intraneuronal amyloid-β accumulation in a mouse model of amyloid pathology

Affiliations

Senescence-related impairment of autophagy induces toxic intraneuronal amyloid-β accumulation in a mouse model of amyloid pathology

Nuria Suelves et al. Acta Neuropathol Commun. .

Abstract

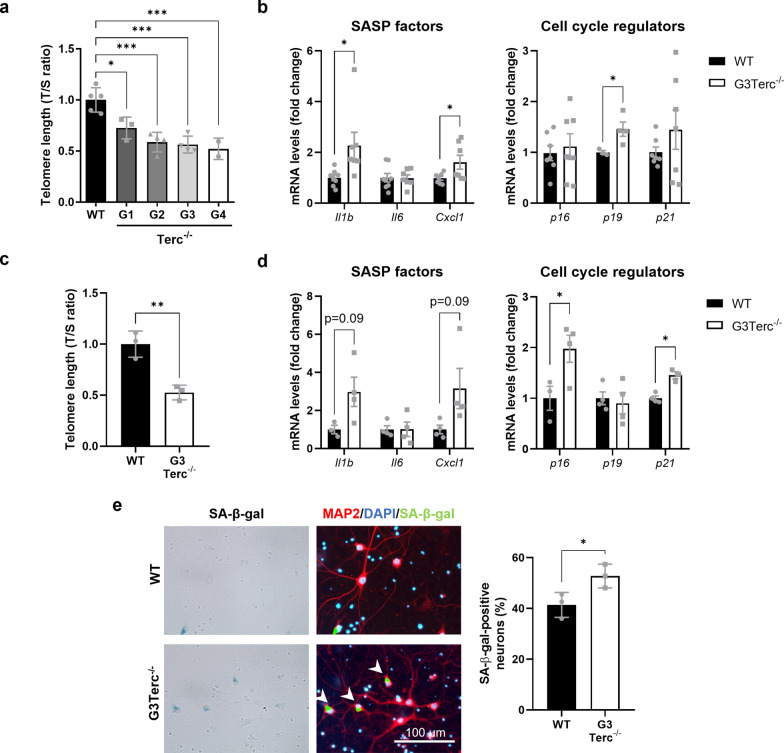
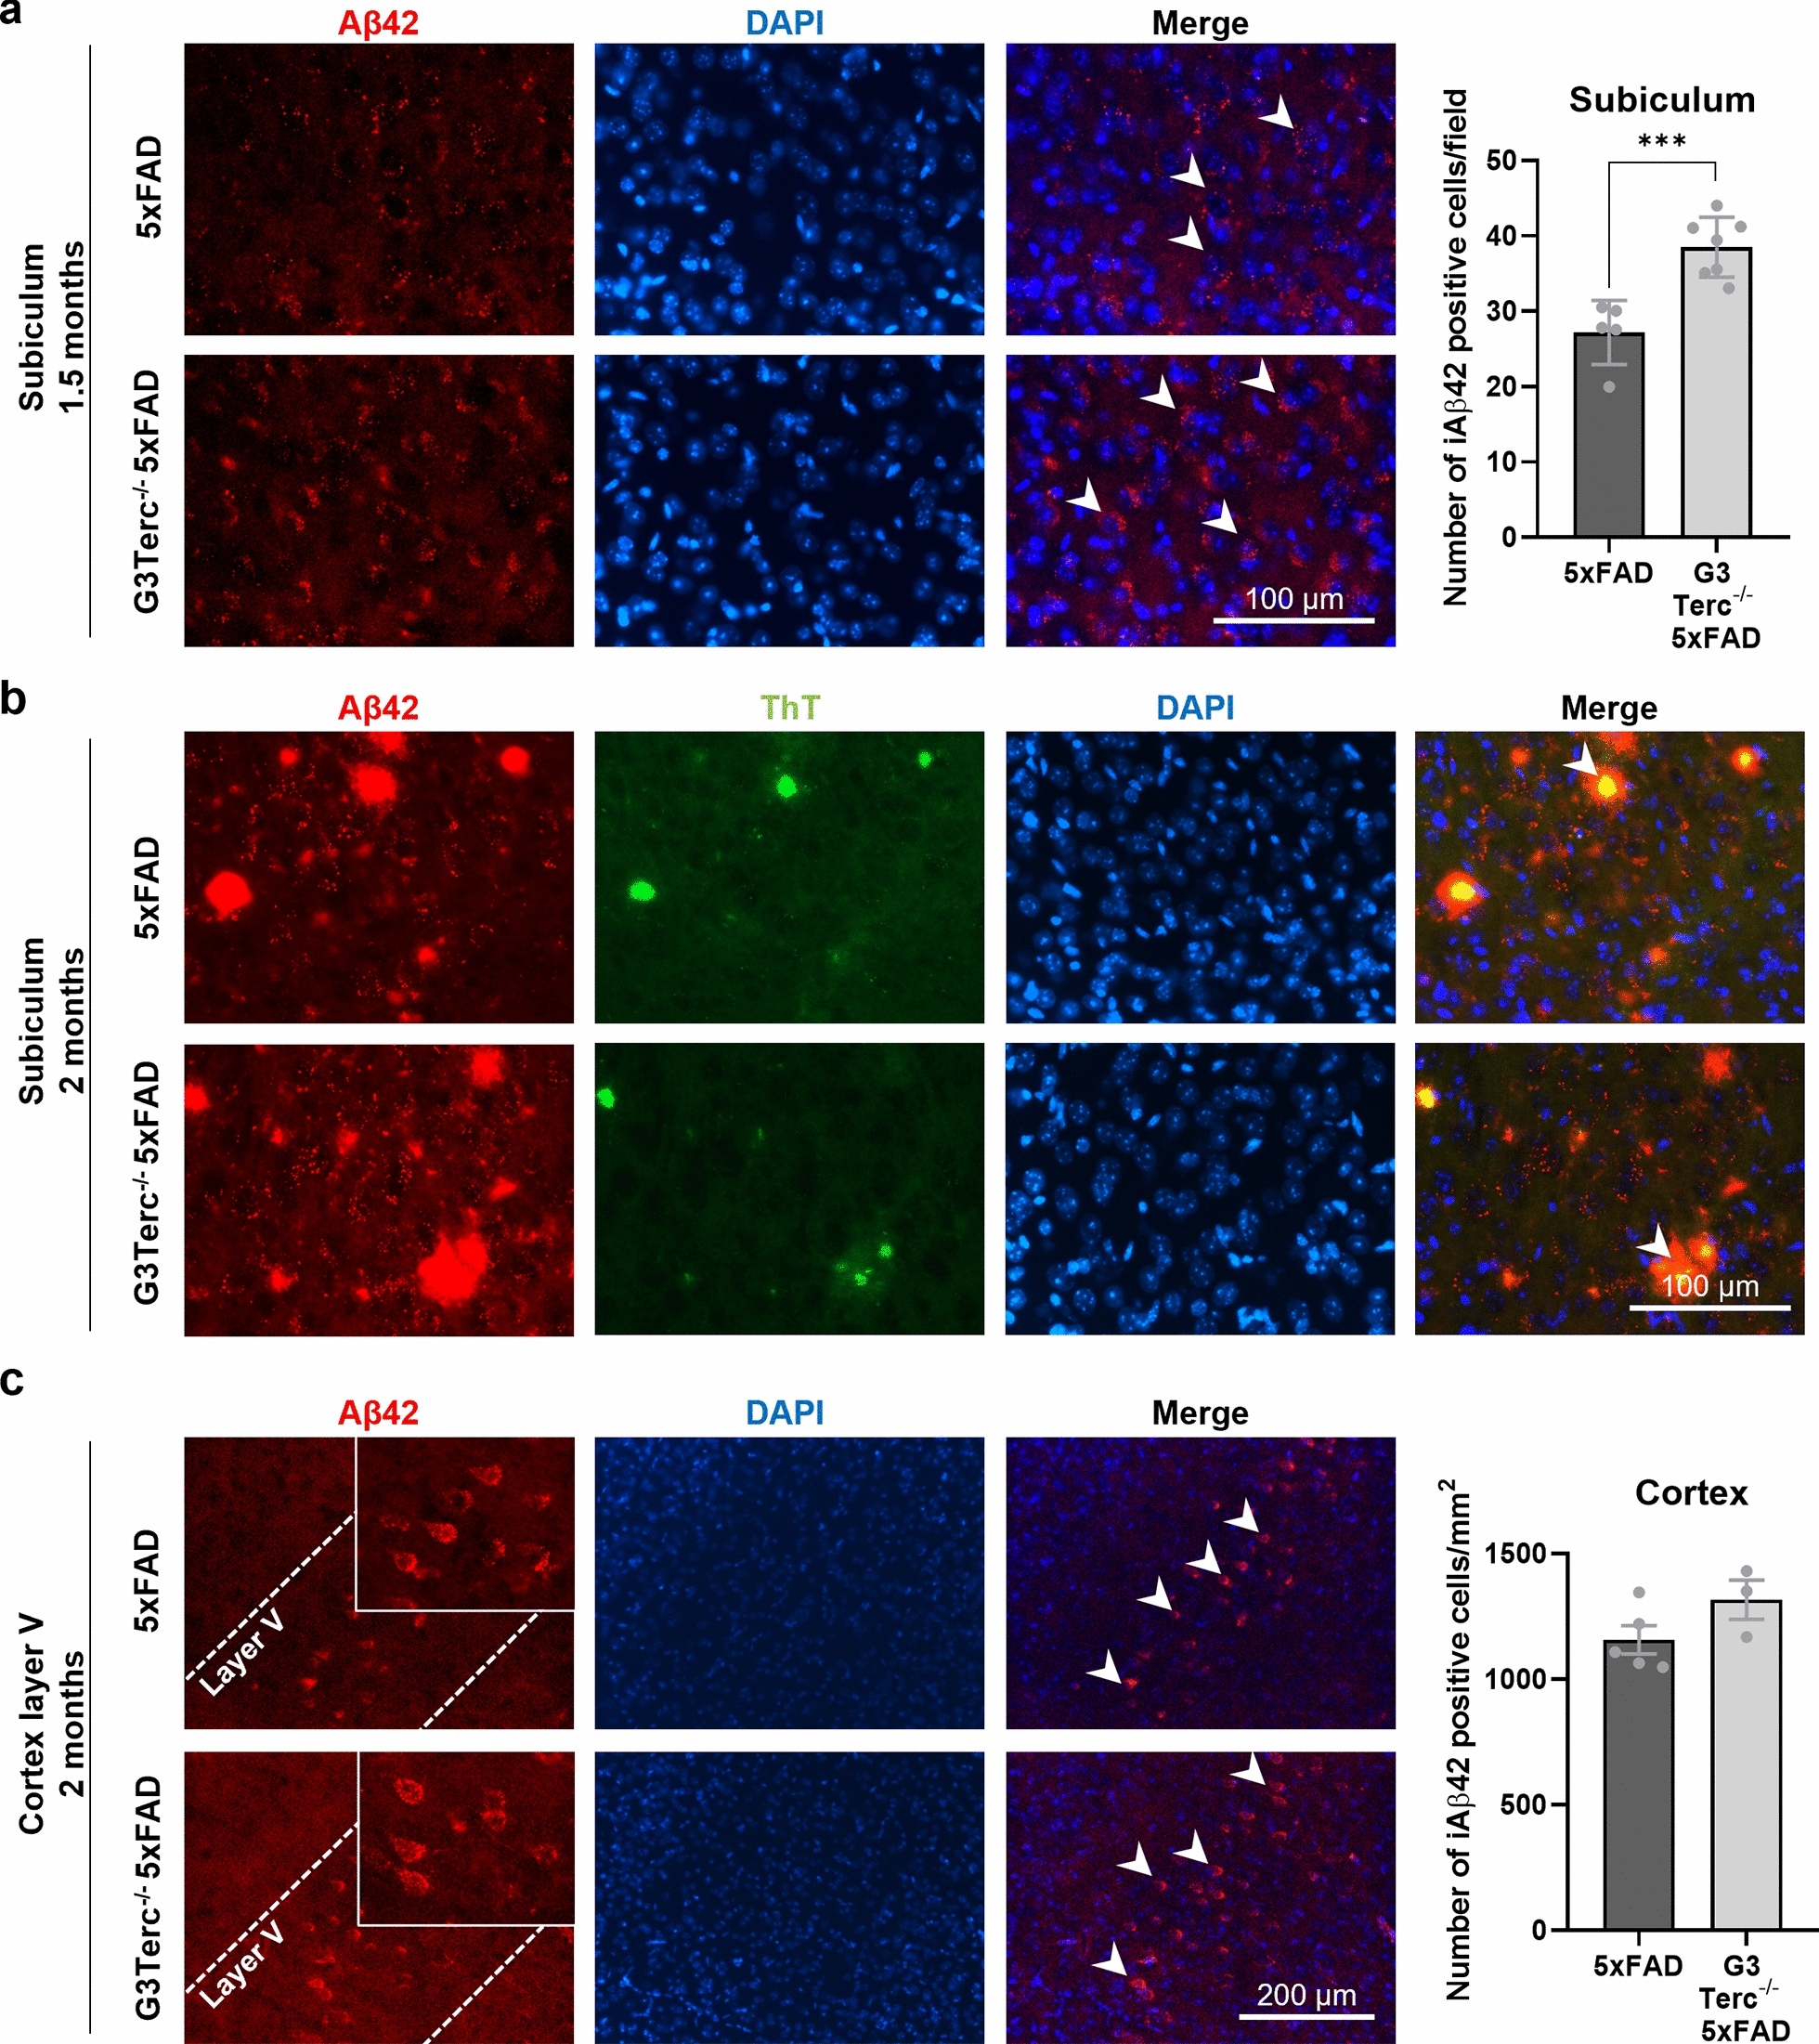
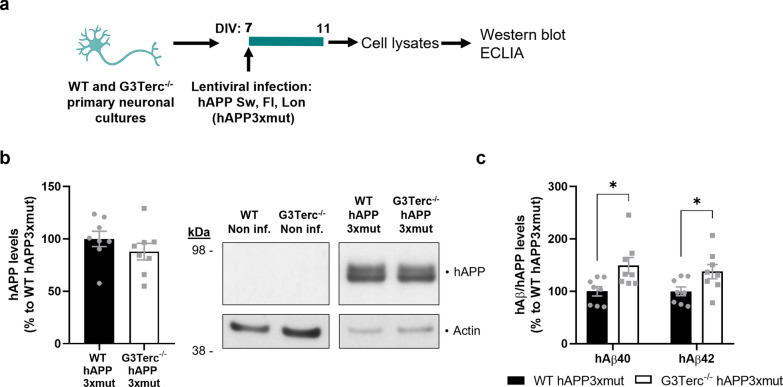
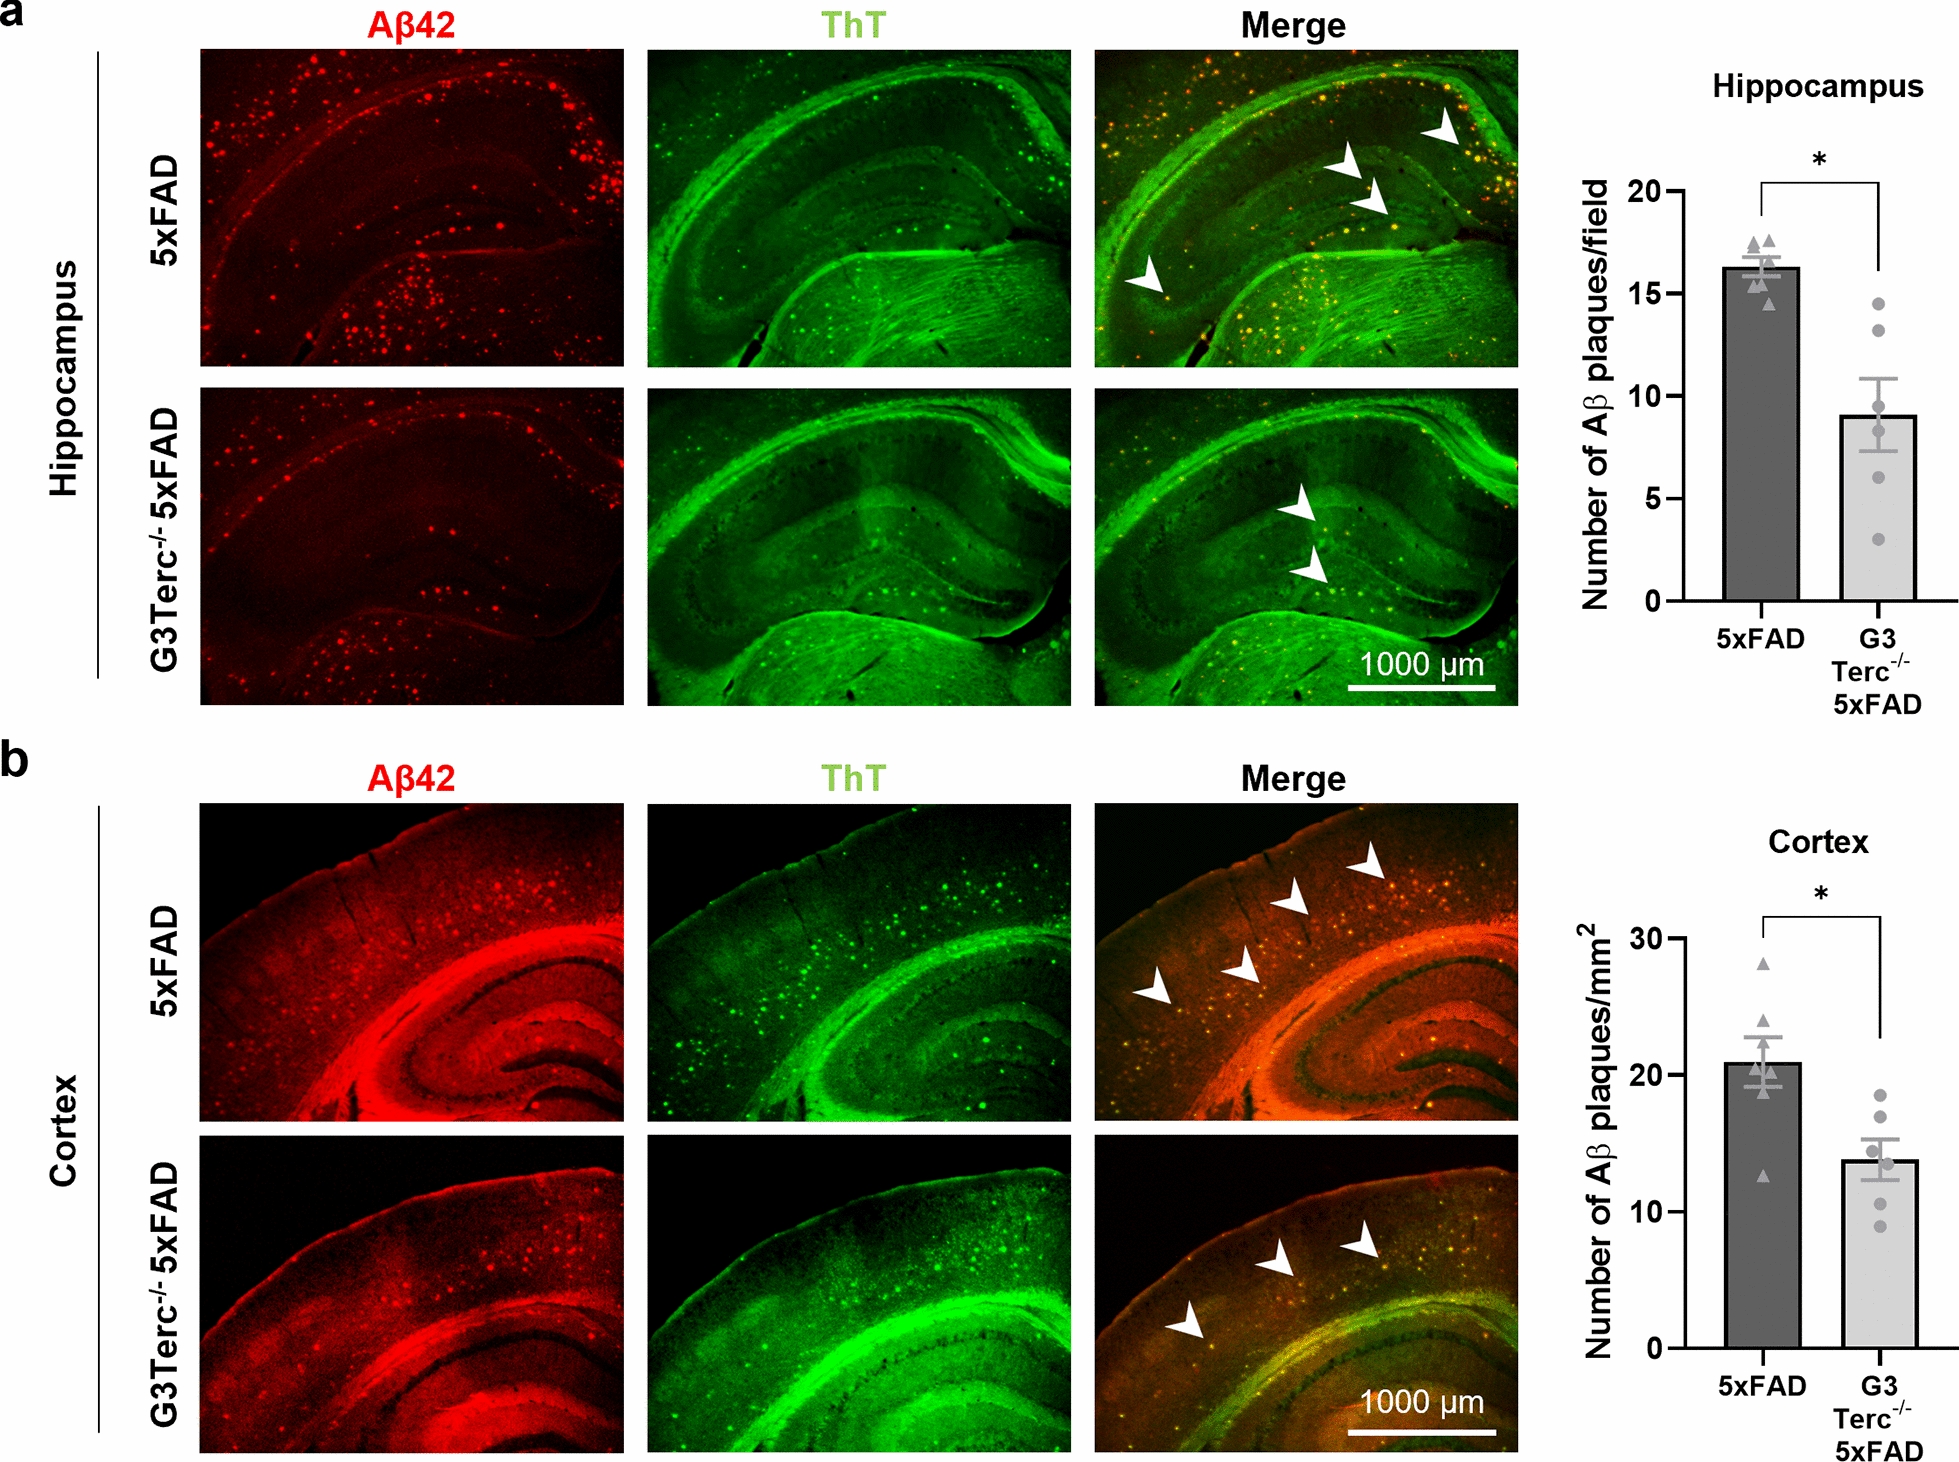
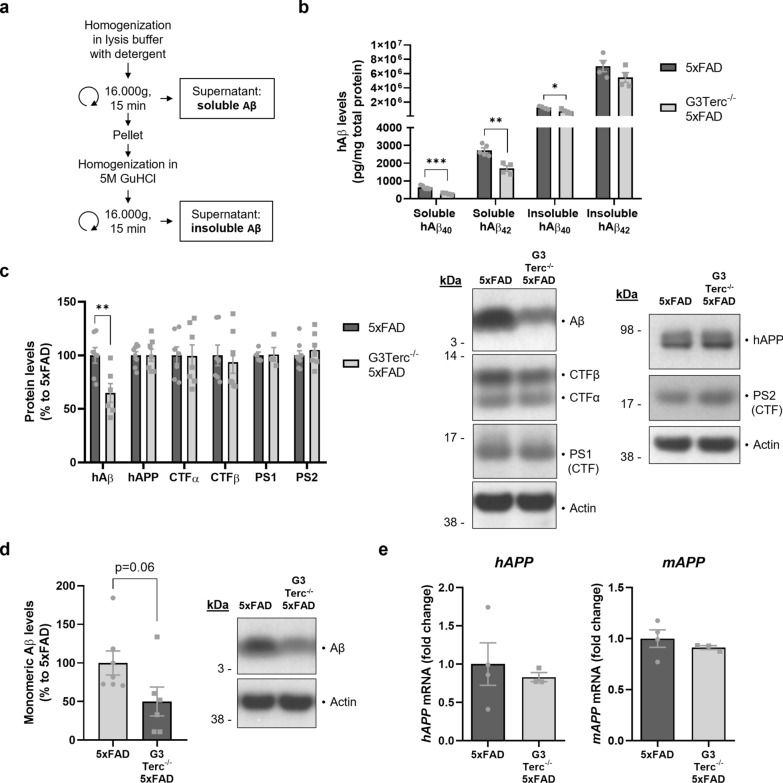
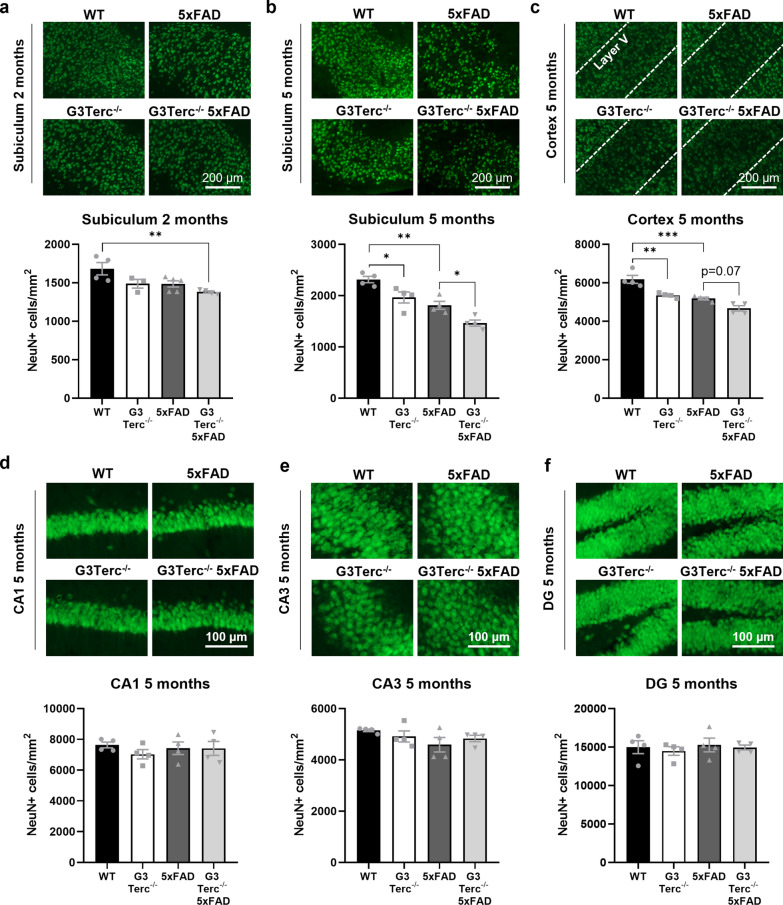
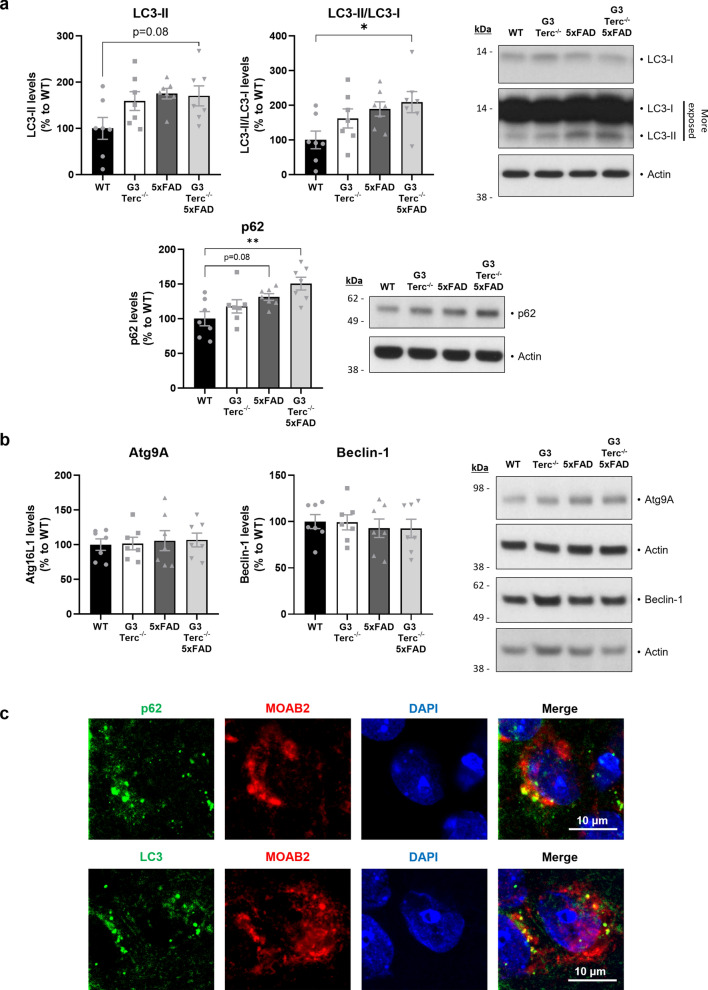
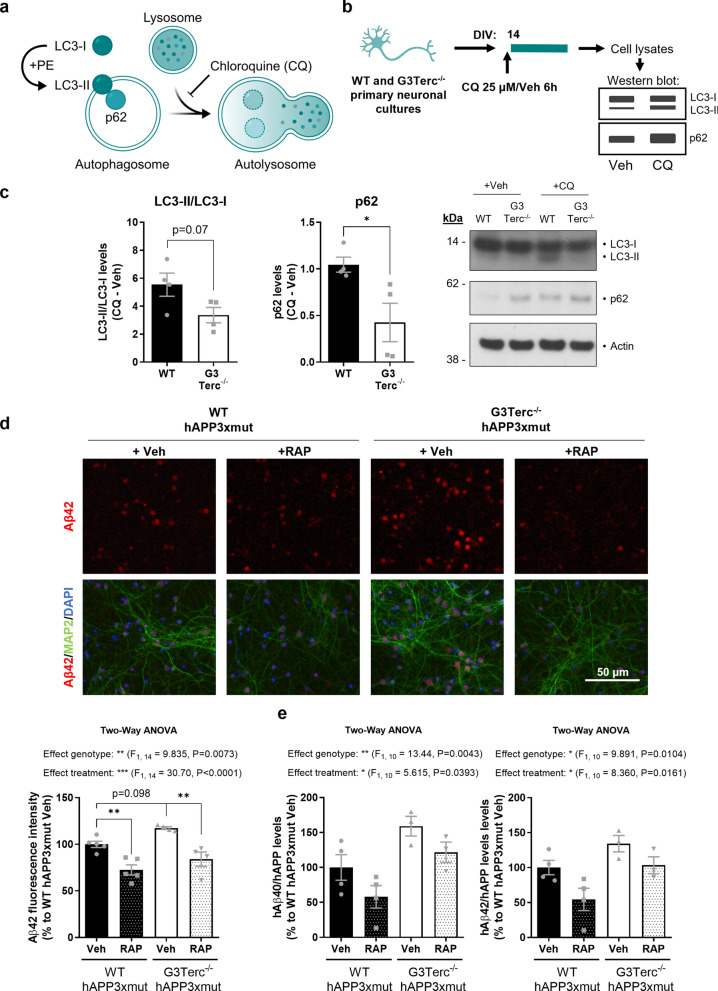
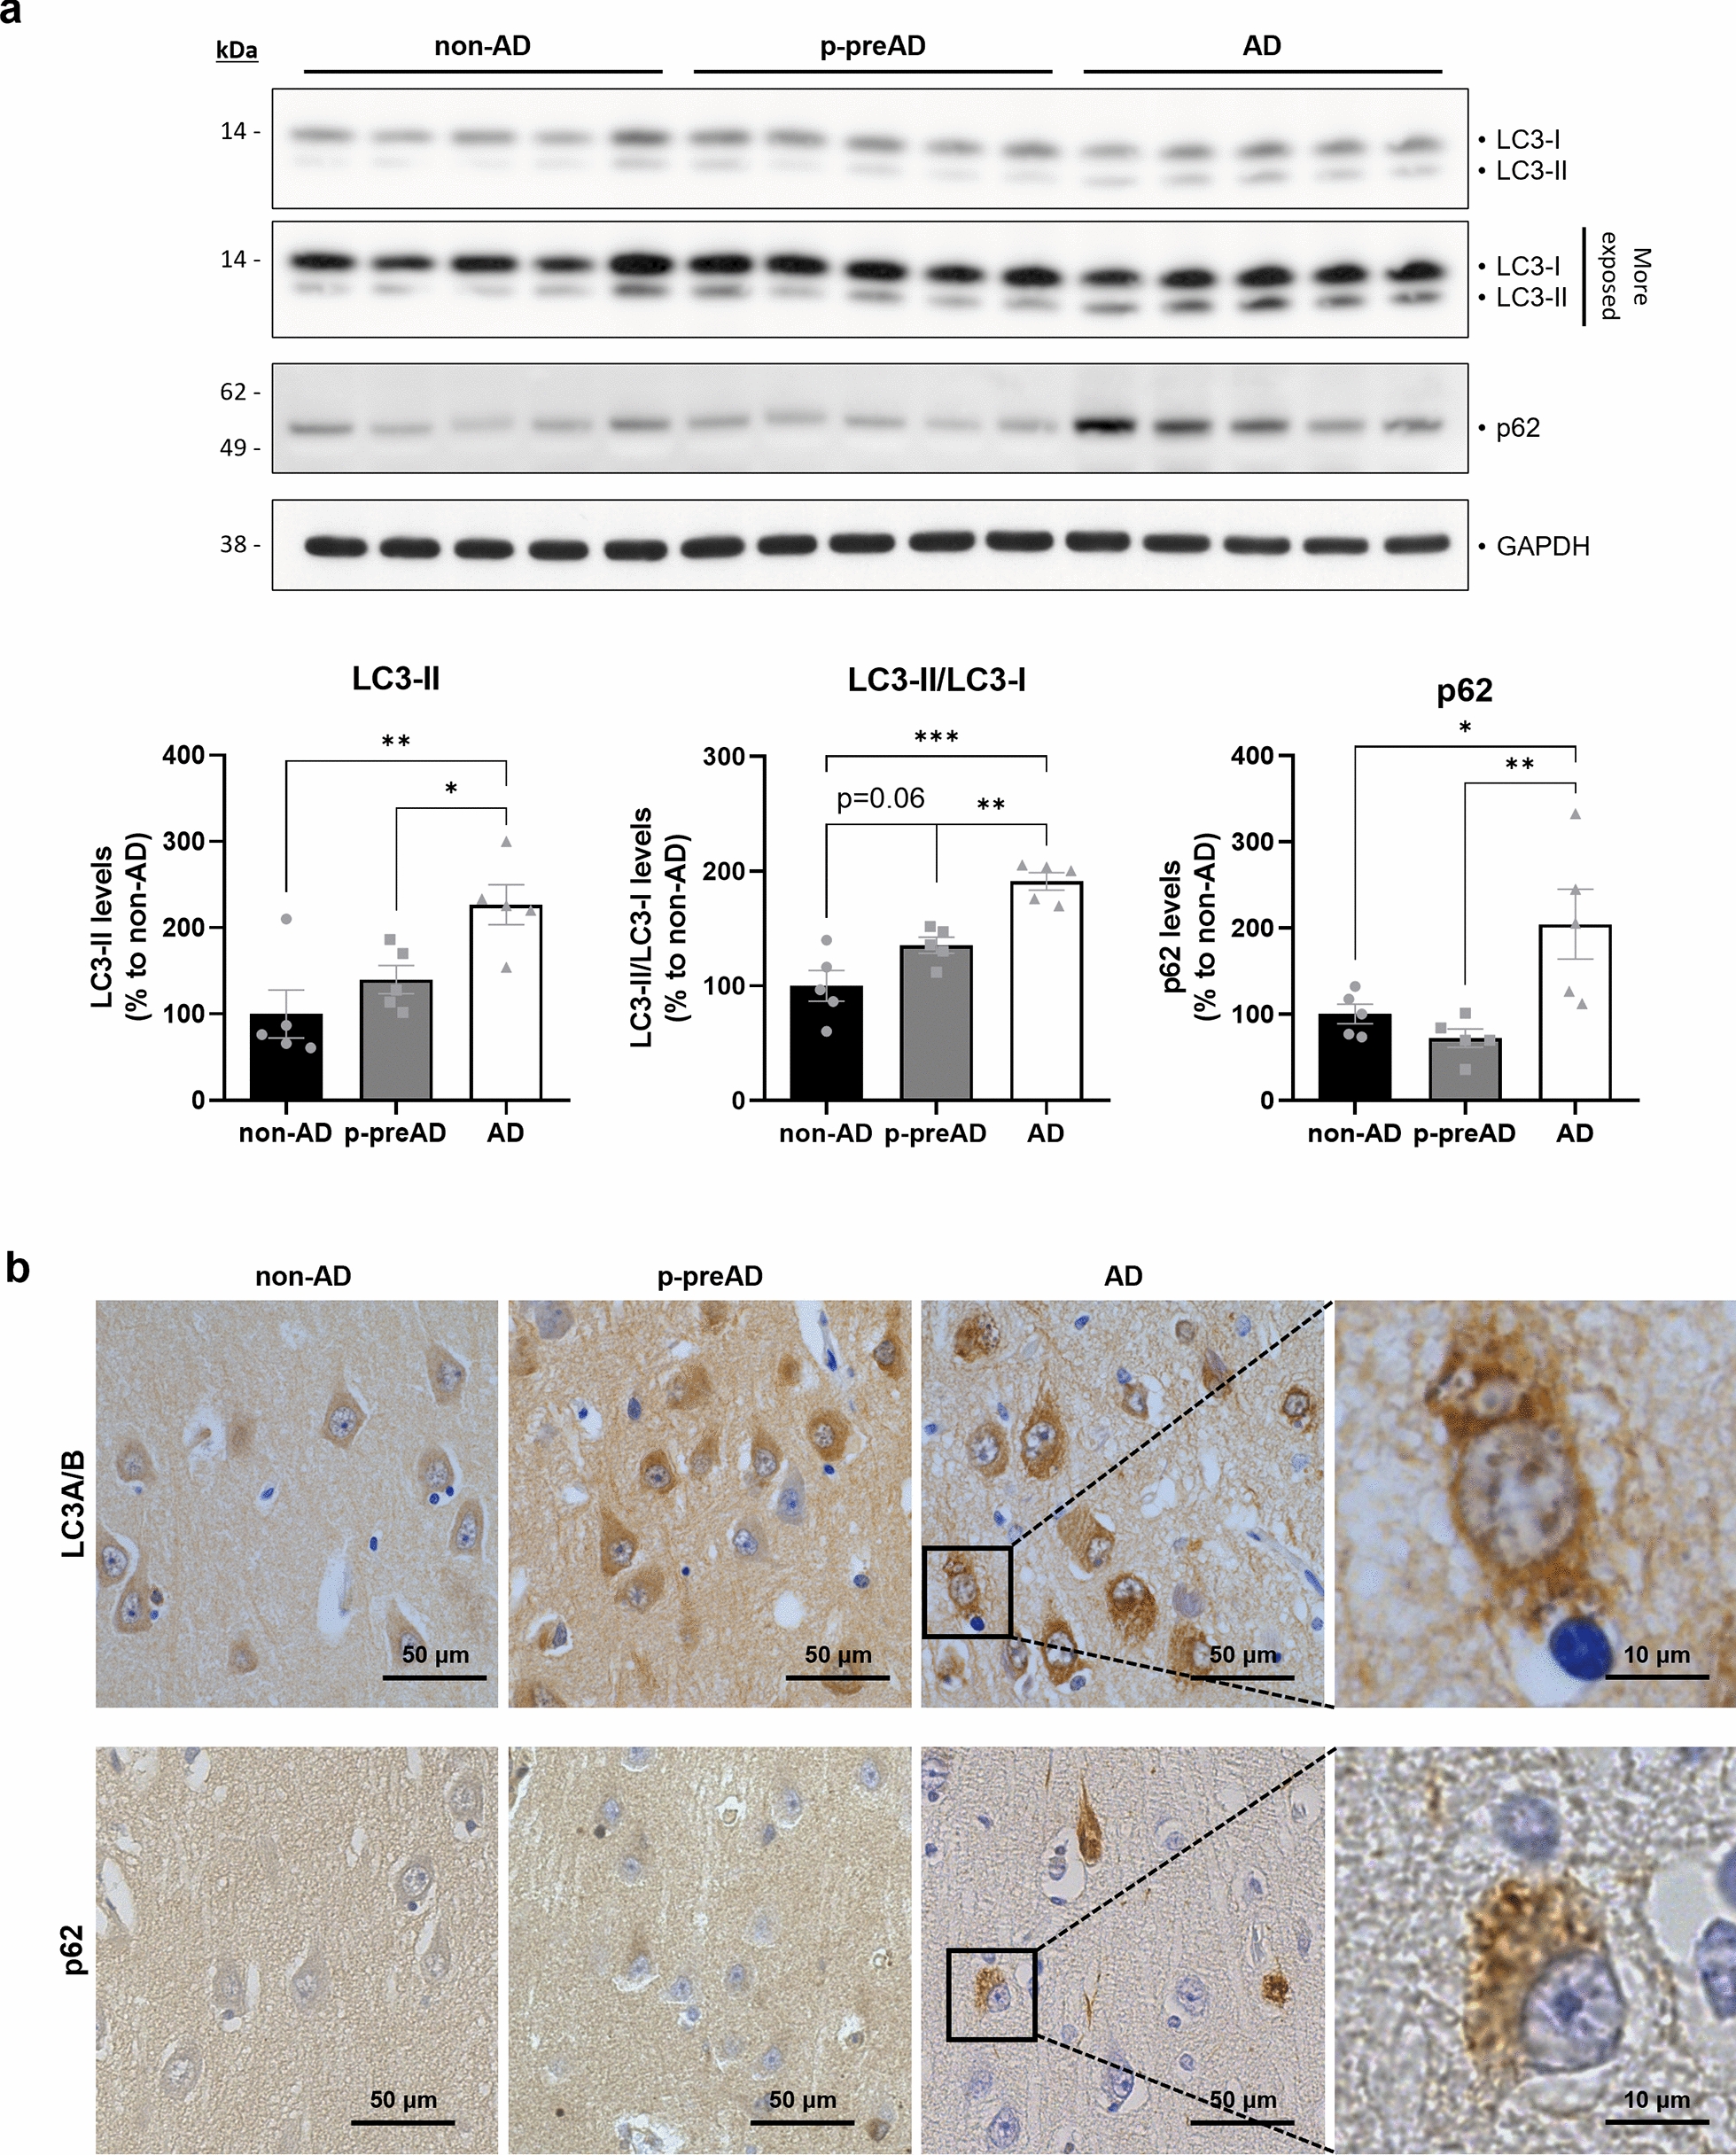
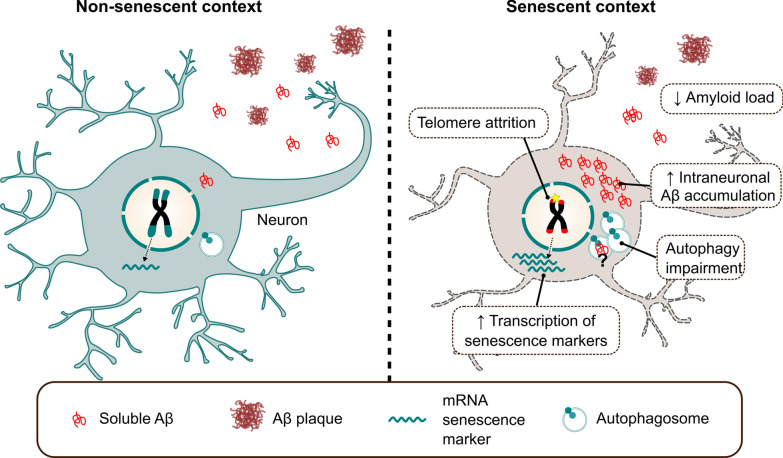
Aging is the main risk factor for Alzheimer's disease (AD) and other neurodegenerative pathologies, but the molecular and cellular changes underlying pathological aging of the nervous system are poorly understood. AD pathology seems to correlate with the appearance of cells that become senescent due to the progressive accumulation of cellular insults causing DNA damage. Senescence has also been shown to reduce the autophagic flux, a mechanism involved in clearing damaged proteins from the cell, and such impairment has been linked to AD pathogenesis. In this study, we investigated the role of cellular senescence on AD pathology by crossing a mouse model of AD-like amyloid-β (Aβ) pathology (5xFAD) with a mouse model of senescence that is genetically deficient for the RNA component of the telomerase (Terc-/-). We studied changes in amyloid pathology, neurodegeneration, and the autophagy process in brain tissue samples and primary cultures derived from these mice by complementary biochemical and immunostaining approaches. Postmortem human brain samples were also processed to evaluate autophagy defects in AD patients. Our results show that accelerated senescence produces an early accumulation of intraneuronal Aβ in the subiculum and cortical layer V of 5xFAD mice. This correlates with a reduction in amyloid plaques and Aβ levels in connecting brain regions at a later disease stage. Neuronal loss was specifically observed in brain regions presenting intraneuronal Aβ and was linked to telomere attrition. Our results indicate that senescence affects intraneuronal Aβ accumulation by impairing autophagy function and that early autophagy defects can be found in the brains of AD patients. Together, these findings demonstrate the instrumental role of senescence in intraneuronal Aβ accumulation, which represents a key event in AD pathophysiology, and emphasize the correlation between the initial stages of amyloid pathology and defects in the autophagy flux.

Keywords: Alzheimer’s disease; Autophagy; Cellular senescence; Intraneuronal Aβ; Telomere shortening.


Conflict of interest statement

DRT received speaker honorary or travel reimbursement from UCB (Brussels, Belgium) and Biogen (USA), and collaborated with Novartis Pharma AG (Basel, Switzerland), Probiodrug (Halle (Saale), Germany), GE Healthcare (Amersham, UK), and Janssen Pharmaceutical Companies (Beerse, Belgium). RV’s institution has clinical trial agreements (RV as Principal Investigator) with Alector, Biogen, Denali, J&J, Prevail, UCB, Roche and Wave. RV’s institution has consultancy agreements for DSMB membership (RV) with AC Immune and Novartis. CAFvA received honoraria from serving on the scientific advisory board of Biogen, Roche, Novo Nordisk, and Dr. Wilmar Schwabe GmbH &Co. KG, funding for travel and speaker honoraria from Biogen, Roche diagnostics AG, Novartis, Medical Tribune Verlagsgesellschaft GmbH, Landesvereinigung für Gesundheit und Akademie für Sozialmedizin Niedersachsen e. V. and Dr. Wilmar Schwabe GmbH &Co. KG and has received research support from Roche diagnostics AG. The other authors have no relevant financial or non-financial interests to disclose.

Figures

Fig. 1
Fig. 1
Telomere shortening enhances classical markers of cellular senescence in brain cells. a qPCR analysis of telomere length in cortical DNA samples from WT and successive generations (G1-G4) of Terc−/− mice. Average telomere length was calculated as the ratio (T/S) of the telomere repeat copy number (T) to a single copy gene copy number (S = 36B4). *P < 0.05, ***P < 0.001 (One-way ANOVA with Tukey’s post-hoc analysis, n = 2–5 mice/group). b mRNA levels of the SASP factors Il1b, Il6, Cxcl1, and the cyclin-dependent kinase inhibitors p16Ink4a (p16), p19Arf (p19) and p21waf1/cip1 (p21), were measured by RT-qPCR in cortical extracts from 5-month-old WT and G3Terc−/− mice. *P < 0.05 (two-tailed Student’s t-test, n = 4–8). c qPCR analysis of telomere length (T/S ratio) in primary neurons derived from WT and G3Terc−/− mice. **P < 0.01 (two-tailed Student’s t-test, n = 3 cultures/group). d mRNA levels of Il1b, Il6, Cxcl1, p16Ink4a (p16), p19Arf (p19) and p21waf1/cip1 (p21), were measured by RT-qPCR in WT and G3Terc−/− primary neurons. *P < 0.05 (two-tailed Student’s t-test, n = 3–4 cultures/group). e Primary neurons obtained from WT and G3Terc−/− mice were stained for SA-β-gal, followed by immunostaining using the selective neuronal marker MAP2 (red), and the percentage of SA-β-gal-positive neurons was calculated. *P < 0.05 (two-tailed Student’s t-test, n = 3 cultures/group). Scale bar: 100 μm. All data are presented as the mean ± SEM
Fig. 2
Fig. 2
Accelerated senescence enhances aberrant intracellular Aβ accumulation in 5xFAD mice. a Immunostaining analysis of Aβ42 (Aβ42 antibody, clone H31L21, red) in the subiculum from 1.5-month-old 5xFAD and G3Terc−/− 5xFAD mice. Representative photomicrographs are shown. Quantitative analysis of intracellular Aβ42 was performed by counting cells displaying intracellular Aβ42 staining (arrows). Scale bar: 100 μm. ***P < 0.001 (two-tailed Student’s t-test, n = 5–7 mice/group). b Immunostaining analysis of Aβ42 and Aβ42-containing plaques (Aβ42 antibody, clone H31L21, red; Thioflavin T dye, green, colocalization indicated by arrows) in the subiculum from 2-month-old 5xFAD and G3Terc−/− 5xFAD mice. Representative photomicrographs are shown. Scale bar: 100 μm. c Immunostaining analysis of Aβ42 (Aβ42 antibody, clone H31L21, red) in the cortical layer V region from 2-month-old 5xFAD and G3Terc−/− 5xFAD mice. Representative photomicrographs are shown. Quantitative analysis of intracellular Aβ42 was performed by counting cells displaying intracellular Aβ42 staining (arrows). Scale bar: 200 μm. Non-significant (two-tailed Student’s t-test, n = 3–5 mice/group). All data are presented as the mean ± SEM
Fig. 3
Fig. 3
Aberrant intracellular Aβ accumulation in senescent primary neurons overexpressing mutant APP. a Schematic illustration of the experimental plan. Primary neuronal cultures were obtained from WT and G3Terc−/− mice and infected at 7 days in vitro (DIV) with lentivirus expressing hAPP3xmut: mutated human APP (hAPP) carrying 3 AD-linked mutations (the Swedish [K670N/M671L], Florida [I716V], and London [V717I] mutations). Cell lysates were collected at 11 DIV. b Western blot analysis showing hAPP relative protein levels in WT and G3Terc−/− neurons overexpressing APP3xmut. Actin was used as loading control, and the levels in the control group were set as 100%. Non-significant (two-tailed Student’s t-test, n = 8 cultures/group). The lack of hAPP detection in non-infected WT and G3Terc−/− neurons is shown. c MSD Electro-Chemiluminescence Immuno-Assay (ECLIA) showing relative protein levels of human Aβ40 and Aβ42 in WT and G3Terc−/− neurons overexpressing hAPP3xmut. Results were normalized by the amount of hAPP protein levels obtained in previous Western blot analyses, and the levels in the control group set as 100%. *P < 0.05 (two-tailed Student’s t-test or Mann–Whitney test, n = 8 cultures/group). hAβ signal was not detected in non-infected WT and G3Terc−/− neurons. All data are presented as mean ± SEM
Fig. 4
Fig. 4
Accelerated senescence reduces Aβ plaque load in 5-month-old 5xFAD mice. Immunostaining analysis of Aβ42-containing plaques (Aβ42 antibody, clone H31L21, red; Thioflavin T dye, green) in the hippocampus (a) and cortical (b) regions from 5-month-old 5xFAD and G3Terc−/− 5xFAD mice. Representative photomicrographs are shown. Quantitative analysis of Aβ deposition was performed by counting double-positive dots (arrows). Scale bar: 1000 μm. *P < 0.05 (two-tailed Student’s t-test, n = 6–7 mice/group). All data are presented as the mean ± SEM
Fig. 5
Fig. 5
Accelerated senescence reduces Aβ levels in 5-month-old 5xFAD mice without altering APP processing or expression. a Schematic diagram depicting the sequential extraction of fractions containing detergent-soluble proteins (containing soluble Aβ) and guanidine hydrochloride (GuHCl)-soluble proteins (containing insoluble Aβ). b MSD Electro-Chemiluminescence Immuno-Assay of human Aβ (hAβ) showing soluble and insoluble hAβ40 and hAβ42 levels for mg of total protein in hippocampal extracts from 5-month-old 5xFAD and G3Terc−/− 5xFAD mice. *P < 0.05, **P < 0.01, ***P < 0.001 (two-tailed Student’s t-test, n = 4–5 mice/group). c Western blot analysis showing relative protein levels of hAβ, hAPP, CTFα, CTFβ, PS1 and PS2 in hippocampal protein extracts from 5-month-old 5xFAD and G3Terc−/− 5xFAD mice. Actin was used as loading control, and the levels in the control group were set as 100%. **P < 0.01 (two-tailed Student’s t-test, n = 4–8 mice/group). d Western blot analysis showing relative protein levels of hAβ in cortical protein extracts from 5-month-old 5xFAD and G3Terc−/− 5xFAD mice. Actin was used as loading control, and the levels in the control group were set as 100%. P = 0.06 (two-tailed Student’s t-test, n = 6–7 mice/group). e RT-qPCR analyses of mouse APP (mAPP) and human APP (hAPP) mRNA levels in total brain extracts from 5-month-old 5xFAD and G3Terc−/− 5xFAD mice. Non-significant (two-tailed Student’s t-test, n = 3–4 mice/group). All data are presented as mean ± SEM
Fig. 6
Fig. 6
Accelerated senescence in 5xFAD mice decreases neuronal density in brain regions presenting intraneuronal Aβ accumulation. a NeuN immunostainings in the subiculum of 2-month-old WT, G3Terc−/−, 5xFAD and G3Terc−/− 5xFAD mice. Representative photomicrographs are shown. **P < 0.01 (One-way ANOVA with Tukey’s post-hoc analysis, n = 3–5). NeuN immunostainings in the subiculum (b) and cortex (c) of 5-month-old WT, G3Terc−/−, 5xFAD and G3Terc−/− 5xFAD mice. Representative photomicrographs are shown. Layer V of the cortex is indicated by dashed lines. Scale bar: 200 μm. *P < 0.05, **P < 0.01, ***P < 0.001 (One-way ANOVA with Tukey’s post-hoc analysis, n = 4 mice/group). NeuN immunostainings in the CA1 (d) CA3 (e) and DG (f) region of 5-month-old WT, G3Terc−/−, 5xFAD and G3Terc−/− 5xFAD mice. Representative photomicrographs are shown. Scale bar: 100 μm. Non-significant (One-way ANOVA with Tukey’s post-hoc analysis, n = 4 mice/group). The number of NeuN-positive cells per mm2 was calculated as a measure of neuronal density. All data are presented as mean ± SEM
Fig. 7
Fig. 7
Accelerated senescence alters autophagy in vivo. a Western blot analysis showing p62 and LC3 relative protein levels in hippocampal protein extracts from 5-month-old WT, G3Terc−/−, 5xFAD and G3Terc−/− 5xFAD mice. Actin was used as loading control, and the levels in the control group were set as 100%. *P < 0.05, **P < 0.01 (One-way ANOVA with Tukey’s post-hoc analysis, n = 7 mice/group). All data are presented as mean ± SEM. b Western blot analysis showing Atg9A and Beclin-1 relative protein levels in hippocampal protein extracts from 5-month-old WT, G3Terc−/−, 5xFAD and G3Terc−/− 5xFAD mice. Protein levels were normalized by the amount of Actin, and the levels in the control group were set as 100%. Non-significant (One-way ANOVA with Tukey’s post-hoc analysis, n = 7 mice/group). c Colocalization of Aβ (MOAB2, red) with two different autophagy markers (p62 or LC3, green) in the subiculum of 2-months-old 5xFAD mice. Representative photomicrographs are shown. Scale bar: 10 μm
Fig. 8
Fig. 8
Altered autophagy in senescent primary neurons modulates intraneuronal Aβ accumulation. a Illustration depicting the process of autophagy. Chloroquine (CQ) blocks the fusion between the lysosome and the autophagosome. b Schematic for the experimental design followed to measure the autophagic flux in vitro. Primary neuronal cultures were obtained from WT and G3Terc−/− mice and treated with CQ (25 μM) or vehicle (Veh) at 14 days in vitro (DIV). Cell lysates were collected after 6 h of treatment for subsequent Western blot analysis. c Western blot analysis showing the difference in LC3-II/LC3-I ratio and in p62 relative protein levels after CQ treatment in the cell lysates mentioned in “b”. Actin was used as loading control. Results are expressed as difference between CQ and Veh conditions. *P < 0.05 (two-tailed Student’s t-test, n = 4 cultures/group). d Primary neurons obtained from WT and G3Terc−/− mice were infected with hAPP3xmut-expressing lentiviruses and treated with rapamycin (RAP) or vehicle (Veh) for 4 days, and intraneuronal Aβ42 accumulation was evaluated by immunostaining analysis of Aβ42 (red) and the neuronal marker MAP2 (green). Relative fluorescence intensity was calculated. **P < 0.01 (Two-way ANOVA with Tukey’s post-hoc analysis, n = 4–5 cultures/group). Scale bar: 50 μm. e MSD Electro-Chemiluminescence Immuno-Assay showing human Aβ40 and Aβ42 levels in WT and G3Terc−/− neurons overexpressing hAPP3xmut and treated with rapamycin (RAP) or vehicle (Veh) for 4 days. Results were normalized by the amount of hAPP protein levels obtained in previous Western blot analyses, and the levels in the control group were set as 100%. *P < 0.05, **P < 0.01 (Two-way ANOVA with Tukey’s post-hoc analysis, n = 3–4 cultures/group). hAβ signal was not detected in non-infected WT and G3Terc−/− neurons. All data are presented as the mean ± SEM
Fig. 9
Fig. 9
The brains of AD patients present altered autophagy. a Western blot analysis showing LC3 and p62 relative protein levels in the SDS-soluble fraction of homogenates derived from temporal cortex of non-AD, p-preAD and AD cases. GAPDH was used as loading control, and the levels in the control group were set as 100%. *P < 0.05, **P < 0.01, ***P<0.001 (One-way ANOVA with Tukey’s post-hoc analysis, n = 5 patients/group). Data are presented as mean ± SEM. b DAB immunostainings against LC3 and p62 in the CA1 hippocampal region of representative non-AD, p-preAD and AD cases. Scale bar: 50 μm or 10 μm (magnified image). non-AD: non-demented control; p-preAD: pathologically defined preclinical AD; AD: symptomatic AD
Fig. 10
Fig. 10
Graphical abstract summarizing the main findings of this article. In a senescent context that could be triggered by telomere attrition, neurons increase the transcription of classical senescence markers and display a diminished autophagic flux. Those alterations lead to an aberrant and neurotoxic increase in intracellular Aβ levels. Such an increase is later on translated into decreased extracellular Aβ plaque formation in connecting brain regions

References

    1. Abbink MR, Kotah JM, Hoeijmakers L, Mak A, Yvon-Durocher G, van der Gaag B, et al. Characterization of astrocytes throughout life in wildtype and APP/PS1 mice after early-life stress exposure. J Neuroinflam. 2020;17:91. doi: 10.1186/s12974-020-01762-z. - DOI - PMC - PubMed
    1. Allsopp RC, Vaziri H, Patterson C, Goldstein S, Younglai EV, Futcher AB, et al. Telomere length predicts replicative capacity of human fibroblasts. Proc Natl Acad Sci U S A. 1992;89:10114–10118. doi: 10.1073/pnas.89.21.10114. - DOI - PMC - PubMed
    1. Aoki M, Volkmann I, Tjernberg LO, Winblad B, Bogdanovic N. Amyloid beta-peptide levels in laser capture microdissected cornu ammonis 1 pyramidal neurons of Alzheimer's brain. NeuroReport. 2008;19:1085–1089. doi: 10.1097/WNR.0b013e328302c858. - DOI - PubMed
    1. Apostolova LG, Dutton RA, Dinov ID, Hayashi KM, Toga AW, Cummings JL, et al. Conversion of mild cognitive impairment to Alzheimer disease predicted by hippocampal atrophy maps. Arch Neurol. 2006;63:693–699. doi: 10.1001/archneur.63.5.693. - DOI - PubMed
    1. Baker DJ, Petersen RC. Cellular senescence in brain aging and neurodegenerative diseases: evidence and perspectives. J Clin Invest. 2018;128:1208–1216. doi: 10.1172/jci95145. - DOI - PMC - PubMed

Publication types

Substances