. 2023 Jul;12(13):14833-14850.
doi: 10.1002/cam4.6073. Epub 2023 May 18.

Pan-cancer analysis of oncogenic role of insulin-like growth factor-binding proteins and validation in ovarian cancer

Affiliations

Pan-cancer analysis of oncogenic role of insulin-like growth factor-binding proteins and validation in ovarian cancer

Wei Tan et al. Cancer Med. 2023 Jul.

Abstract

Background: Numerous studies have shown that the insulin-like growth factor (IGF) pathway is highly associated with tumor initial and progression in several tumors. However, compared with IGF1/1R and IGF2/2R, insufficient studies have focused on IGF-binding proteins (IGFBPs).

Methods: The GDC TCGA and GTEx data of 33 cancers, TCGA pan-cancer immune phenotypes, tumor mutation burdens, and the copy number alterations of IGFBPs were extracted. Next, the prognostic value of IGFBPs was analyzed based on a univariate Cox analysis. Additionally, the ESTIMATE algorithm was used to calculate stromal and immune scores and tumor purity, and the CIBERSORT algorithm was used to estimate tumor-infiltrating immunocyte levels. Ultimately, the correlation between IGFBP expression and cancer hallmark pathways was estimated with a Spearman analysis.

Results: The expression of IGFBPs was differentially expressed and correlated with prognosis in specific cancers. IGFBPs may operate as biological markers for carcinogenesis and progression and as prognostic biomarkers. Additionally, IGFBP5 has been proved that promotes the invasion and migration of ovarian cancer.

Conclusions: In general, IGFBPs can serve as predictable biomarkers and potential therapeutic targets for specific tumors. Our results could provide underlying targets for the design of laboratory experiments to elucidate the mechanism of IGFBPs in cancers and identify IGFBP5 as a prognostic factor in ovarian cancers.

Keywords: IGF-binding proteins; cancer hallmark; ovarian cancer.


Conflict of interest statement

The authors declare no competing interests.

Figures

FIGURE 1
FIGURE 1
The expression of IGFBPs in pan‐cancer. (A–F) The expression level of IGFBP1 (A), IGFBP2 (B), IGFBP3 (C), IGFBP4 (D), IGFBP5 (E), and IGFBP6 (F) were compared based on the integrated database from TCGA and GTEx. The red and blue boxes represent tumor tissues and normal tissues respectively. *p < 0.05, **p < 0.01, ***p < 0.001. ACC, adrenocortical carcinoma; BLCA, bladder urothelial carcinoma; BRCA, breast invasive carcinoma; CESC, cervical squamous cell carcinoma; CHOL, cholangiocarcinoma; COAD, colon adenocarcinoma; ESCA, esophageal carcinoma; GBM, glioblastoma; HNSC, head and neck squamous cell carcinoma; KICH, kidney chromophobe; KIRC, kidney renal clear cell carcinoma; KIRP, kidney renal papillary cell carcinoma; LAML, acute myeloid leukemia; LIHC, liver hepatocellular carcinoma; LUAD, lung adenocarcinoma; LUSC, lung squamous cell carcinoma; OV, ovarian serous cystadenocarcinoma; PAAD, pancreatic adenocarcinoma; PRAD, prostate adenocarcinoma; READ, rectum adenocarcinoma; SKCM, skin cutaneous melanoma; STAD, stomach adenocarcinoma; THCA, thyroid carcinoma; UCEC, uterine corpus endometrial carcinoma; UCS, uterine carcinosarcoma.
FIGURE 2
FIGURE 2
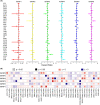
Prognostic analysis of IGFBPs. (A) Forest plot of association of IGFBPs expression with overall survival (OS) in 33 tumors. Different colored lines indicate the risk value of different genes in tumors, hazard ratio < 1 represents low risk, and hazard ratio > 1 represents high risk. (B) The heatmap of IGFBPs across different cancer types based on TIMER2.0 database. ACC, adrenocortical carcinoma; BLCA, bladder urothelial carcinoma; BRCA, breast invasive carcinoma; CESC, cervical squamous cell carcinoma; CHOL, cholangiocarcinoma; COAD, colon adenocarcinoma; DLBC, diffuse large B cell lymphoma; ESCA, esophageal carcinoma; GBM, glioblastoma; HNSC, head and neck squamous cell carcinoma; KICH, kidney chromophobe; KIRC, kidney renal clear cell carcinoma; KIRP, kidney renal papillary cell carcinoma; LAML, acute myeloid leukemia; LGG, lower grade glioma; LIHC, liver hepatocellular carcinoma; LUAD, lung adenocarcinoma; LUSC, lung squamous cell carcinoma; MESO, mesothelioma; OV, ovarian serous cystadenocarcinoma; PAAD, pancreatic adenocarcinoma; PCPG, pheochromocytoma and paraganglioma; PRAD, prostate adenocarcinoma; READ, rectum adenocarcinoma; SARC, sarcoma; SKCM, skin cutaneous melanoma; STAD, stomach adenocarcinoma; TGCT, testicular germ cell tumors; THCA, thyroid carcinoma; THYM, thymoma; UCEC, uterine corpus endometrial carcinoma; UCS, uterine carcinosarcoma; UVM, uveal melanoma.
FIGURE 3
FIGURE 3
The relationship between the expression of IGFBPs and TMB. (A–F) The radar map displaying the correlation of TMB with IGFBP1 (A), IGFBP2 (B), IGFBP3 (C), IGFBP4 (D), IGFBP5 (E), and IGFBP6 (F). *p < 0.05, **p < 0.01, ***p < 0.001. ACC, adrenocortical carcinoma; BLCA, bladder urothelial carcinoma; BRCA, breast invasive carcinoma; CESC, cervical squamous cell carcinoma; CHOL, cholangiocarcinoma; COAD, colon adenocarcinoma; DLBC, diffuse large B cell lymphoma; ESCA, esophageal carcinoma; GBM, glioblastoma; HNSC, head and neck squamous cell carcinoma; KICH, kidney chromophobe; KIRC, kidney renal clear cell carcinoma; KIRP, kidney renal papillary cell carcinoma; LAML, acute myeloid leukemia; LGG, lower grade glioma; LIHC, liver hepatocellular carcinoma; LUAD, lung adenocarcinoma; LUSC, lung squamous cell carcinoma; MESO, mesothelioma; OV, ovarian serous cystadenocarcinoma; PAAD, pancreatic adenocarcinoma; PCPG, pheochromocytoma and paraganglioma; PRAD, prostate adenocarcinoma; READ, rectum adenocarcinoma; SARC, sarcoma; SKCM, skin cutaneous melanoma; STAD, stomach adenocarcinoma; TGCT, testicular germ cell tumors; THCA, thyroid carcinoma; THYM, thymoma; UCEC, uterine corpus endometrial carcinoma; UCS, uterine carcinosarcoma; UVM, uveal melanoma.
FIGURE 4
FIGURE 4
Correlation of tumor invasion and metastasis‐related biology pathway with IGFBPs. The heatmap of the correlation of IGFBPs with epithelial‐mesenchymal transition (A), angiogenesis (B), hypoxia (C), and glycolysis (D). Red dots indicate a positive correlation between gene expression, and blue dots indicate a negative correlation. ACC, adrenocortical carcinoma; BLCA, bladder urothelial carcinoma; BRCA, breast invasive carcinoma; CESC, cervical squamous cell carcinoma; CHOL, cholangiocarcinoma; COAD, colon adenocarcinoma; DLBC, diffuse large B cell lymphoma; ESCA, esophageal carcinoma; GBM, glioblastoma; HNSC, head and neck squamous cell carcinoma; KICH, kidney chromophobe; KIRC, kidney renal clear cell carcinoma; KIRP, kidney renal papillary cell carcinoma; LAML, acute myeloid leukemia; LGG, lower grade glioma; LIHC, liver hepatocellular carcinoma; LUAD, lung adenocarcinoma; LUSC, lung squamous cell carcinoma; MESO, mesothelioma; OV, ovarian serous cystadenocarcinoma; PAAD, pancreatic adenocarcinoma; PCPG, pheochromocytoma and paraganglioma; PRAD, prostate adenocarcinoma; READ, rectum adenocarcinoma; SARC, sarcoma; SKCM, skin cutaneous melanoma; STAD, stomach adenocarcinoma; TGCT, testicular germ cell tumors; THCA, thyroid carcinoma; THYM, thymoma; UCEC, uterine corpus endometrial carcinoma; UCS, uterine carcinosarcoma; UVM, uveal melanoma.
FIGURE 5
FIGURE 5
Correlation of tumor metabolism reprogramming with IGFBPs. The heatmap shows the correlation of IGFBPs with carbohydrate (A), amino acid (B), TCA cycle (C), and fatty acid (D). Red dots indicate a positive correlation between gene expression, and blue dots indicate a negative correlation. ACC, adrenocortical carcinoma; BLCA, bladder urothelial carcinoma; BRCA, breast invasive carcinoma; CESC, cervical squamous cell carcinoma; CHOL, cholangiocarcinoma; COAD, colon adenocarcinoma; DLBC, diffuse large B cell lymphoma; ESCA, esophageal carcinoma; GBM, glioblastoma; HNSC, head and neck squamous cell carcinoma; KICH, kidney chromophobe; KIRC, kidney renal clear cell carcinoma; KIRP, kidney renal papillary cell carcinoma; LAML, acute myeloid leukemia; LGG, lower grade glioma; LIHC, liver hepatocellular carcinoma; LUAD, lung adenocarcinoma; LUSC, lung squamous cell carcinoma; MESO, mesothelioma; OV, ovarian serous cystadenocarcinoma; PAAD, pancreatic adenocarcinoma; PCPG, pheochromocytoma and paraganglioma; PRAD, prostate adenocarcinoma; READ, rectum adenocarcinoma; SARC, sarcoma; SKCM, skin cutaneous melanoma; STAD, stomach adenocarcinoma; TGCT, testicular germ cell tumors; THCA, thyroid carcinoma; THYM, thymoma; UCEC, uterine corpus endometrial carcinoma; UCS, uterine carcinosarcoma; UVM, uveal melanoma.
FIGURE 6
FIGURE 6
The expression of IGFBPs in ovarian cancer. (A) The mRNA expression in six ovarian cancer tissues and five normal ovarian tissues. The relative protein expression of IGFBP2 (B), IGFBP3 (C), IGFBP4 (D), IGFBP5 (E), and IGFBP6 (F) in ovarian cancer. The red and blue boxes represent tumor tissues and normal tissues, respectively. *p < 0.05, **p < 0.01, ***p < 0.001.
FIGURE 7
FIGURE 7
The prognostic of IGFBPs in GSE26712. (A) Univariate Cox analysis of IGFBPs in ovarian cancer. (B–E) The survival analysis of IGFBP3 (B), IGFBP4 (C), IGFBP5 (D), and IGFBP6 (E). (F) Multivariate Cox analysis of IGFBPs.
FIGURE 8
FIGURE 8
Effects of IGFBP5 on invasion and migration of ovarian cancer cells. (A) The expression of IGFBP5 in two risk groups. (B) The levels of tumor biological pathways in two risk groups. (C) Representative EMT markers were assayed by western blot. (D) A transwell invasion assay was performed to evaluate the invasion ability of SKOV3 without or with IGFBP5 recombinant protein (5 ng/mL) for 24 h. (E) A wound healing assay was performed to evaluate the migration ability of SKOV3 without or with IGFBP5 recombinant protein (5 ng/mL) for 24 h. *p < 0.05, **p < 0.01, ***p < 0.001. ns means no statistic difference.

Similar articles

Cited by

References

    1. Bray F, Ferlay J, Soerjomataram I, Siegel RL, Torre LA, Jemal A. Global cancer statistics 2018: GLOBOCAN estimates of incidence and mortality worldwide for 36 cancers in 185 countries. CA Cancer J Clin. 2018;68(6):394‐424. doi:10.3322/caac.21492 - DOI - PubMed
    1. Hanahan D, Weinberg RA. Hallmarks of cancer: the next generation. Cell. 2011;144(5):646‐674. doi:10.1016/j.cell.2011.02.013 - DOI - PubMed
    1. Cancer Genome Atlas Research N , Weinstein JN, Collisson EA, et al. The cancer genome atlas pan‐cancer analysis project. Nat Genet. 2013;45(10):1113‐1120. doi:10.1038/ng.2764 - DOI - PMC - PubMed
    1. Kasprzak A, Kwasniewski W, Adamek A, Gozdzicka‐Jozefiak A. Insulin‐like growth factor (IGF) axis in cancerogenesis. Mutat Res Rev Mutat Res. 2017;772:78‐104. doi:10.1016/j.mrrev.2016.08.007 - DOI - PubMed
    1. Mancarella C, Morrione A, Scotlandi K. Novel regulators of the IGF system in cancer. Biomolecules. 2021;11(2):273. doi:10.3390/biom11020273 - DOI - PMC - PubMed

Publication types

MeSH terms

Substances