. 2023 May;56(5):e13467.
doi: 10.1111/cpr.13467. Epub 2023 May 17.

Ex vivo factor VIII-modified proliferating human hepatocytes therapy for haemophilia A

Affiliations

Ex vivo factor VIII-modified proliferating human hepatocytes therapy for haemophilia A

Kun Zhang et al. Cell Prolif. 2023 May.

Abstract

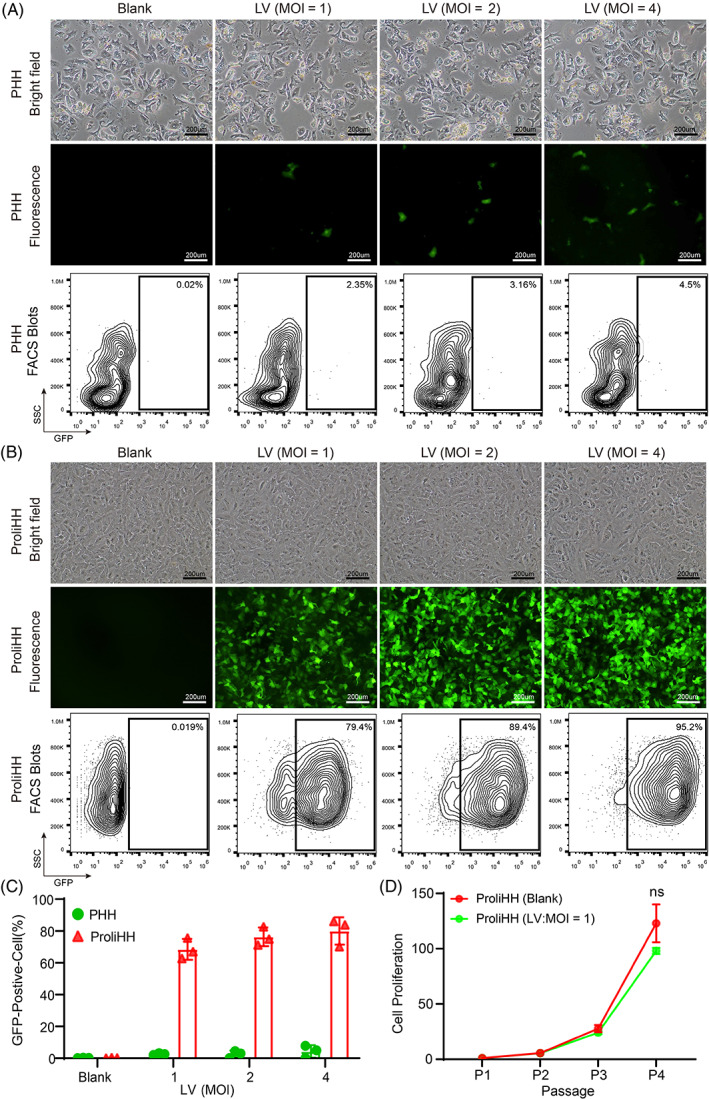
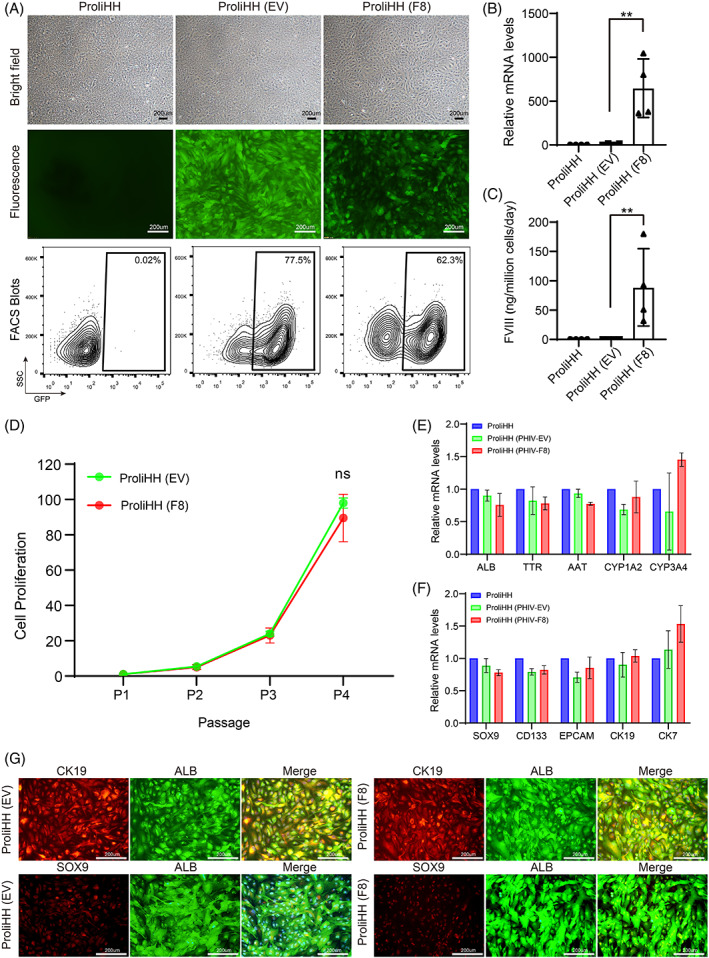
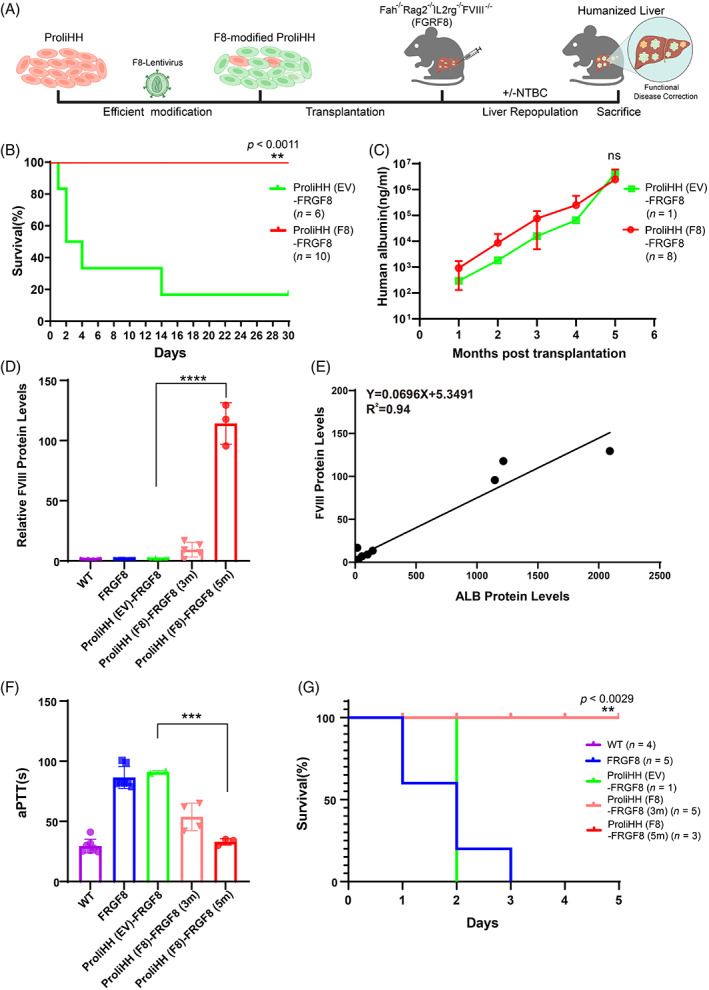
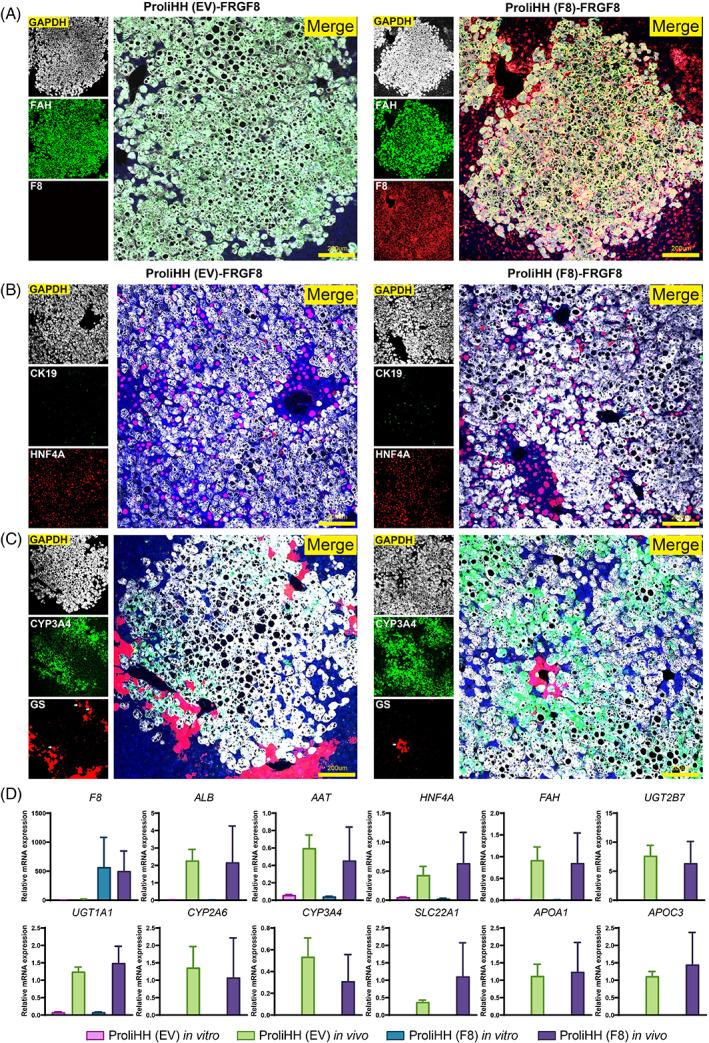
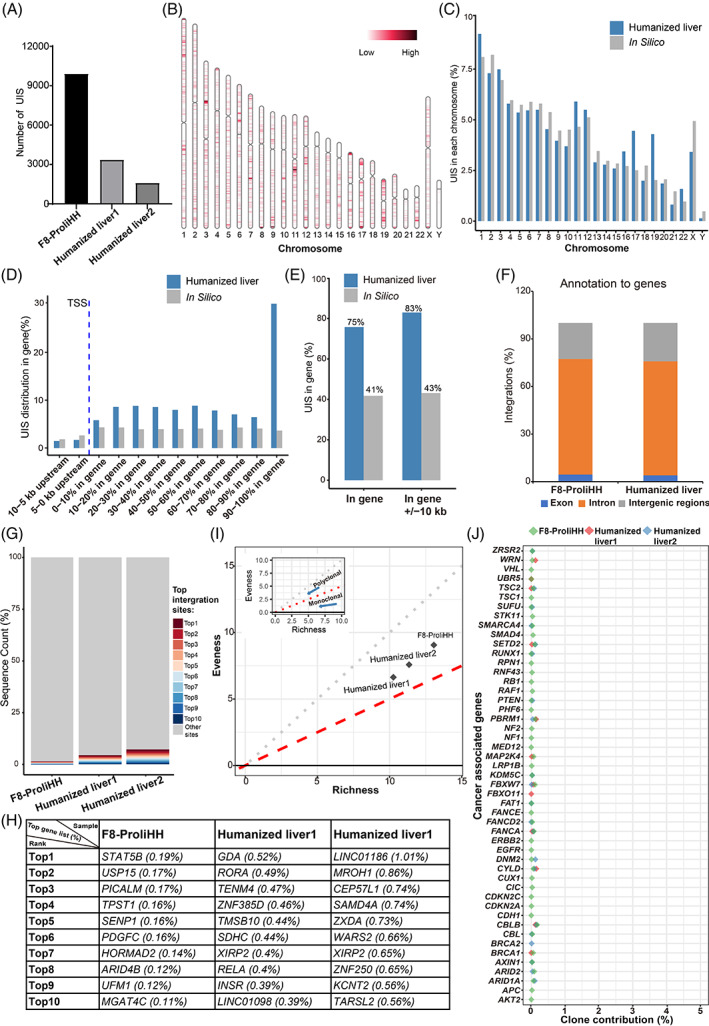
Ex vivo gene manipulation in human hepatocytes is a promising therapeutic strategy in the treatment of inherited liver diseases. However, a major limitation is the lack of a highly efficient and safe genetic manipulation system for transplantable primary human hepatocytes (PHHs). Here, we reported that proliferating human hepatocytes (ProliHHs) cultured in vitro showed high susceptibility to lentivirus-mediated genetic modification and maintained cellular phenotypes after lentiviral infection. Human factor VIII expression was introduced through F8-Lentivirus-mediated transduction of ProliHHs followed by xenotransplantation into immunocompromised haemophilia A mice. We demonstrated that these F8-modified ProliHHs could effectively repopulate the mouse liver, resulting in therapeutic benefits in mouse models. Furthermore, no genotoxicity was detected in F8-modified ProliHHs using lentiviral integration site analysis. Thus, this study demonstrated, for the first time, the feasibility and safety of lentiviral modification in ProliHHs to induce the expression of coagulation factor VIII in the treatment of haemophilia A.


Conflict of interest statement

The authors declare no competing interests.

Figures

FIGURE 1
FIGURE 1
Proliferating human hepatocytes (ProliHHs) are highly susceptible to lentiviral infection. (A) Representative images of primary human hepatocytes (Lot: MRW) in brightfield and fluorescence microscope. Hepatocytes were infected with Empty‐lentivirus (LV) expressing green fluorescent protein (GFP) at multiplicities of infections (MOIs) of 0, 1, 2 and 4 for 3 days in Dulbecco's Modified Eagle Medium. Scale bars, 200 μm. Flow cytometry was performed 48 h after LV transduction. (B) Representative images of ProliHHs (lot: JFC) in brightfield and fluorescence microscope. ProliHHs were infected with Empty‐LV expressing GFP at MOIs of 0, 1, 2 and 4 for 3 days in hepatocyte medium (HM). Scale bars, 200 μm. Flow cytometry was performed 48 h after LV transduction. (C) Percentage of GFP‐positive cells under different titers of Empty‐LV expressing GFP were analysed by the flow cytometry. Data are means ± SD (n = 3 replicates). (D) Growth curves of Empty‐LV‐infected ProliHHs (MOI = 1) were analysed at indicated passages in HM. ProliHHs without LV infection were used as a control. The data are shown as the mean ± SD. NS > 0.05, Student's t test.
FIGURE 2
FIGURE 2
F8‐lentiviral modification maintain features of proliferating human hepatocytes (ProliHHs). (A) Representative images of untreated ProliHHs, Empty‐lentivirus (EV)‐infected ProliHHs and F8‐lentivirus (F8)‐infected ProliHHs (lot: JFC‐Passage4) in brightfield and fluorescence microscope. ProliHHs were infected with lentivirus (LV) (MOI = 1) for 5 days in hepatocyte medium (HM). Scale bars, 200 μm. Flow cytometry was performed 5 days after LV transduction. (B) The expression of human F8 in ProliHHs after infecting F8‐Lentivirus was determined by qPCR. Data are normalized to untreated ProliHHs. The data are shown as the mean ± SD. **p < 0.01, Student's t test. (C) The human FVIII secretion of ProliHHs after infecting F8‐Lentivirus was measured by human FVIII ELISA. The data are shown as the mean ± SD. **p < 0.01, Student's t test. (D) Growth curves of EV/F8‐infected ProliHHs (MOI = 1) were analysed at indicated passages in HM. ProliHHs infected EV was used as a control. The data are shown as the mean ± SD. NS > 0.05, Student's t test. (E) Hepatic gene expressions of ProliHHs after EV/F8‐lentivirus infection was measured by qPCR. Data are normalized to untreated ProliHHs. (F) Progenitor associated markers of ProliHHs after EV/F8‐lentivirus infection was measured by qPCR. Data are normalized to untreated ProliHHs. (G) The co‐expression of the mature hepatic marker ALB and progenitor‐associated markers such as SOX9 and CK19 was determined by immunofluorescent staining in ProliHHs infected by LV at P4. Scale bars, 200 μm.
FIGURE 3
FIGURE 3
Transplantation of F8‐modified proliferating human hepatocytes (ProliHHs) have a functional rescue in haemophilia A mice. (A) Schematic of F8‐modified ProliHHs transplantation for mice model. ProliHHs were cultured in hepatocyte medium for expansion. cultured ProliHHs were infected to lentivirus (MOI = 1) for F8 expression. F8‐modified ProliHHs were transplanted into FRGF8 mice through spleen transplantation. The expansion of human hepatocytes in vivo was promoted by repeatedly adding withdrawn NTBC in transplanted mice. (B) Kaplan–Meier survival curve of FRGF8 mice with transplantation of 8E5 EV‐modified ProliHHs [ProliHH(EV)‐FRGF8] or F8‐modified ProliHHs [ProliHH(F8)‐FRGF8]. (C) The dynamic process of human ALB levels was determined by ELISA in the survived ProliHH (EV)‐FRGF8 and survived ProliHH (F8)‐FRGF8 mice during 5 months after transplantation. (D) The human FVIII levels was determined by ELISA in wild‐type mice (WT), FRGF8 mice, the survived ProliHH (EV)‐FRGF8 mice at 5 months and survived ProliHH(F8)‐FRGF8 mice at 3 and 5 months after transplantation. (E) Construction of linear regression equation according to each mouse's secreted ALB and FVIII proteins. A linear equation was obtained by linear regression analysis. (F) The plasma human FVIII protein activity was measured by aPTTs. The measurements were performed at 3 and 5 months after transplantation. (G) Measurement of the survival rate within 72 h after the tail clip in mice was performed at 3 and 5 months after transplantation. The data are shown as the mean ± SD. **p < 0.01; ***p < 0.001; log‐rank test for (A) and (G), Student's t test for (C), (D) and (F).
FIGURE 4
FIGURE 4
Maturation of gene‐modified proliferating human hepatocytes (ProliHHs) after repopulation in vivo. (A and B) The maturation of repopulated ProliHHs was analysed by co‐immunofluorescent staining for F8, Fah, HNF4a and CK19. (C) The liver zonation was analysed by co‐immunofluorescent staining for Fah, CYP3A4, and GS. Arrows depict human hepatocytes positive for hepatic markers GS and Fah. (D) The Comparison of gene expression of mature hepatic markers, such as phase I, phase II enzymes, and transporters genes in PHHs, EV‐ProliHHs, repopulated EV‐ProliHHs in mice liver, and F8‐ProliHHs, repopulated F8‐ProliHHs in mice liver. RNA was extracted from repopulated livers. Human‐specific primers were used in qPCR.
FIGURE 5
FIGURE 5
Integration profile of F8‐modified proliferating human hepatocytes (ProliHHs). (A) Integration numbers were identified in libraries obtained from F8‐ProliHHs and F8‐ProliHHs repopulated mice livers (humanized livers) using two long terminal repeat primers. (B) Integrations were mapped to the human genome and distribution of lentivirus integration sites in the human chromosomes. Chr, chromosome. (C) Integration site proportions were counted in each human chromosome. Bars in grey represent percentages corresponding to a random distribution of unique integration sites (UISs) in silico, while blue bars represent actual proportions of UISs determined in the two humanized livers. (D) Distribution of the UISs determined in genes and genes ±10 kb. TSS, transcription start site. (E) 75% UISs were observed in gene regions, while 83% UISs were observed in gene ±10 kb regions. No clustering around TSS regions was observed. Bars in grey represent percentages corresponding to a random distribution of UISs in silico, while blue bars represent actual proportions of UISs determined in the two humanized livers. (F) Percentage of integrations mapped to exons, introns, and intergenic regions. (G) The proportions of the 10 most represented UISs in F8‐ProliHHs and F8‐ProliHHs repopulated mice livers (humanized livers). (H) The gene list and proportions of the top 10 UISs in F8‐ProliHHs and F8‐ProliHHs repopulated mice livers (humanized livers). (I) Polyclonal‐monoclonal distance (PMD) clonal framework. PMD analysis is conducted from two dimensions: evenness and richness for the clonal diversity of samples. (J) Clone proportions of UISs at 100 kb upstream and downstream around TSS regions of Cancer associate gene.

Similar articles

Cited by

References

    1. Peters R, Harris T. Advances and innovations in haemophilia treatment. Nat Rev Drug Discov. 2018;17(7):493‐508. - PubMed
    1. Berntorp E, Shapiro AD. Modern haemophilia care. Lancet. 2012;379(9824):1447‐1456. - PubMed
    1. Blanchette VS, Key NS, Ljung LR, et al. Definitions in hemophilia: communication from the SSC of the ISTH. J Thromb Haemost. 2014;12(11):1935‐1939. - PubMed
    1. Berntorp E, Fischer K, Hart DP, et al. Haemophilia. Nat Rev Dis Primers. 2021;7(1):45. - PubMed
    1. Knight R, Stanley S, Wong M, Dolan G. Hemophilia therapy and blood‐borne pathogen risk. Semin Thromb Hemost. 2006;32(Suppl 2):3‐9. - PubMed