

The Biomechanical Influence of Defected Cartilage on the Progression of Osteochondral Lesions of the Talus: A Three-dimensional Finite Element Analysis
- PMID: 37199080
- PMCID: PMC10235158
- DOI: 10.1111/os.13753
The Biomechanical Influence of Defected Cartilage on the Progression of Osteochondral Lesions of the Talus: A Three-dimensional Finite Element Analysis
Abstract
Objectives: Osteochondral lesions of the talus (OLTs) are common injuries in the general population. Abnormal mechanical conditions applied to defected cartilage are believed to be the culprits to deteriorating OLTs. This study aims to investigate the biomechanical effects of defect size of talar cartilage on OLTs during ankle movements.
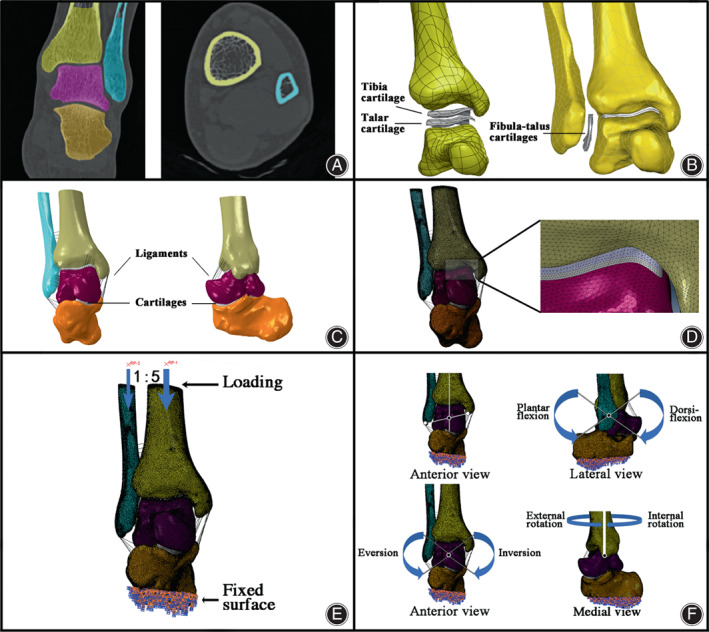
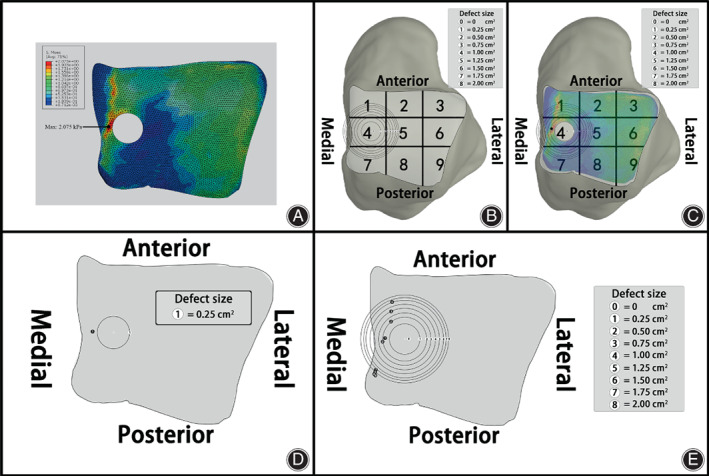
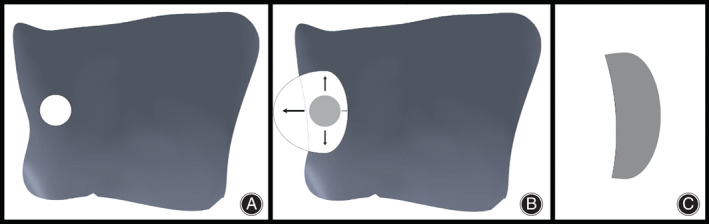
Methods: A finite element model of the ankle joint was created based on the computed tomography images of a healthy male volunteer. Different defect sizes (S = 0.25, 0.5, 0.75, 1.0, 1.25, 1.5, 1.75, and 2.0 cm2 ) of talar cartilage were modeled to simulate the progression of OLTs. Mechanical moments were applied to the model to generate different ankle movements, including dorsiflexion, plantarflexion, inversion, and eversion. The effects of varying defect sizes on peak stress and its location were evaluated.
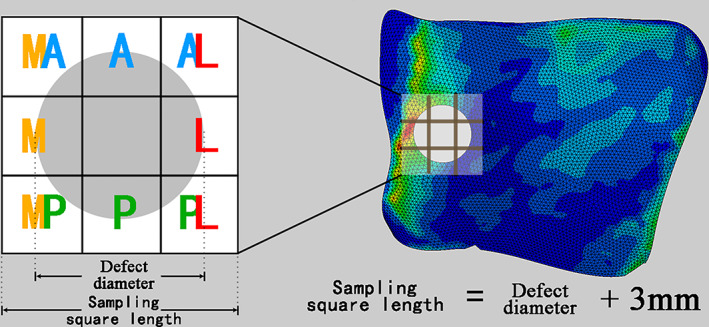
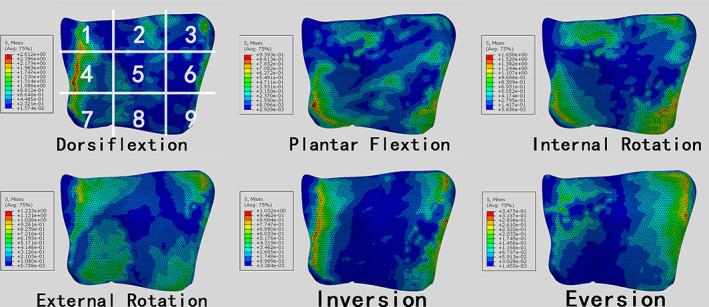
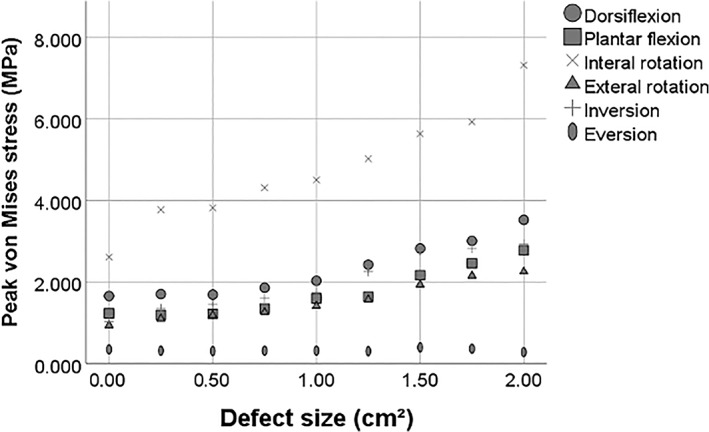
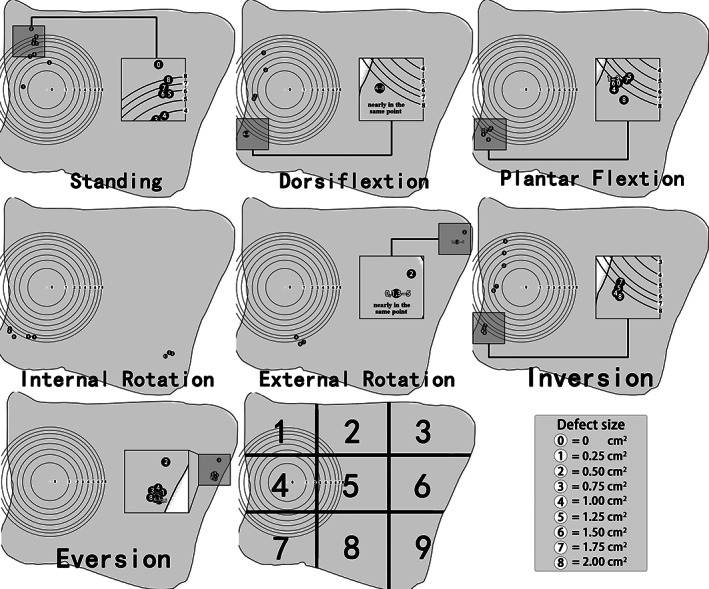
Results: The maximum stress on the talar cartilage increased as the area of the defect enlarged. Additionally, as the defect size of OLTs increased, the areas with peak stress on talar cartilage tended to move closer to where the injury was located. High stresses were present in the medial and lateral areas of the talus at the neutral position of the ankle joint. The concentrated stresses were mainly located in the anterior and posterior defect areas. The peak stress in the medial region was higher than on the lateral side. The order of peak stress from highest to lowest was dorsiflexion, internal rotation, inversion, external rotation, plantar flexion, and eversion.
Conclusions: Osteochondral defect size and ankle joint movements significantly modulate the biomechanical features of the articular cartilage in osteochondral lesions of the talus. The progression of osteochondral lesions in a talus deteriorates the biomechanical well-being of the bone tissues of the talus.
Keywords: Ankle movements; Biomechanical; Defect size; Finite element analysis; Osteochondral lesions; Talus.
© 2023 The Authors. Orthopaedic Surgery published by Tianjin Hospital and John Wiley & Sons Australia, Ltd.
Conflict of interest statement
Ruan Yaokuan, Du Yanhui, Jiang Zhende, Qian Zhihui and Chang Fei declare that they have no conflict of interest (no specific financial interests and relationships and affiliations relevant to the subject of our manuscript).
Figures
References
-
- Leontaritis N, Hinojosa L, Panchbhavi VK. Arthroscopically detected intra‐articular lesions associated with acute ankle fractures. J Bone Joint Surg Am. 2009;91(2):333–9. - PubMed
-
- Saxena A, Eakin C. Articular talar injuries in athletes: results of microfracture and autogenous bone graft. Am J Sports Med. 2007;35(10):1680–7. - PubMed
MeSH terms
Grants and funding
LinkOut - more resources
Full Text Sources
