. 2024 Jan 1;109(1):175-185.
doi: 10.3324/haematol.2022.281823.

Adenosine signaling inhibits erythropoiesis and promotes myeloid differentiation

Affiliations

Adenosine signaling inhibits erythropoiesis and promotes myeloid differentiation

Mahmoud Mikdar et al. Haematologica. .

Abstract

Intracellular uptake of adenosine is essential for optimal erythroid commitment and differentiation of hematopoietic progenitor cells. The role of adenosine signaling is well documented in the regulation of blood flow, cell proliferation, apoptosis, and stem cell regeneration. However, the role of adenosine signaling in hematopoiesis remains unclear. In this study, we show that adenosine signaling inhibits the proliferation of erythroid precursors by activating the p53 pathway and hampers the terminal erythroid maturation. Furthermore, we demonstrate that the activation of specific adenosine receptors promotes myelopoiesis. Overall, our findings indicate that extracellular adenosine could be a new player in the regulation of hematopoiesis.


Figures

Figure 1.
Figure 1.
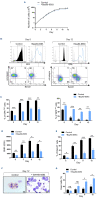
High dose of adenosine inhibits erythroid proliferation and induces cell death through activation of p53 pathway. (A) CD34+ progenitors from peripheral blood of healthy donors were stimulated with erythropoietin in the absence or presence of adenosine (50 μM) at day 0 of the differentiation phase. Growth curves of erythroid precursors from cells treated with adenosine (red line) and control (black line) cells are shown in absolute number of cells during the differentiation phase. Mann-Whitney test: ***P=0.0002, ****P<0.0001; N=9 independent experiments. (B) Percentages of apoptotic, necrotic, and living cells as monitored by Sytox blue and Annexin V co-staining of cells treated or not with adenosine at day 5 of differentiation. (C) Dead cell rate was determined by Sytox blue staining in flow cytometry and percentages of cells were plotted in bar histograms of mean cell % ± Standard Error of Mean. Unpaired t test: *P<0.05, **P<0.005, ns: not significant; N=3 independent experiments. (D) Representative western blot of p53, p21, caspase3, cleaved caspase3 expression and corresponding expression of β-actin in control (CT) and adenosine-treated (ADO) cells at day 5 of differentiation phase. (E) Cell cycle of GPA+-sorted cells was determined by CytoPhase Violet staining at day 4 of differentiation phase. G1, S, and G2/M phase are represented in blue, yellow, and green, respectively. Percentages of cells in each cell cycle phases are plotted in bar histograms. Two-way Anova test: *P=0.04; N=3 independent experiments.
Figure 2.
Figure 2.
High level of adenosine induces myeloid differentiation even in presence of erythropoietin. (A) Flow cytometric analyses of GPA were performed to follow the erythroid-lineage specification and erythroid differentiation. GPA expression was analyzed inside 7-AADneg viable cells. Data are shown as peak histograms at indicated days (erythropoietin [EPO] control, black; adenosinetreated cells, red). Erythroblast maturation was monitored via α4-integrin and Band3 levels of GPApos cells. α4-integrinhigh/Band3low cells represent less mature erythroblasts, whereas α4-integrinlow/Band3high cells are further differentiated. Frames represent gating hierarchy. (B) Percentage of GPAneg cells at day 12 of differentiation in cells cultured with or without adenosine. Data shown as mean cell % ± Standard Error of Mean. Unpaired t test: ****P<0.0001; N=6 independent experiments. (C) At day 12 of EPO-induced erythroid differentiation, adenosine-treated cells show a GPAneg subpopulation (outlined by the purple dotted square below). These GPAneg cells were FACS-sorted and analyzed by flow cytometry for expression levels of myeloid surface markers. Corresponding histograms are shown for unstained controls (shaded gray) and specific stainings (purple line) as indicated. GPAneg subpopulation was also MGG-stained; representative pictures are shown. Bar represents 10μm. (D) Characterization and count of MGG-stained adenosine-induced GPAneg cells and control cells plotted in histograms. Percentages of the respective identified-cell types are shown. (E) CD34+ cells were FACS-sorted on the basis of CD36+ at day 7 of the expansion phase, then replaced in culture and stimulated by EPO. At day 12 of EPO-induced erythroid differentiation, expression levels of GPA were compared between the previously CD36+-sorted and non-sorted cells in both control and adenosine-treated cells. Adenosine-induced GPAneg subpopulation is indicated by the bigger purple arrow in non-sorted cells, and the smaller purple arrow in CD36+-sorted cells.
Figure 3.
Figure 3.
Cl-IB-MECA decreases erythroid proliferation and induces cell death. (A) CD34+ progenitors were stimulated with erythroproietin (EPO) and treated with either adenosine, guanosine, uridine or cytidine (50 [iM) at day 0 of the differentiation phase. Growth curves are shown. A significant difference was found at day 9 between control and guanosine conditions. Mann Whitney test: P=0.0455. (B) The proliferation curve of EPO-treated control cells was compared to adenosine-only treated cells, and adenosine+NTBI (ENT1 inhibitor) co-treated cells. (C) Growth curve of EPO-stimulated control cells (black) versus EPO+25 [xM CI-IB-MECA-treated cells (purple) shown in absolute number of cells during the differentiation phase. Mann-Whitney test: **P<0.01; N=3 independent experiments. (D) Percentages of apoptotic, necrotic and viable cells were monitored by flow cytometry using Sytox blue and Annexin V co-staining of cells treated or not with CI-IB-MECA, at days 5 and 12 of differentiation. Dead cell rate was determined by Sytox blue staining at different times of differentiation, and percentages of cells were plotted in bar histograms of mean cell % ± Standard Error of Mean. Unpaired t test; *P<0.05, **P<0.01; N=3 independent experiments.
Figure 4.
Figure 4.
Activation of adenosine receptors by Cl-IB-MECA perturbs the erythroid and myeloid differentiation of hematopoietic stem and progenitor cells. (A) GPA expression was analyzed inside viable cells. Data shown as peak histograms at day 7 of differentiation (erythropoietin [EPO] control, black; CI-IB-MECA-treated cells, purple; unstained control, shaded gray), α4-integrin and Band3 expression levels of GPApos cells were analyzed to monitor erythroblast maturation. Frames represent gating hierarchy. (B) Percentages of GPAhigh and GPAlow cells, GPA intensity of fluorescence and percentages of Band3+ cells in control and CI-IB-MECA-treated cells plotted in bar histograms and presented at indicated days with corresponding colors. Unpaired t test: *P<0.05, **P<0.01, ns: not significant; N=3 independent experiments. (C) GPA, and α4-integrin and Band3 expression levels of GPApos cells, at day 12 of differentiation for EPO-stimulated control cells (black) and CI-IB-MECA treated cells (purple). Gray-shaded peaks represent unstained controls; N=2 independent experiments. (D) c-kit and CD33 were monitored at day 12 of differentiation for EPO-stimulated control cells (black) and CI-IB-MECA-treated cells (purple); N=2 independent experiments. (E) May-Grünwald Giemsa-stained cytospins of control and CI-IB-MECA-treated cells at day 12 of differentiation. Black arrow corresponds to a large eosinophil cell. Bar represents 10 μm.
Figure 5.
Figure 5.
Activation of A2B adenosine receptor impairs erythroid differentiation. (A) CD34+ progenitors from peripheral blood of healthy donors were stimulated with erythropoietin (EPO) in the absence or presence of BAY60-6583 (25 μM) at day 0 of the differentiation phase. Growth curves of erythroid precursors from control cells (black) and BAY60-6583-treated cells (blue) are shown in absolute number of cells during the differentiation phase; N=4 independent experiments. (B) Expression levels of GPA are shown for EPO-stimulated control cells (black) and EPO + BAY60-6583-treated cells (blue), as well as α4-integrin/Band3 profile at days 5 and 12 of erythroid terminal differentiation. Gray-shaded histograms correspond to unstained controls. (C) Percentages of GPAhigh and GPAlow cells are plotted in bar histograms and are presented at indicated days with corresponding colors. Unpaired t test: **P<0.01, ***P<0.001; N=4 independent experiments. (D) GPA intensity of fluorescence during erythroid differentiation is shown. Unpaired t test: *P<0.05, **P<0.01; N=4 independent experiments. (E) Percentages of Band3+ cells are shown at indicated days. Data are presented as mean ± Standard Error of Mean (SEM). Unpaired t test: *P≤0.05, **P≤0.007, ***P≤0.0009; N=4 independent experiments. (F) May-Grünwald Giemsa-stained cytospins of control and BAY60-6583-treated cells at day 12 of differentiation. Bar represents 10 μm. (G) Dead cell rate was determined by Sytox blue staining in flow cytometry and percentages of cells were plotted in bar histograms of mean cell %±SEM; N=4 independent experiments. Unpaired t test: *P<0.05, ns: not significant.

Comment in

  • The double-edged sword of adenosine.
    Plo I, Antony-Debré I. Plo I, et al. Haematologica. 2024 Jan 1;109(1):13-15. doi: 10.3324/haematol.2023.283469. Haematologica. 2024. PMID: 37470140 Free PMC article. No abstract available.

References

    1. Oburoglu L, Romano M, Taylor N, Kinet S. Metabolic regulation of hematopoietic stem cell commitment and erythroid differentiation. Curr Opin Hematol. 2016;23(3):198-205. - PubMed
    1. Romano L, Seu KG, Papoin J, et al. . Erythroblastic islands foster granulopoiesis in parallel to terminal erythropoiesis. Blood. 2022;140(14):1621-1634. - PMC - PubMed
    1. Chasis JA, Mohandas N. Erythroblastic islands: niches for erythropoiesis. Blood. 2008;112(3):470-478. - PMC - PubMed
    1. Oburoglu L, Tardito S, Fritz V, et al. . Glucose and glutamine metabolism regulate human hematopoietic stem cell lineage specification. Cell Stem Cell. 2014;15(2):169-184. - PubMed
    1. Huang NJ, Lin YC, Lin CY, et al. . Enhanced phosphocholine metabolism is essential for terminal erythropoiesis. Blood. 2018;131(26):2955-2966. - PMC - PubMed

Publication types