

Forecasting ward-level bed requirements to aid pandemic resource planning: Lessons learned and future directions
- PMID: 37199873
- PMCID: PMC10191824
- DOI: 10.1007/s10729-023-09639-2
Forecasting ward-level bed requirements to aid pandemic resource planning: Lessons learned and future directions
Abstract
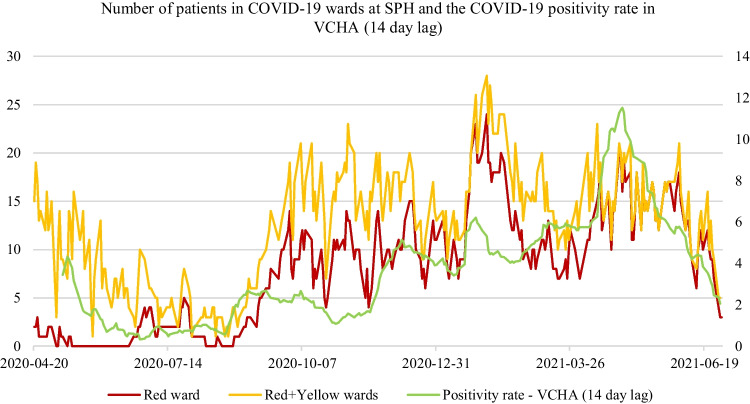
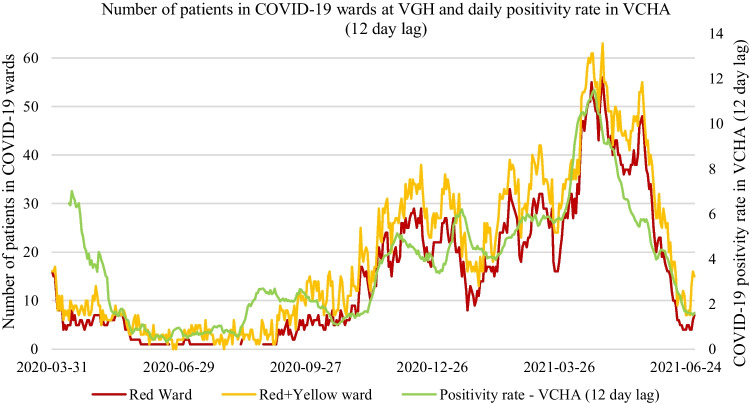
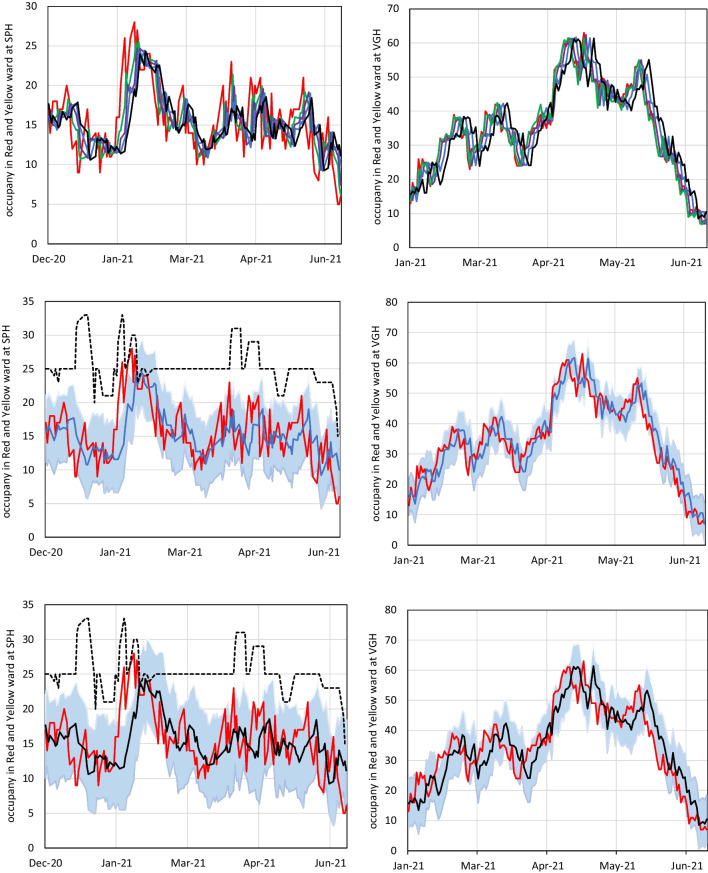
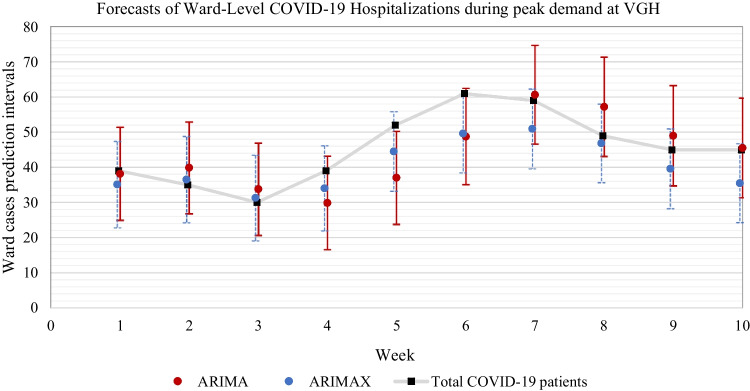
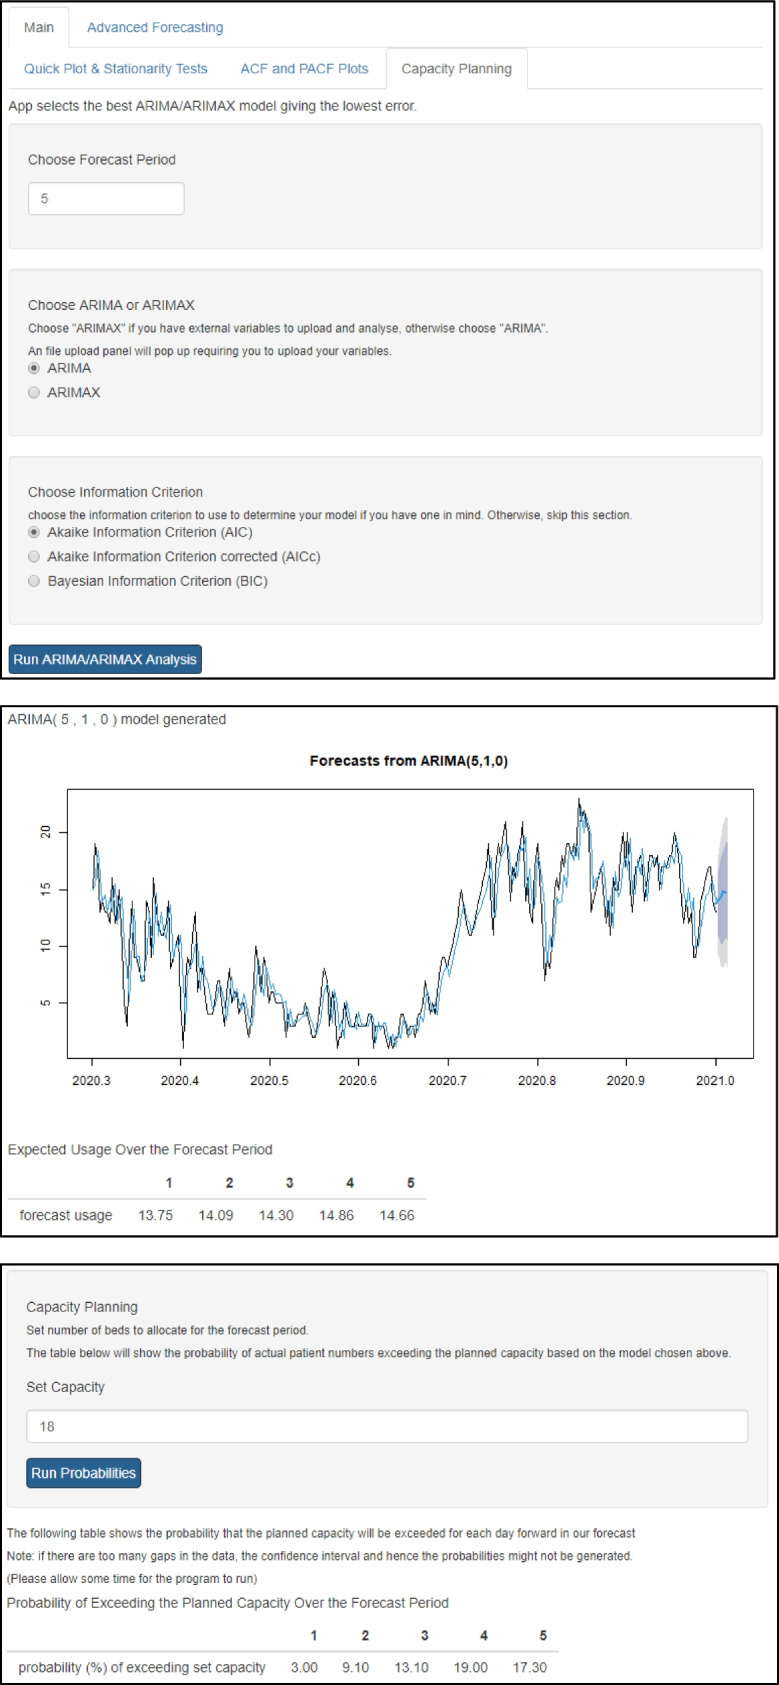
During the COVID-19 pandemic, there has been considerable research on how regional and country-level forecasting can be used to anticipate required hospital resources. We add to and build on this work by focusing on ward-level forecasting and planning tools for hospital staff during the pandemic. We present an assessment, validation, and deployment of a working prototype forecasting tool used within a modified Traffic Control Bundling (TCB) protocol for resource planning during the pandemic. We compare statistical and machine learning forecasting methods and their accuracy at one of the largest hospitals (Vancouver General Hospital) in Canada against a medium-sized hospital (St. Paul's Hospital) in Vancouver, Canada through the first three waves of the COVID-19 pandemic in the province of British Columbia. Our results confirm that traditional statistical and machine learning (ML) forecasting methods can provide valuable ward-level forecasting to aid in decision-making for pandemic resource planning. Using point forecasts with upper 95% prediction intervals, such forecasting methods would have provided better accuracy in anticipating required beds on COVID-19 hospital units than ward-level capacity decisions made by hospital staff. We have integrated our methodology into a publicly available online tool that operationalizes ward-level forecasting to aid with capacity planning decisions. Importantly, hospital staff can use this tool to translate forecasts into better patient care, less burnout, and improved planning for all hospital resources during pandemics.
Keywords: COVID-19; Forecasting; Machine learning; Pandemic resource planning; Traffic Control Bundling; Ward-level forecasting.
© 2023. The Author(s).
Conflict of interest statement
The authors have no conflicts of interest to disclose.
Figures


Similar articles
-
How New Mexico Leveraged a COVID-19 Case Forecasting Model to Preemptively Address the Health Care Needs of the State: Quantitative Analysis.JMIR Public Health Surveill. 2021 Jun 9;7(6):e27888. doi: 10.2196/27888. JMIR Public Health Surveill. 2021. PMID: 34003763 Free PMC article.
-
Learning from the first wave: Lessons about managing patient flow and resource utilization on medical wards at providence health during the COVID-19 pandemic.Healthc (Amst). 2021 Jun;9(2):100530. doi: 10.1016/j.hjdsi.2021.100530. Epub 2021 Feb 16. Healthc (Amst). 2021. PMID: 33652295 Free PMC article.
-
Learning models for forecasting hospital resource utilization for COVID-19 patients in Canada.Sci Rep. 2022 May 24;12(1):8751. doi: 10.1038/s41598-022-12491-z. Sci Rep. 2022. PMID: 35610273 Free PMC article.
-
Towards reliable forecasting of healthcare capacity needs: A scoping review and evidence mapping.Int J Med Inform. 2024 Sep;189:105527. doi: 10.1016/j.ijmedinf.2024.105527. Epub 2024 Jun 14. Int J Med Inform. 2024. PMID: 38901268
-
Deployment of an Interdisciplinary Predictive Analytics Task Force to Inform Hospital Operational Decision-Making During the COVID-19 Pandemic.Mayo Clin Proc. 2021 Mar;96(3):690-698. doi: 10.1016/j.mayocp.2020.12.019. Epub 2020 Dec 30. Mayo Clin Proc. 2021. PMID: 33673920 Free PMC article. Review.
References
-
- Statistics Canada (2021) Mental health among health care workers in Canada during the COVID-19 pandemic. In: Dly. https://www150.statcan.gc.ca/n1/daily-quotidien/210202/dq210202a-eng.htm. Accessed 30 April 2021
-
- Pelley L Health-care workers battled burnout before COVID-19 — now it’s even worse, experts warn. In: CBC News. https://www.cbc.ca/news/canada/toronto/health-care-workers-burnout-covid.... Accessed 30 April 2021
-
- Calabuig JM, Jiménez-Fernández E, Sánchez-Pérez EA, Manzanares S. Modeling hospital resource management during the covid-19 pandemic: An experimental validation. Econometrics. 2021;9:1–16. doi: 10.3390/econometrics9040038. - DOI
MeSH terms
LinkOut - more resources
Full Text Sources
Medical
