. 2023 May 2;23(5):14.
doi: 10.1167/jov.23.5.14.

History biases reveal novel dissociations between perceptual and metacognitive decision-making

Affiliations

History biases reveal novel dissociations between perceptual and metacognitive decision-making

Christopher S Y Benwell et al. J Vis. .

Abstract

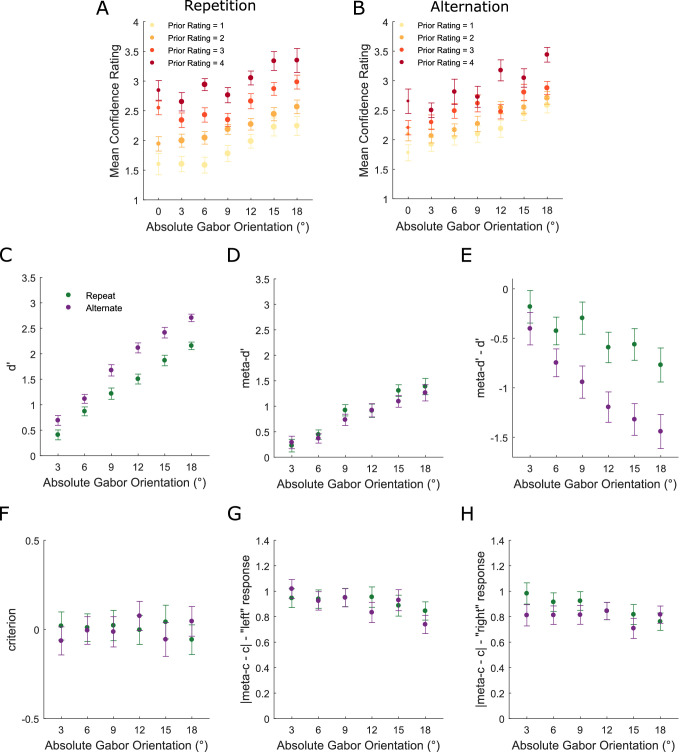
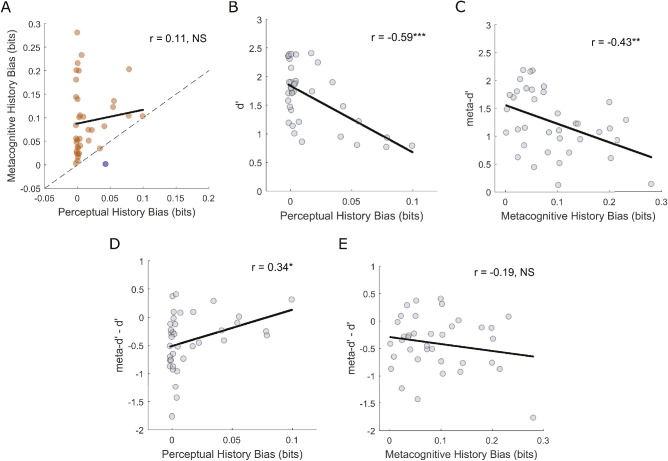
Human decision-making and self-reflection often depend on context and internal biases. For instance, decisions are often influenced by preceding choices, regardless of their relevance. It remains unclear how choice history influences different levels of the decision-making hierarchy. We used analyses grounded in information and detection theories to estimate the relative strength of perceptual and metacognitive history biases and to investigate whether they emerge from common/unique mechanisms. Although both perception and metacognition tended to be biased toward previous responses, we observed novel dissociations that challenge normative theories of confidence. Different evidence levels often informed perceptual and metacognitive decisions within observers, and response history distinctly influenced first- (perceptual) and second- (metacognitive) order decision-parameters, with the metacognitive bias likely to be strongest and most prevalent in the general population. We propose that recent choices and subjective confidence represent heuristics, which inform first- and second-order decisions in the absence of more relevant evidence.


Figures

Figure 1.
Figure 1.
(A) Behavioral task. On each trial, a Gabor orientation discrimination judgement was made followed by a confidence report (scale of 1 to 4, where 1 represented “not confident at all” and 4 represented “highly confident”). (B) Computational model of decision making and confidence in a 2-AFC task. The probability density functions represent distributions of internal responses (decision variables (DV)) across repeated presentations of the generative stimulus. On each trial, the DV is drawn from one of these distributions and compared with a decision criterion (c’: solid black vertical line) to reach a binary choice. The level of confidence in the choice is then reflected in the absolute distance of the DV from c’. When a discrete confidence rating scale is employed, the level of reported confidence is defined by where the DV falls with respect to the type-2 criteria (c2ʹ1, c2ʹ2, … c2ʹ(N−1): dashed vertical black lines), where N indexes the number of possible ratings. The type-2 (or confidence) criteria (c2ʹ) govern how far the DV must be from cʹ before an individual is willing to report a given level of confidence. A confidence rating of k will be given if the DV falls in the interval (c2ʹk−1, c2ʹk). The relative separation on the x-axis of the two distributions indexes the level of evidence available for the decision. The model is plotted for three levels of overall decision evidence: none (left panel), weak (center panel) and strong (right panel). (C) Model-based prediction of the relationship between decision accuracy and evidence strength as a function of confidence level. (D) Predicted relationship between decision confidence and evidence strength as a function of accuracy. (E) Predicted relationship between response time and evidence strength as a function of accuracy. These model-based predictions were all confirmed in the data. (F) Relationship between decision accuracy and absolute Gabor orientation as a function of confidence level. Note that data are not presented for the 0° orientation because there was no correct response here. (G) Relationship between decision confidence and absolute Gabor orientation as a function of accuracy. (H) Relationship between response time and evidence strength as a function of accuracy.
Figure 2.
Figure 2.
(A) Choice history biases perceptual decisions. Group-averaged PFs across all trials and conditioned on the previous perceptual choice. (B) Scatterplot of single-participant differences in PF threshold between “post left choice” and “post right choice” trials at trial lags of 1, 2 and 3 (black filled dots represent the group means). Positive values index a bias in favor of repeating the previous choice and negative values index a bias in favor of alternating the previous choice. Note that the perceptual bias was no longer statistically significant at trial lag +4. (C) Choice history biases confidence ratings. Group-averaged confidence ratings as a function of absolute Gabor orientation on the current trial and rating on the previous trial. The size of the dots indexes the relative number of trials contributing to the group average as this was not uniform across orientations and previous ratings. (D) Scatterplot of single-participant regression coefficients for the linear relationship between confidence on the previous and current trials at lags of 1, 2 and 3. Positive values index that “high”/“low” confidence ratings were more likely following “high”/“low” ratings respectively. Note that the confidence bias remained statistically significant up to trial lag 25. (E) Non-parametric within-participant MI analysis quantified the dependence between evidence presented on each trial (i.e., the orientation of the Gabor) and the perceptual responses/confidence ratings and, on the same effect size scale, the choice history biases in both perceptual responses and confidence ratings. (F) The relationship between perceptual choice history bias and the trial-by-trial influence of evidence on the perceptual decision. The influence of evidence was stronger in most participants (green dots) than the influence of choice history (blue dots). (G) The relationship between metacognitive choice history bias and the trial-by-trial influence of evidence on confidence ratings. There were relatively even sub-groups of participants for whom current evidence dominated confidence judgements (pink dots) vs those for whom choice history dominated confidence judgements (orange dots). Solid black lines represent least-squares regression slopes. All error bars represent within-subject ± standard error (SEM). ***p < 0.001.
Figure 3.
Figure 3.
Modeling the influence of perceptual decisions on subsequent perceptual and metacognitive performance (see Methods for details). (A) Group-averaged dʹ as a function of absolute Gabor orientation and perceptual choice on the previous trial. (B) Group-averaged meta-dʹ as a function of absolute Gabor orientation and perceptual choice on the previous trial. (C) Group-averaged meta-dʹ dʹ as a function of absolute Gabor orientation and perceptual choice on the previous trial. (D) Group-averaged c as a function of absolute Gabor orientation and perceptual choice on the previous trial. (E) Group-averaged |meta-c c| for “left” responses as a function of absolute Gabor orientation and perceptual choice on the previous trial. (F) Group-averaged |meta-c c| for “right” responses as a function of absolute Gabor orientation and perceptual choice on the previous trial. Note that data are not presented for the 0° orientation because meta-dʹ modeling cannot be applied when there is no veridical response. All error bars represent within-subject ± standard error (SEM).
Figure 4.
Figure 4.
Modelling the influence of metacognitive decisions (confidence ratings) on subsequent perceptual and metacognitive performance. (A) Group-averaged dʹ as a function of absolute Gabor orientation and confidence on the previous trial. (B) Group-averaged meta-dʹ as a function of absolute Gabor orientation and confidence on the previous trial. (C) Group-averaged meta-dʹdʹ as a function of absolute Gabor orientation and confidence on the previous trial. (D) Group-averaged c as a function of absolute Gabor orientation and confidence on the previous trial. (E) Group-averaged |meta-c c| for “left” responses as a function of absolute Gabor orientation and confidence on the previous trial. (F) Group-averaged |meta-c c| for “right” responses as a function of absolute Gabor orientation and confidence on the previous trial. Note that data are not presented for the 0° orientation because meta-dʹ modeling cannot be applied when there is no veridical response. All error bars represent within-subject ± standard error (SEM).
Figure 5.
Figure 5.
Choice history bias in confidence ratings as a function of perceptual choice hysteresis. (A) Group-averaged confidence ratings as a function of absolute Gabor orientation and rating on the previous trial for perceptual choice repetition trials. The size of the dots indexes the relative number of trials contributing to the group average as this was not uniform across orientations and previous ratings. (B) Group-averaged confidence ratings as a function of absolute Gabor orientation and rating on the previous trial for perceptual choice alternation trials. (C) Group-averaged dʹ as a function of absolute Gabor orientation and perceptual choice relative to previous choice. (D) Group-averaged meta-dʹ as a function of absolute Gabor orientation and perceptual choice relative to previous choice. (E) Group-averaged meta-dʹ dʹ as a function of absolute Gabor orientation and perceptual choice relative to previous choice. (F) Group-averaged c as a function of absolute Gabor orientation and perceptual choice relative to previous choice. (G) Group-averaged |meta-c c| for “left” responses as a function of absolute Gabor orientation perceptual choice relative to previous choice. (H) Group-averaged |meta-c c| for “right” responses as a function of absolute Gabor orientation and perceptual choice relative to previous choice. Note that data are not presented for the 0° orientation because meta-dʹ modeling cannot be applied when there is no veridical response. All error bars represent within-subject ± standard error (SEM).
Figure 6.
Figure 6.
Between-subject Pearson correlations. (A) Relationship between perceptual and metacognitive choice history biases. Metacognitive history bias was stronger in most participants (MI (Conf-1; Conf) > MI(Resp-1; Resp), 36/37 participants) than perceptual history bias (MI (Resp-1; Resp) > MI (Conf-1; Conf), 1/37 participants). (B) Relationship between perceptual choice history bias and perceptual sensitivity (dʹ). (C) Relationship between metacognitive choice history bias and metacognitive sensitivity (meta-dʹ). (D) Relationship between perceptual choice history bias and metacognitive efficiency (meta-dʹ dʹ). (E) Relationship between metacognitive choice history bias and metacognitive efficiency (meta-dʹ dʹ). Solid black lines represent least-squares regression slopes. ***p < 0.001, **p < 0.01, *p < 0.05, NS p > 0.05.

Similar articles

Cited by

References

    1. Abrahamyan, A., Silva, L. L., Dakin, S. C., Carandini, M., & Gardner, J. L. (2016). Adaptable history biases in human perceptual decisions. Proceedings of the National Academy of Sciences, 113(25), E3548–E3557. - PMC - PubMed
    1. Adler, W. T., & Ma, W. J. (2018). Limitations of proposed signatures of Bayesian confidence. Neural computation , 30(12), 3327–3354. - PubMed
    1. Ais, J., Zylberberg, A., Barttfeld, P., & Sigman, M. (2016). Individual consistency in the accuracy and distribution of confidence judgments. Cognition, 146, 377–386. - PubMed
    1. Akaishi, R., Umeda, K., Nagase, A., & Sakai, K. (2014). Autonomous mechanism of internal choice estimate underlies decision inertia. Neuron, 81(1), 195–206. - PubMed
    1. Allefeld, C., Görgen, K., & Haynes, J. D. (2016). Valid population inference for information-based imaging: From the second-level t-test to prevalence inference. Neuroimage, 141, 378–392. - PubMed

Publication types