. 2023 Jul 3;133(13):e158419.
doi: 10.1172/JCI158419.

The SWI/SNF chromatin-remodeling subunit DPF2 facilitates NRF2-dependent antiinflammatory and antioxidant gene expression

Affiliations

The SWI/SNF chromatin-remodeling subunit DPF2 facilitates NRF2-dependent antiinflammatory and antioxidant gene expression

Gloria Mas et al. J Clin Invest. .

Abstract

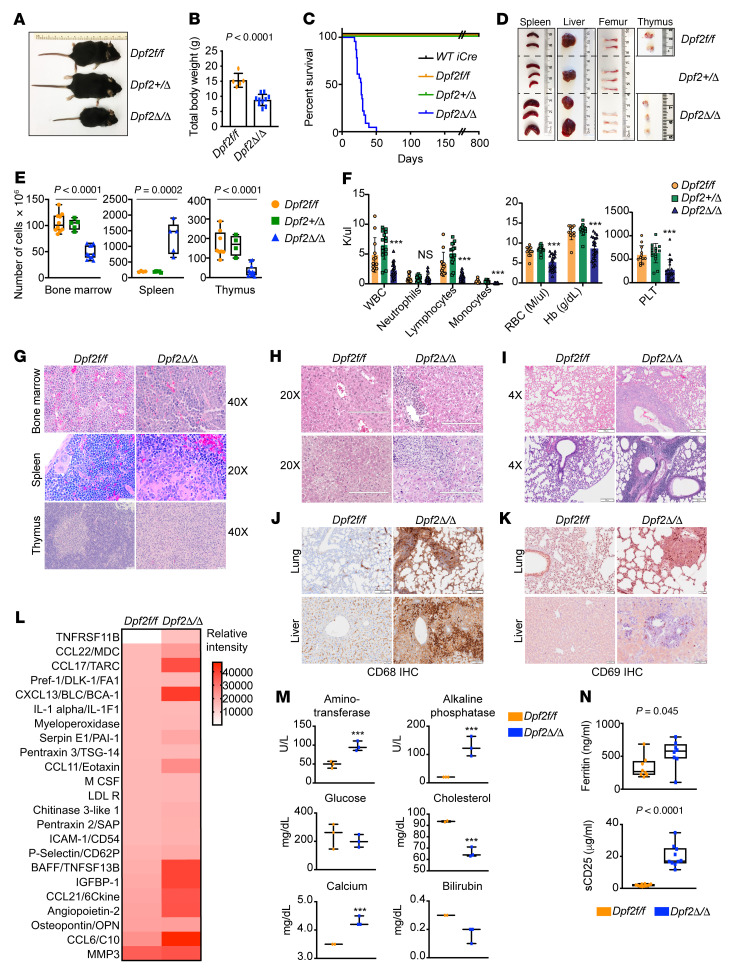
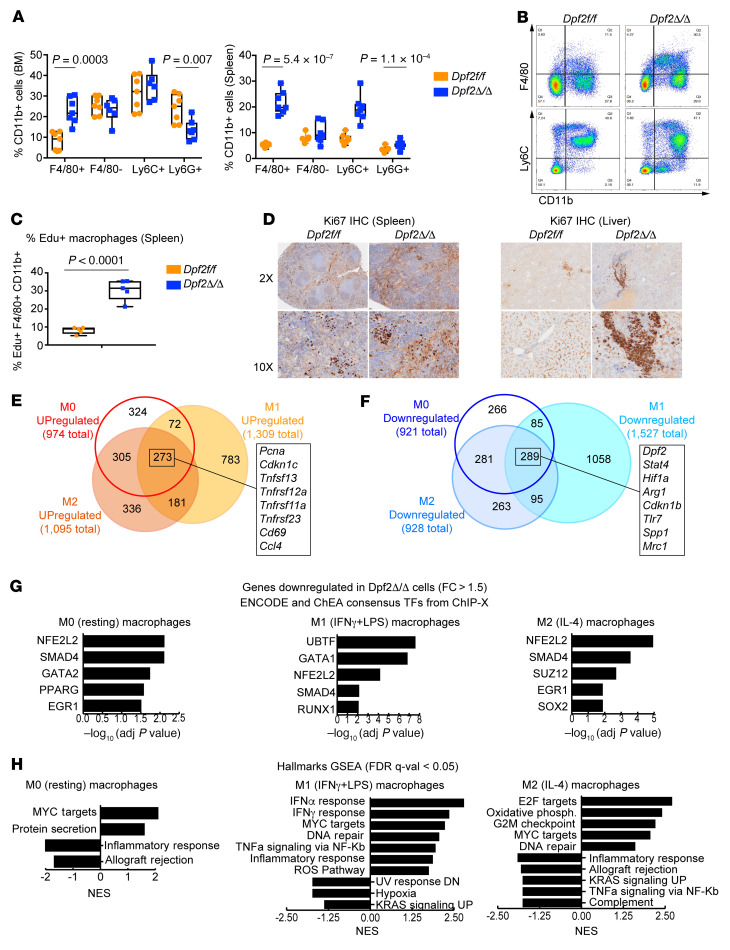
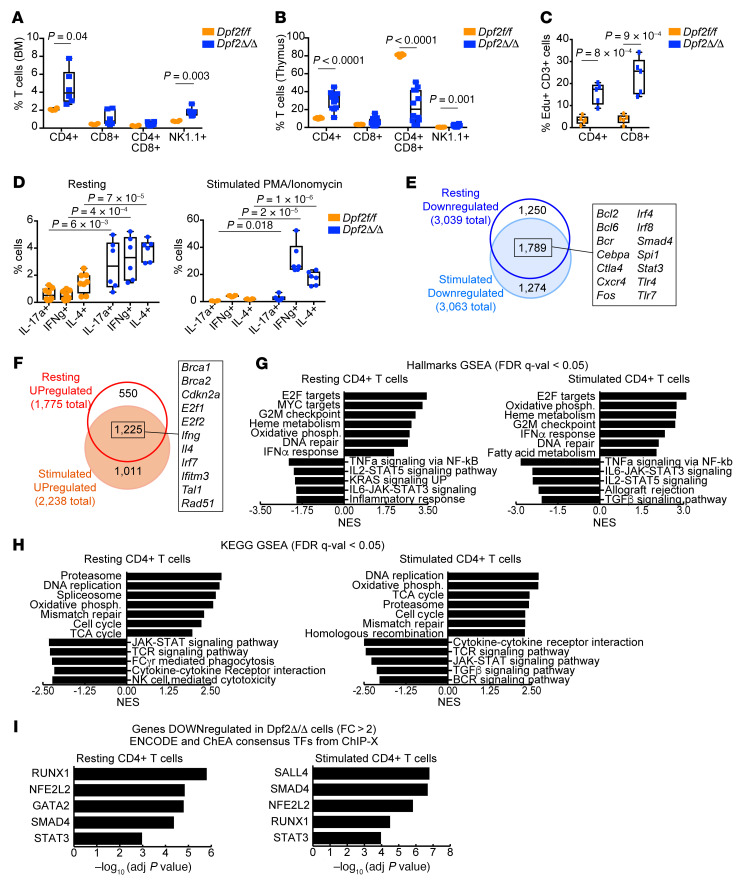
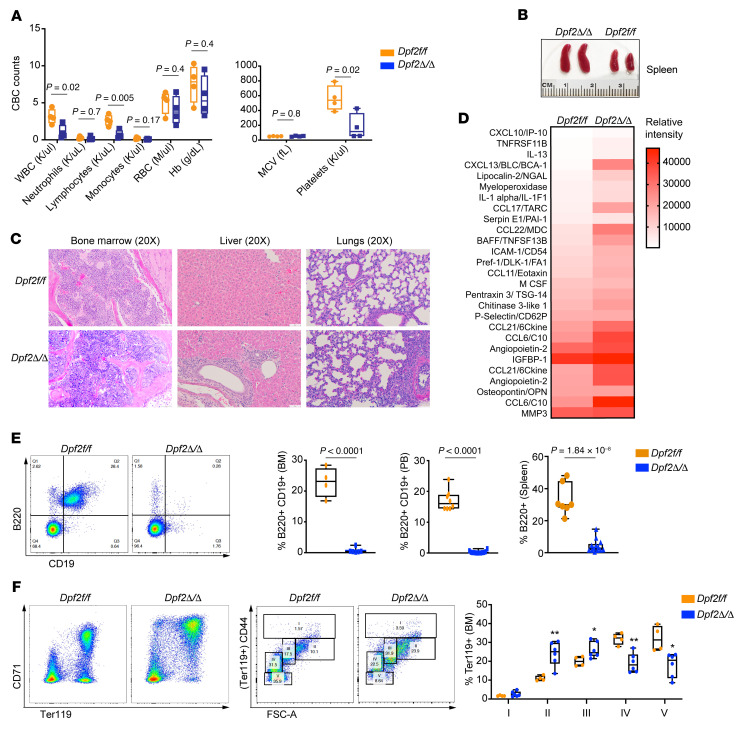
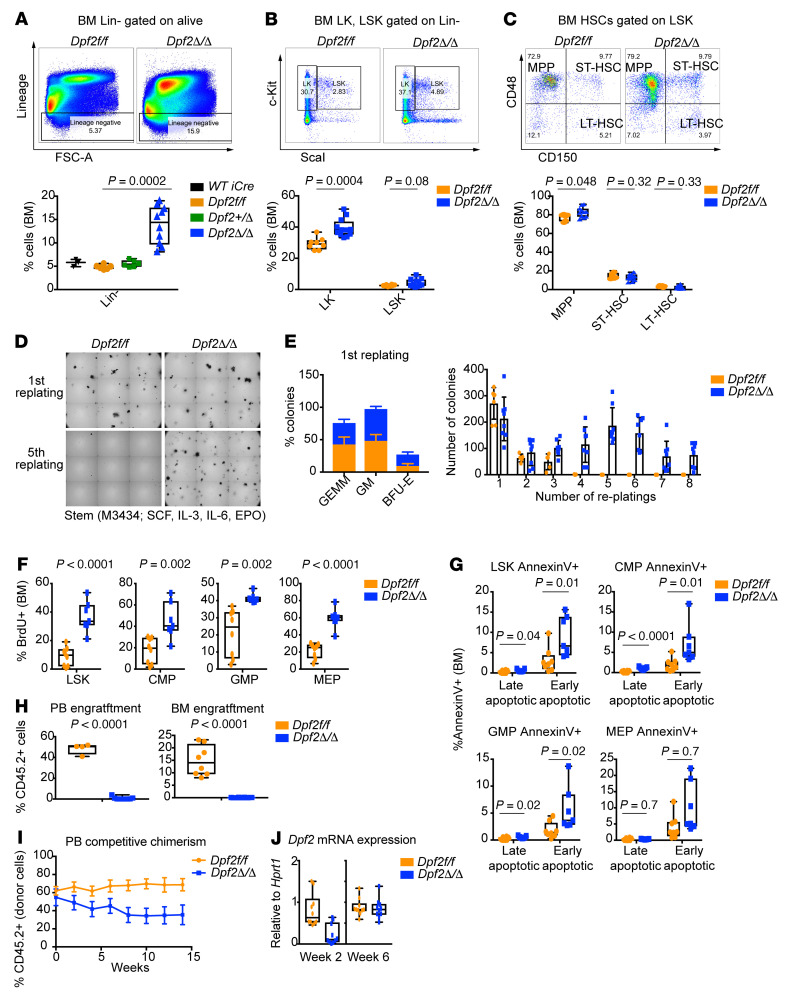
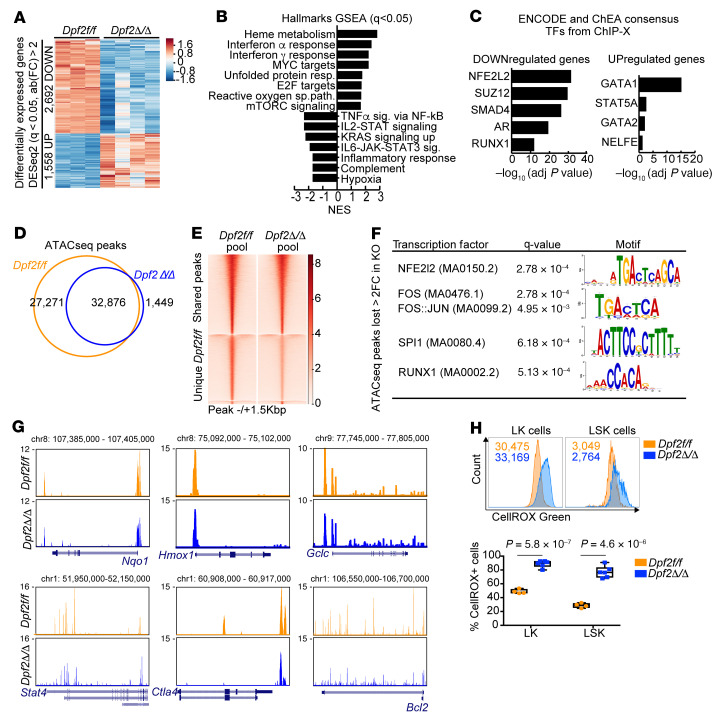
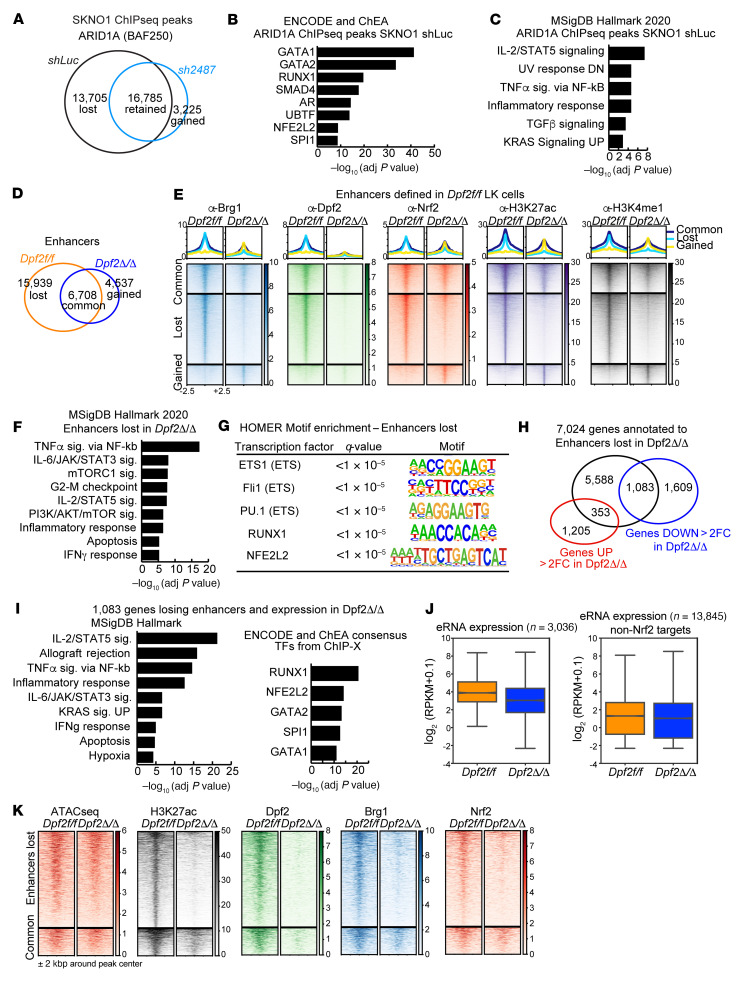
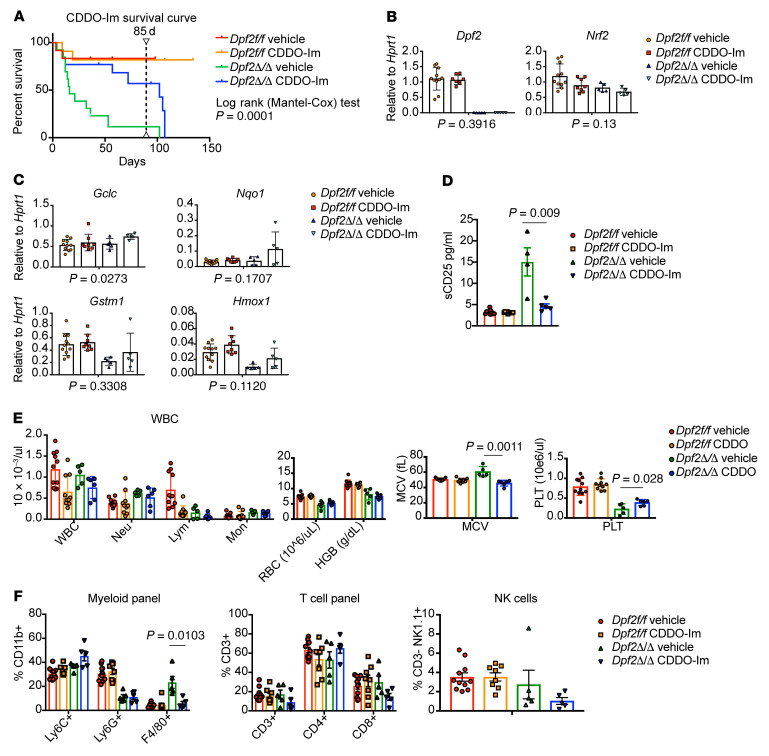
During emergency hematopoiesis, hematopoietic stem cells (HSCs) rapidly proliferate to produce myeloid and lymphoid effector cells, a response that is critical against infection or tissue injury. If unresolved, this process leads to sustained inflammation, which can cause life-threatening diseases and cancer. Here, we identify a role of double PHD fingers 2 (DPF2) in modulating inflammation. DPF2 is a defining subunit of the hematopoiesis-specific BAF (SWI/SNF) chromatin-remodeling complex, and it is mutated in multiple cancers and neurological disorders. We uncovered that hematopoiesis-specific Dpf2-KO mice developed leukopenia, severe anemia, and lethal systemic inflammation characterized by histiocytic and fibrotic tissue infiltration resembling a clinical hyperinflammatory state. Dpf2 loss impaired the polarization of macrophages responsible for tissue repair, induced the unrestrained activation of Th cells, and generated an emergency-like state of HSC hyperproliferation and myeloid cell-biased differentiation. Mechanistically, Dpf2 deficiency resulted in the loss of the BAF catalytic subunit BRG1 from nuclear factor erythroid 2-like 2-controlled (NRF2-controlled) enhancers, impairing the antioxidant and antiinflammatory transcriptional response needed to modulate inflammation. Finally, pharmacological reactivation of NRF2 suppressed the inflammation-mediated phenotypes and lethality of Dpf2Δ/Δ mice. Our work establishes an essential role of the DPF2-BAF complex in licensing NRF2-dependent gene expression in HSCs and immune effector cells to prevent chronic inflammation.

Keywords: Epigenetics; Hematology; Hematopoietic stem cells; Inflammation; Macrophages.


Figures

Figure 1
Figure 1. Hematopoiesis-specific, Vav1-Cre–mediated loss of Dpf2 leads to premature death from pancytopenia and inflammatory lesions.
(A) Representative images of Vav1-Cre–derived 28-day-old mice. (B) Total BWs of 28-day-old mice. (C) Kaplan-Meier survival curves; the median survival of Dpf2Δ/Δ mice was 28 days. (D) Representative images of organs from 28-day-old mice. (E) Total number of cells in BM, spleen, and thymus. (F) CBC of PB in approximately 28-day-old mice (n = 18). Hb, hemoglobin; PLT, platelets. (G) Representative H&E staining of BM, spleen, and thymus from 28-day-old mice. Scale bars: 50 μm. (H and I) Representative H&E staining of liver (G) and lung (H) from end-stage Dpf2Δ/Δ and age-matched Dpf2fl/fl mice. Scale bars: 200 μm. (J) Representative CD68/macrosialin IHC staining of lung and liver. Scale bars: 200 μm (lung IHC), 50 μm (Dpf2fl/fl liver), and 100 μm (Dpf2Δ/Δ liver). (K) Representative CD69 IHC staining of lung and liver infiltrates. Scale bars: 50 μm. (L) Plasma cytokine levels. Values correspond to the mean spot pixel density relative to background from 4 mice/genotype. (M) Chemistry profiling of PB from 28-day-old mice (n = 3). (N) Serum ferritin and sCD25 plasma levels. All bar graph data represent the mean ± SD. ***P < 0.001, by 2-tailed, unpaired Student’s t test (B, M, and N) and ordinary, 1-way ANOVA (E and F).
Figure 2
Figure 2. Dpf2 loss results in hyperproliferation and infiltration of macrophages.
(A) Frequency of myeloid cell populations (gated on CD11b+). (B) Representative FACS plot of BM myeloid cell populations. (C) Percentage of EdU+ splenic macrophages (F4/80+CD11b+) in end-stage Dpf2Δ/Δ and age-matched Dpf2fl/fl mice. (D) Ki67 IHC staining of spleen and liver sections. Original magnification, ×2 and ×10. (E) Overlap between genes upregulated after Dpf2 loss in M0, M1, and M2 BMDMs (q < 0.05, fold change >1.5). Highlighted are a few of the 289 genes that were upregulated in all conditions. (F) Same as in E, but for genes that were downregulated. (G) ChEA of genes downregulated in Dpf2Δ/Δ compared with Dpf2fl/fl BMDMs. (H) Hallmark GSEA of gene expression programs enriched in Dpf2Δ/Δ BMDMs. NES, normalized enrichment score; DN, downregulated; UP, upregulated. Data represent the mean ± SD. P values were calculated using a 2-tailed, unpaired Student’s t test.
Figure 3
Figure 3. Absence of Dpf2 leads to the expansion and increased cytokine production of T cell populations.
(A) Frequency of CD3+ T and NK cells (CD3NK1.1+) in BM of 28-day-old mice. (B) Same as A, but in the thymus. (C) Percentage of EdU+CD3+ splenic T cell populations. (D) Flow cytometric analyses of intracellular cytokines expressed from sorted CD4+ T cell subsets after stimulation. (E) Overlap between genes downregulated after Dpf2 loss in resting or stimulated CD4+ T cells (q < 0.05, fold change >2). Highlighted are a few of the 1,789 genes downregulated after Dpf2 loss in both conditions. (F) Same as in E, but for genes that were upregulated. (G) Hallmark GSEA of gene expression programs enriched in Dpf2Δ/Δ compared with Dpf2fl/fl CD4+ T cells. (H) KEGG GSEA of pathways enriched in Dpf2Δ/Δ CD4+ T cells. (I) ENCODE and ChEA consensus TFs from ChIP coupled with high-throughput techniques (ChIP-X) analysis obtained from genes that were downregulated (q < 0.05, fold change >2) in Dpf2Δ/Δ compared with Dpf2fl/fl CD4+ T cells. Plots represent the mean ± SEM. P values were calculated using a 2-tailed, unpaired Student’s t test except for panel D, which was calculated using 2-way ANOVA. Absence of a P value indicates a nonsignificant difference.
Figure 4
Figure 4. BM of Dpf2Δ/Δ mice displays early expansion of macrophages and T cells, with impaired B cell and erythroid cell differentiation.
(A) PB CBC from 14-day-old mice (n = 4). MCV, mean corpuscular volume. (B) Representative images of spleens from 14-day-old mice. (C) H&E staining of BM, liver, and lungs from 14-day old mice. Scale bars: 50 μm. (D) Plasma cytokine levels in 14-day-old mice. Values correspond to the mean spot pixel density relative to background in 4 mice/genotype. (E) Representative FACS plots of BM B cells and quantification of B cell frequency in BM, PB, and spleen of end-stage Dpf2Δ/Δ mice and Dpf2fl/fl littermates. (F) Representative FACS plots of BM erythroid cell maturation based on the expression of CD71 and Ter119 surface markers (107). FACS profiles resolve 5 distinct clusters: clusters IV and V (low CD44 and smaller size) correspond to orthochromatic erythroblasts, reticulocytes, and mature RBCs; clusters I, II, and III (higher CD44 and larger size) correspond to immature nucleated erythroblasts, specifically pro-erythroblasts, basophilic erythroblasts, and polychromatic erythroblasts, respectively. FSC-A, forward scatter area. Bar graph data represent the mean ± SEM. *P < 0.05 and **P < 0.01, by 2-tailed, unpaired Student’s t test.
Figure 5
Figure 5. Dpf2 deletion enhances HSC replating capacity, proliferation, and apoptosis and impairs HSC transplantability.
(A) Representative FACS and quantification of Lin cell populations. (B) Same as in A, but for LK and LSK cell populations gated from BM Lin cells. (C) Representative FACS and frequency of BM MPPs (Linc-Kit+Sca1+CD48+CD150), short-term HSCs (ST-HSCs) (Linc-Kit+Sca1+CD48+CD150+), and long-term HSCs (LT-HSCs) (Linc-Kit+Sca1+CD48CD150+) gated on LSK cells. (D) Colonies on the first and fifth replatings of Lin BM cells. (E) Colony types on the first plating (n = 6) and quantification of CFU during 8 consecutive replatings. GEMM, CFU granulocyte, erythrocyte, macrophage, megakaryocyte; BFU-E, erythroid burst-forming units. (F) Percentage of BrdU+ cells within the indicated populations. (G) Percentage of annexin V+ cells within the indicated populations. Early apoptotic cells: annexin V+, viability dye; late apoptotic and necrotic cells: annexin V+, viability dye+. (H) PB and BM engraftment of donor cells (CD45.2+) from 28-day-old mice transplanted into sublethally irradiated recipient mice. Engraftment was analyzed 4 weeks after transplantation. (I) Flow analyses of PB competitive chimerism. (J) Dpf2 mRNA expression levels in PB, 2 and 6 weeks after tamoxifen administration. Plots represent the mean ± SEM. P values were calculated using a 2-tailed, unpaired Student’s t test except for data in panel A, for which a 2-way ANOVA was applied. Absence of a P value indicates a nonsignificant difference.
Figure 6
Figure 6. Dpf2 deficiency in HSPCs results in the downregulation of NRF2 target genes.
(A) Differentially expressed genes (q < 0.05, fold change >2) in LK cells from 28-day-old mice. (B) GSEA of hallmark gene expression profiles of Dpf2Δ/Δ compared with Dpf2fl/fl LK cells. resp., response; reactive oxygen sp. path., ROS path; sig., signaling. (C) ENCODE and ChEA consensus TFs from ChIP-X analysis of genes deregulated in Dpf2Δ/Δ LK cells. (D) Overlap between ATAC-Seq peaks called in Dpf2fl/fl and Dpf2Δ/Δ cells. (E) Average ATAC-Seq signal in LK cells. Top cluster corresponds to 32,876 peaks common between control and KO cells; middle cluster corresponds to 27,271 peaks unique in Dpf2fl/fl cells; bottom cluster corresponds to 1,449 peaks unique in Dpf2Δ/Δ cells. (F) TF motif analysis of ATAC-Seq peaks lost in Dpf2Δ/Δ LK cells (i.e, with >2-fold higher signal in Dpf2fl/fl vs. Dpf2Δ/Δ cells). Motifs were ranked on the basis of q value significance. FC, fold change. (G) UCSC Genome Browser snapshots showing pooled ATAC-Seq signals in Dpf2fl/fl and Dpf2Δ/Δ LK cells. (H) Flow cytometric analysis of ROS production by BM LK and LSK cells from end-stage mice. Plots represent the mean ± SEM. P values were calculated using a 2-tailed, unpaired Student’s t test.
Figure 7
Figure 7. Dpf2 deletion impairs BRG1 and NRF2 binding and activation of cognate regulatory enhancers.
(A) Overlap between ARID1A ChIP-Seq peaks in SKNO-1 shLuc and shDPF2 (hairpin number 2487) cells. (B) ENCODE and ChEA consensus TFs from ChIP-X analysis of genes that lose ARID1A occupancy in SKNO-1 shDpf2 cells compared with shLuc cells. (C) Molecular Signatures Database (MSigDB) hallmark analyses of pathways enriched among genes that lose ARID1A occupancy. (D) Overlap between enhancers identified in Dpf2fl/fl and in Dpf2Δ/Δ LK cells. (E) BRG1, DPF2, NRF2, H3K27ac, and H3K4me1 CUT&RUN signal at enhancers that are common, gained, or lost in Dpf2Δ/Δ versus Dpf2fl/fl LK cells. (F) MSigDB hallmark analysis of 7,024 genes annotated to the 15,939 enhancers lost in Dpf2Δ/Δ LK cells. (G) HOMER motif enrichment analysis on the 15,939 enhancers lost in Dpf2Δ/Δ LK cells. (H) Overlap between the 7,024 genes annotated to enhancers lost in Dpf2Δ/Δ LK cells, and the differentially expressed genes in Dpf2Δ/Δ compared with Dpf2fl/fl LK cells (q < 0.05, fold change >2). (I) MSigDB hallmark analysis and ENCODE and ChEA consensus TFs from ChIP-X analysis obtained from 1,083 genes that lose nearby enhancers and are downregulated in Dpf2Δ/Δ LK cells. (J) Box-and-whisker plots of eRNAs expressed from DPF2-NRF2 co-occupied active enhancers in Dpf2fl/fl and Dpf2Δ/Δ LK cells (n = 3,036, left plot; ***P < 0.001, by 2-tailed Student’s t test) and from active enhancers not occupied by NRF2 (n = 13,845, right plot). RPKM, reads per kilobase per million mapped reads. Error bars represent the SD. The center line of the box plots represents the median, and the upper and lower bounds of the whiskers represent the maximum and minimum values, respectively. (K) ATAC-Seq, H3K27ac, DPF2, BRG1, and NRF2 signals at enhancers that are lost or maintained (“common”) in Dpf2Δ/Δ LK cells. adj, adjusted.
Figure 8
Figure 8. Pharmacological stimulation of NRF2 can restore gene expression and prolong survival of the Dpf2Δ/Δ mice.
(A) Kaplan-Meier survival curves of mice treated with vehicle or CDDO-Im. Treatment was interrupted after 85 days (dashed line). A log-rank (Mantel-Cox) text was performed to determine significant differences in the survival of Dpf2Δ/Δ mice treated with vehicle or CDDO-Im. (B and C) Expression of Dpf2 and Nrf2 (B), and NRF2 target genes (C) in LK cells from Dpf2fl/fl and Dpf2Δ/Δ mice treated with vehicle or CDDO-Im. P value for vehicle-treated versus CDDO-Im–treated Dpf2Δ/Δ mouse data are indicated below each plot. (D) sCD25 in plasma from the indicated groups of mice. (E) PB counts in mice treated for 2 weeks with vehicle or CDDO-Im. (F) Flow cytometric analyses of splenic cell populations. Data represent the mean ± SEM. P values were calculated using 2-way ANOVA.

Similar articles

Cited by

References

    1. Ratajczak MZ, Kucia M. Hematopoiesis and innate immunity: an inseparable couple for good and bad times, bound together by an hormetic relationship. Leukemia. 2022;36(1):23–32. doi: 10.1038/s41375-021-01482-0. - DOI - PMC - PubMed
    1. Boettcher S, Manz MG. Regulation of inflammation- and infection-driven hematopoiesis. Trends Immunol. 2017;38(5):345–357. doi: 10.1016/j.it.2017.01.004. - DOI - PubMed
    1. Matatall KA, et al. Chronic infection depletes hematopoietic stem cells through stress-induced terminal differentiation. Cell Rep. 2016;17(10):2584–2595. doi: 10.1016/j.celrep.2016.11.031. - DOI - PMC - PubMed
    1. Mashtalir N, et al. Modular organization and assembly of SWI/SNF family chromatin remodeling complexes. Cell. 2018;175(5):1272–1288. doi: 10.1016/j.cell.2018.09.032. - DOI - PMC - PubMed
    1. Michel BC, et al. A non-canonical SWI/SNF complex is a synthetic lethal target in cancers driven by BAF complex perturbation. Nat Cell Biol. 2018;20(12):1410–1420. doi: 10.1038/s41556-018-0221-1. - DOI - PMC - PubMed

Publication types