. 2023 Jun 1;127(21):4746-4760.
doi: 10.1021/acs.jpcb.3c01619. Epub 2023 May 18.

The Analytical Flory Random Coil Is a Simple-to-Use Reference Model for Unfolded and Disordered Proteins

Affiliations

The Analytical Flory Random Coil Is a Simple-to-Use Reference Model for Unfolded and Disordered Proteins

Jhullian J Alston et al. J Phys Chem B. .

Abstract

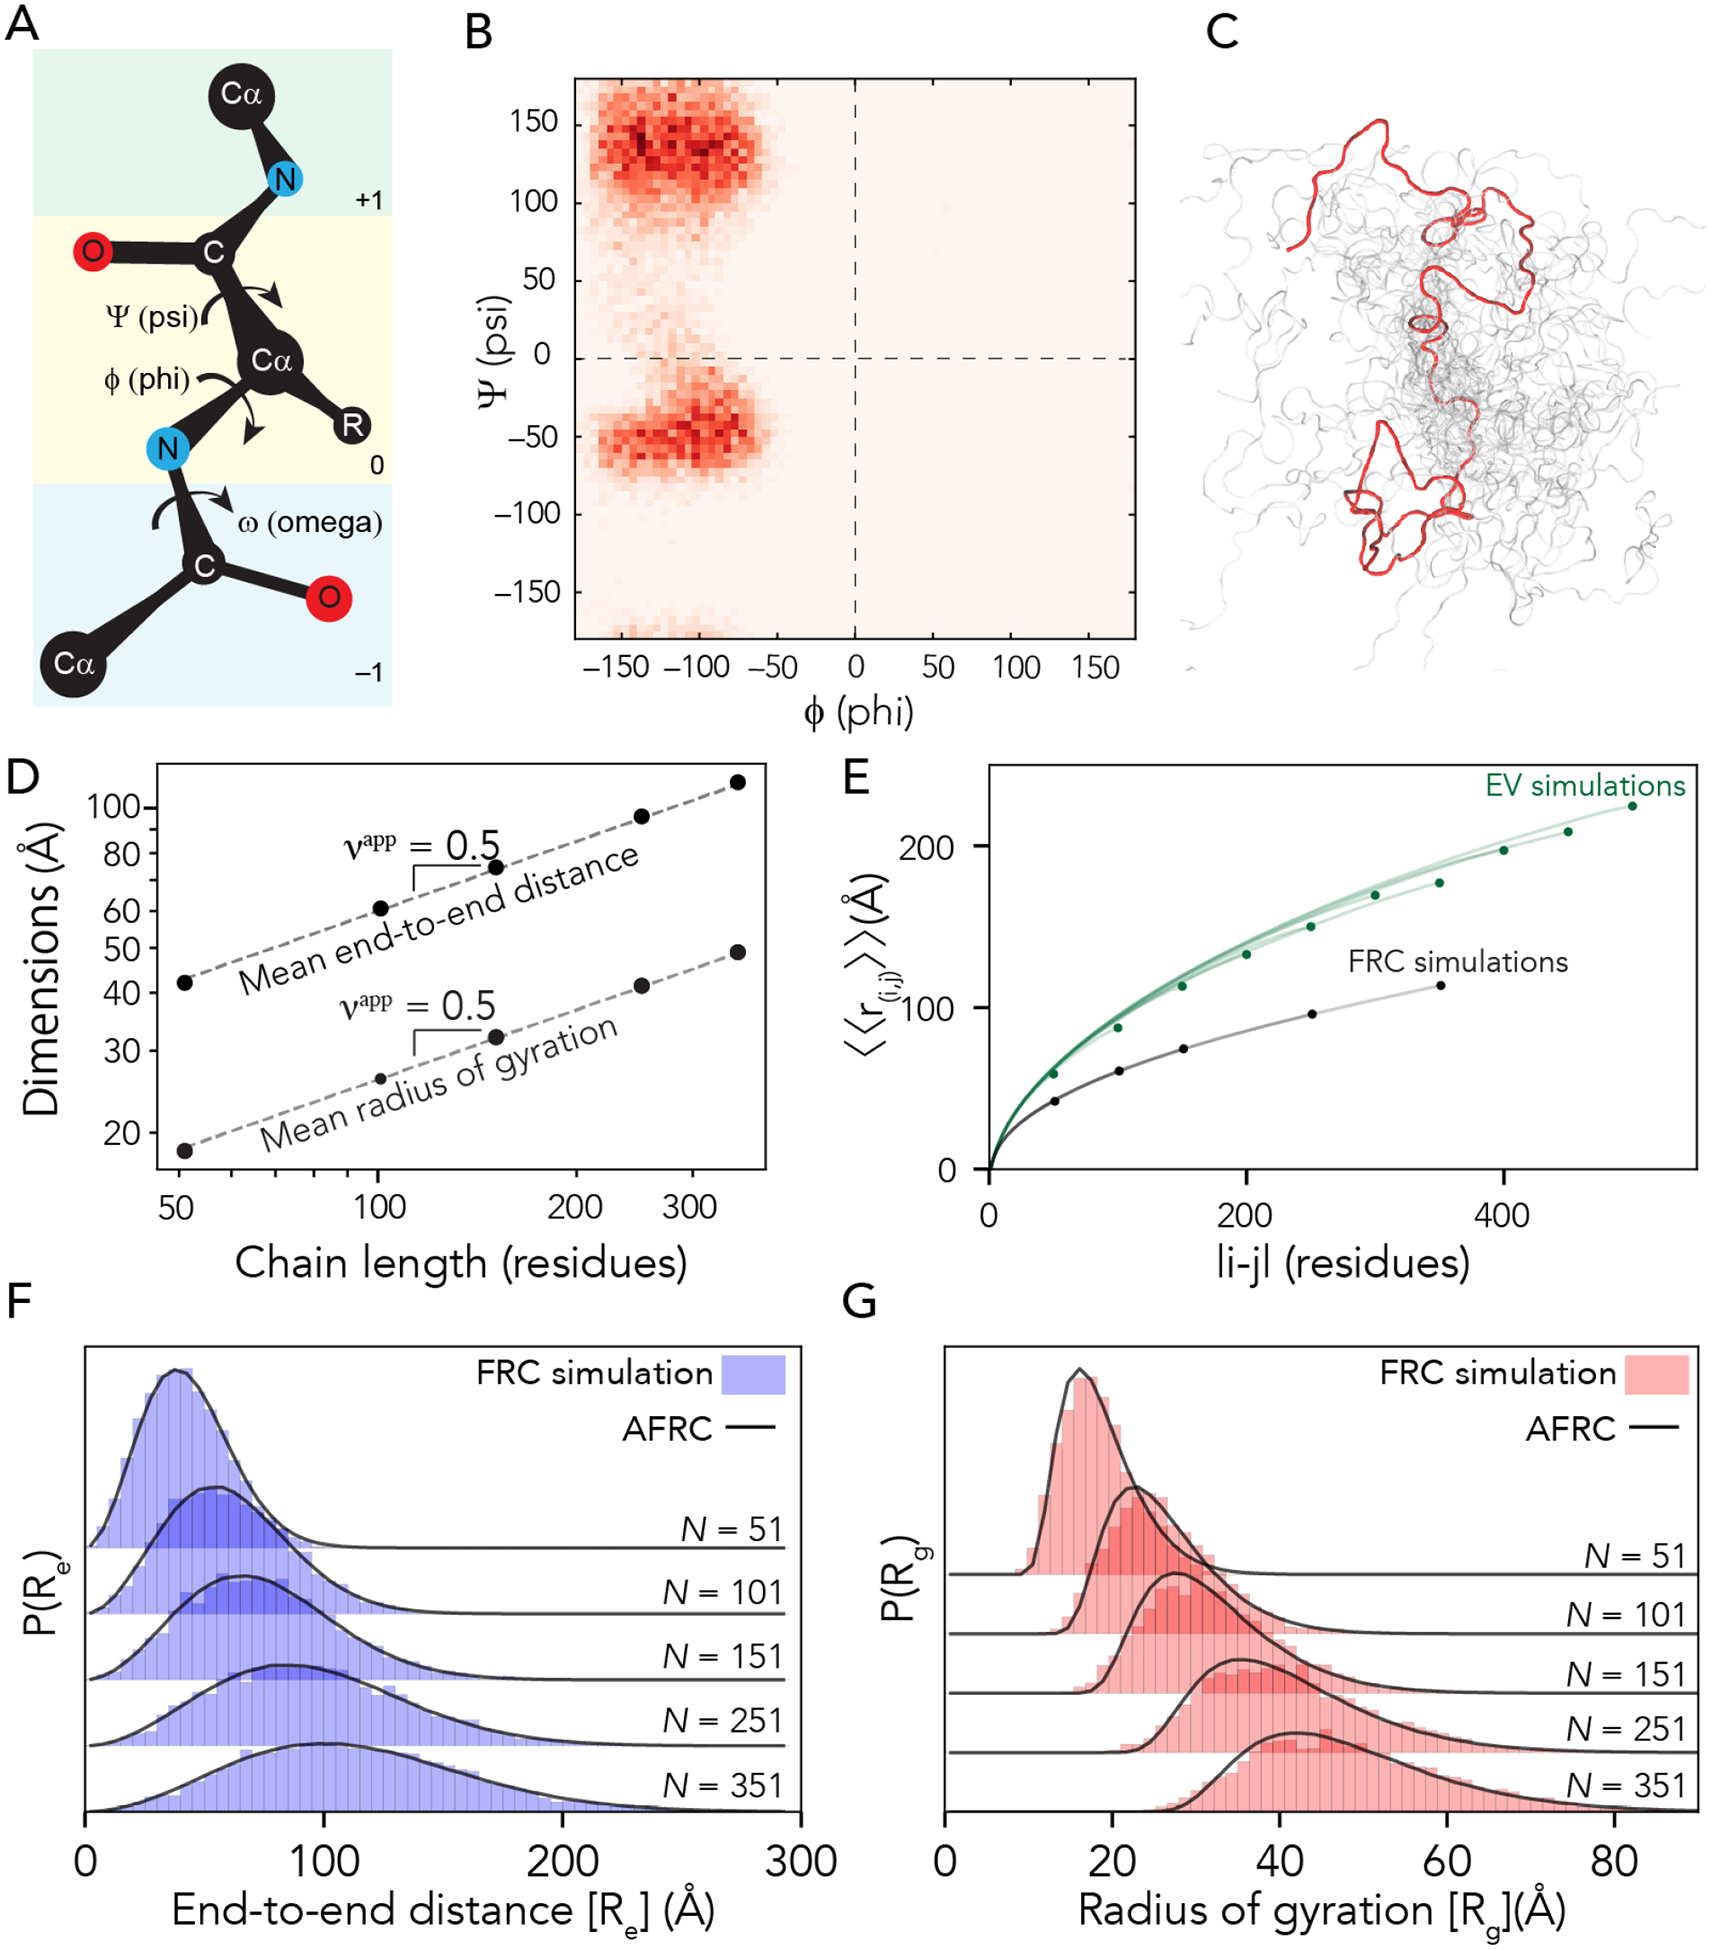
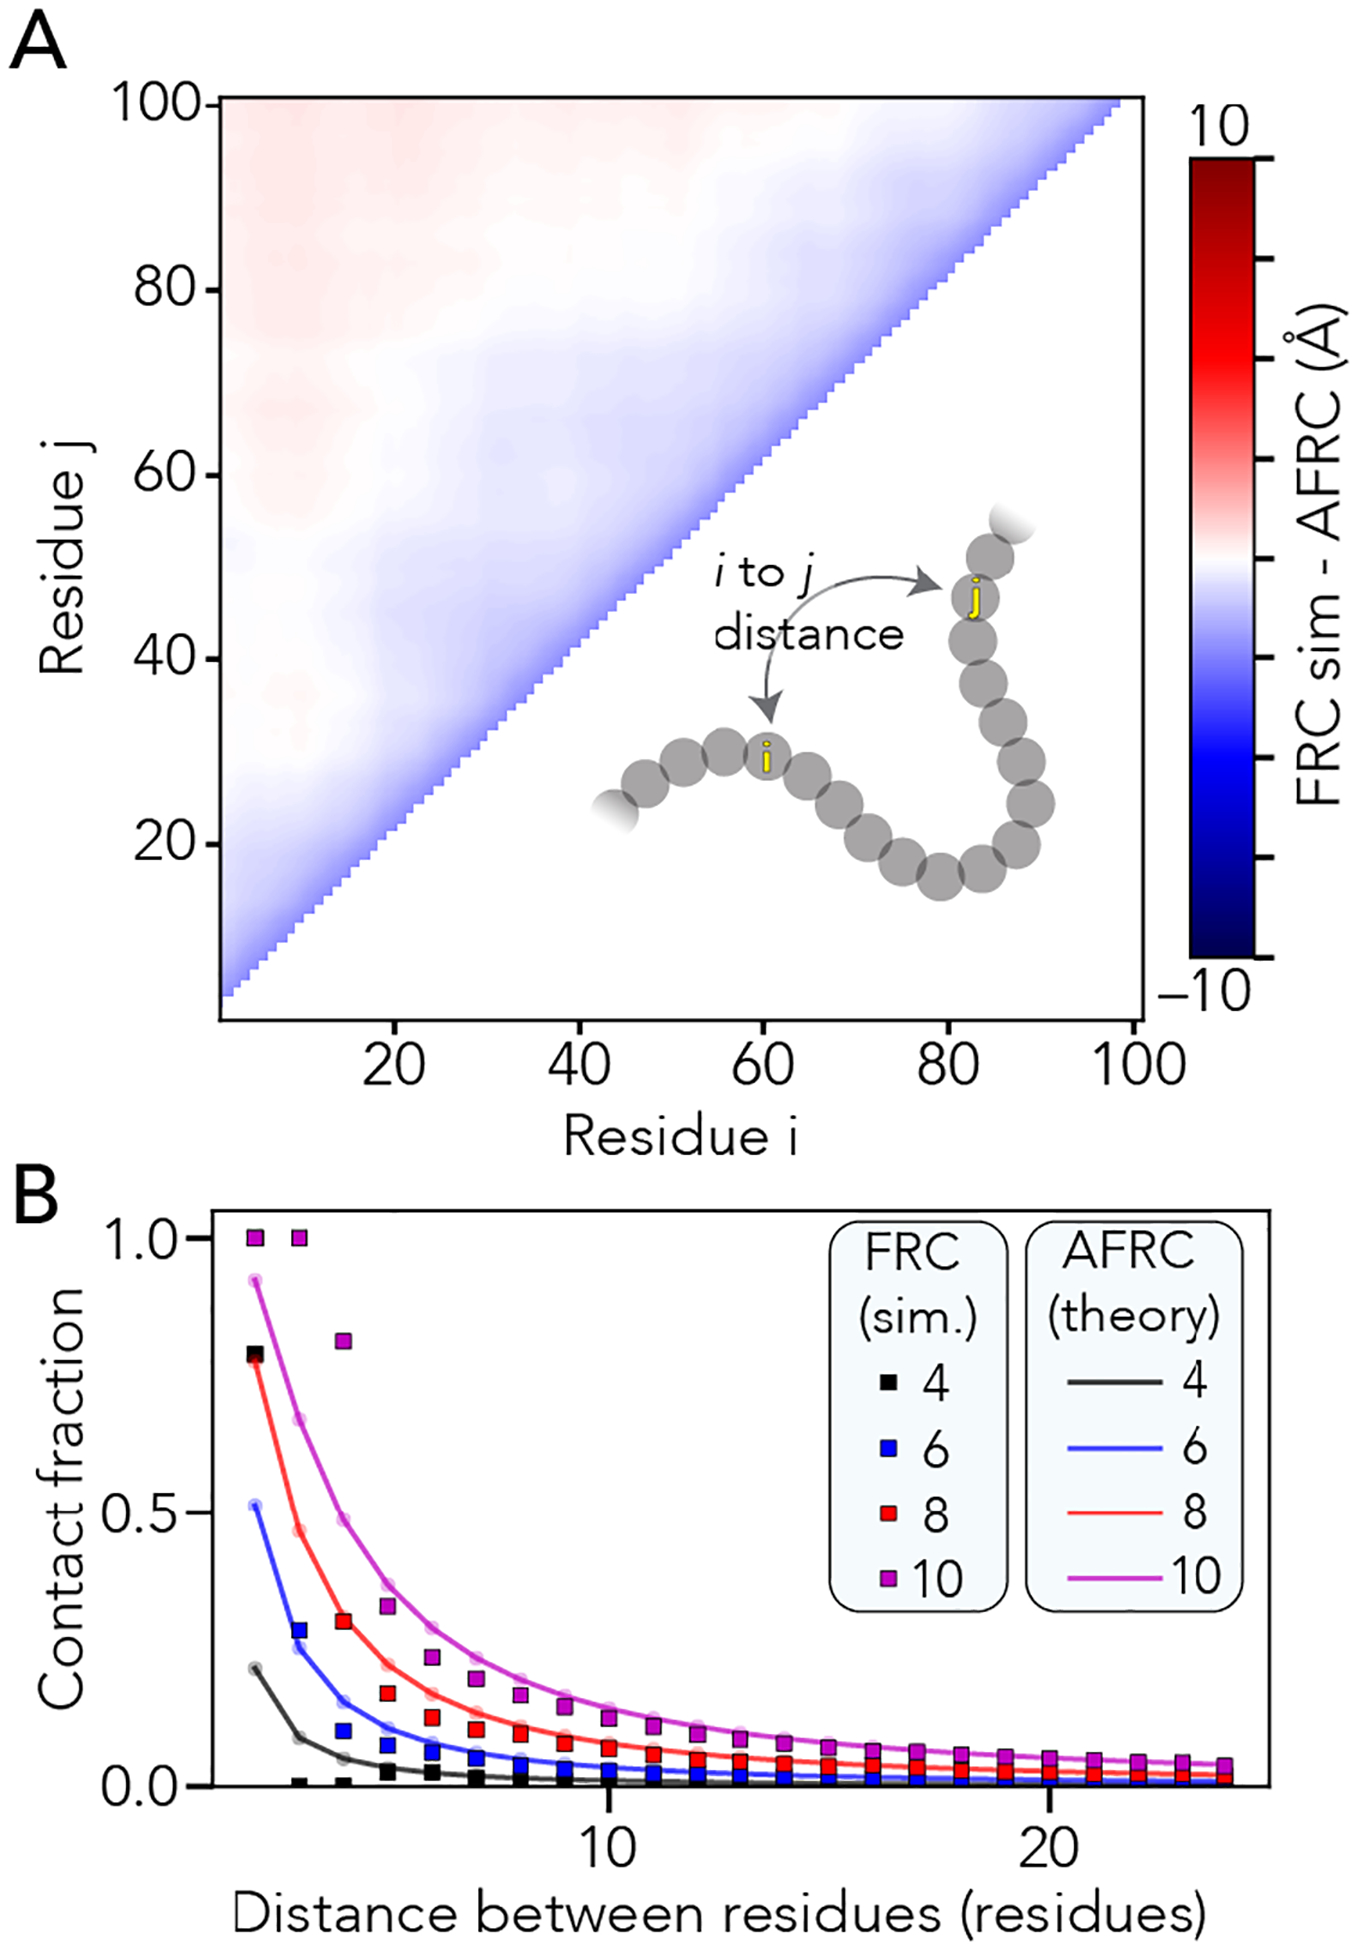
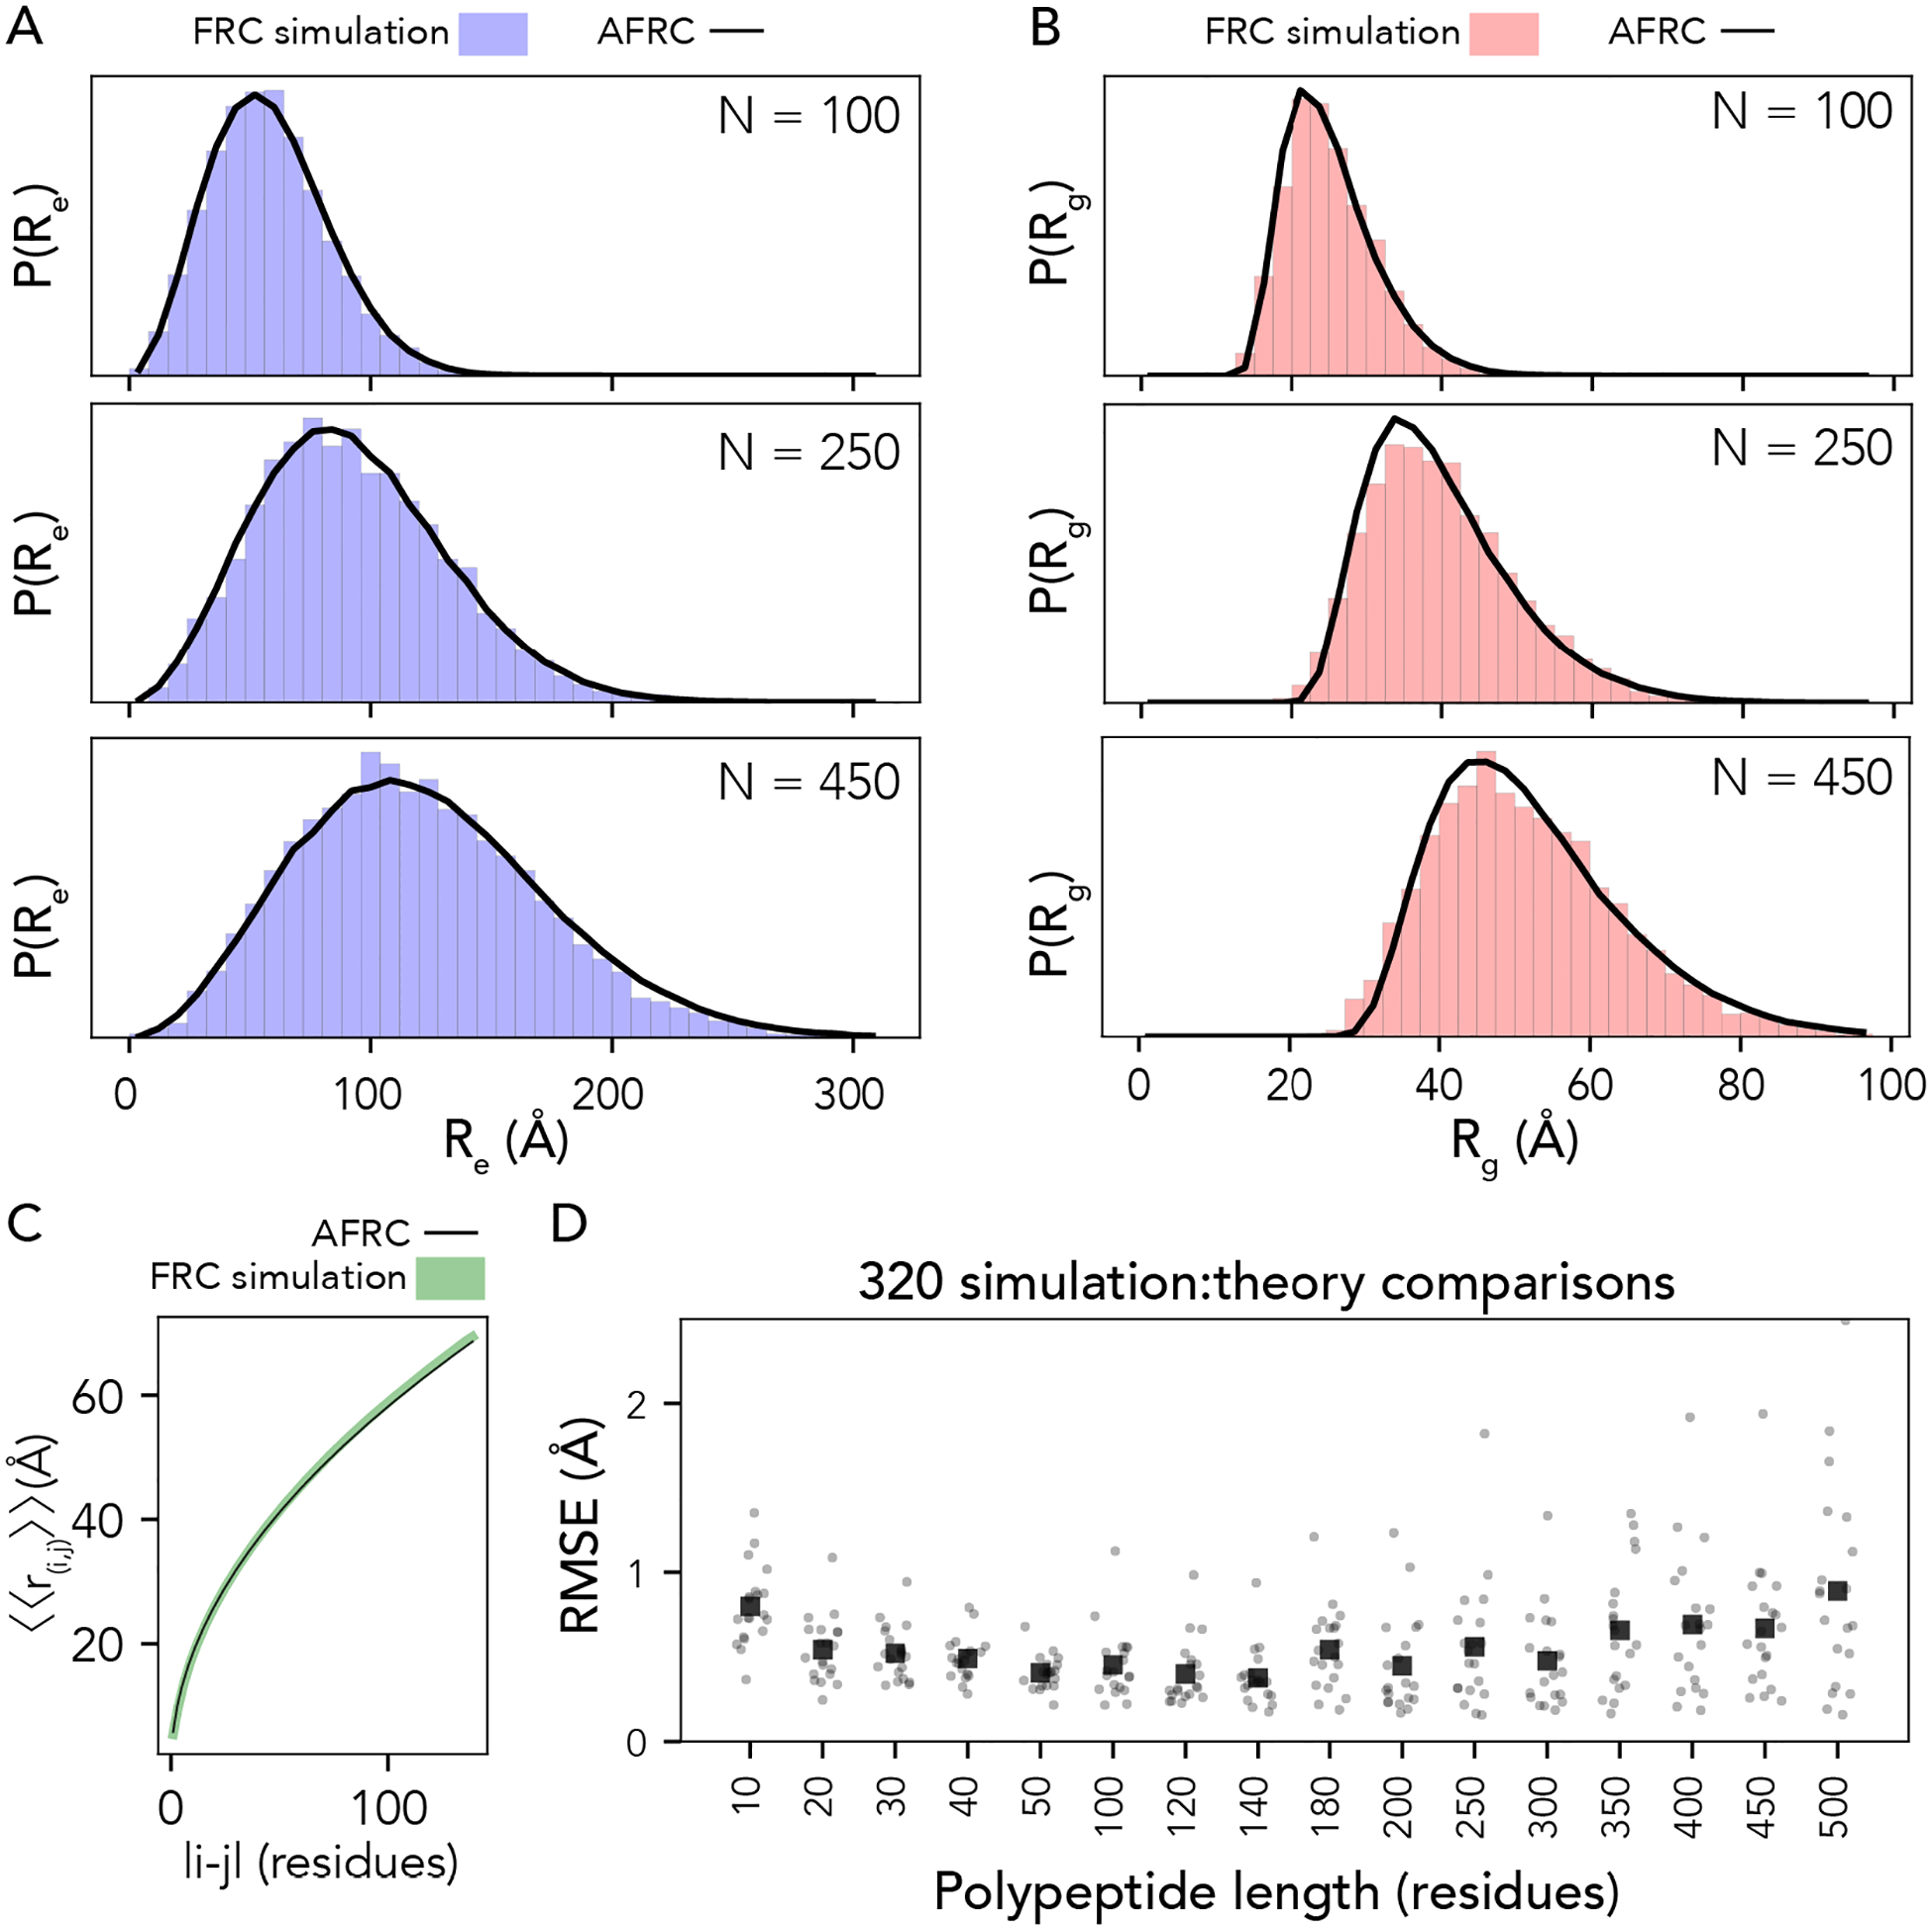
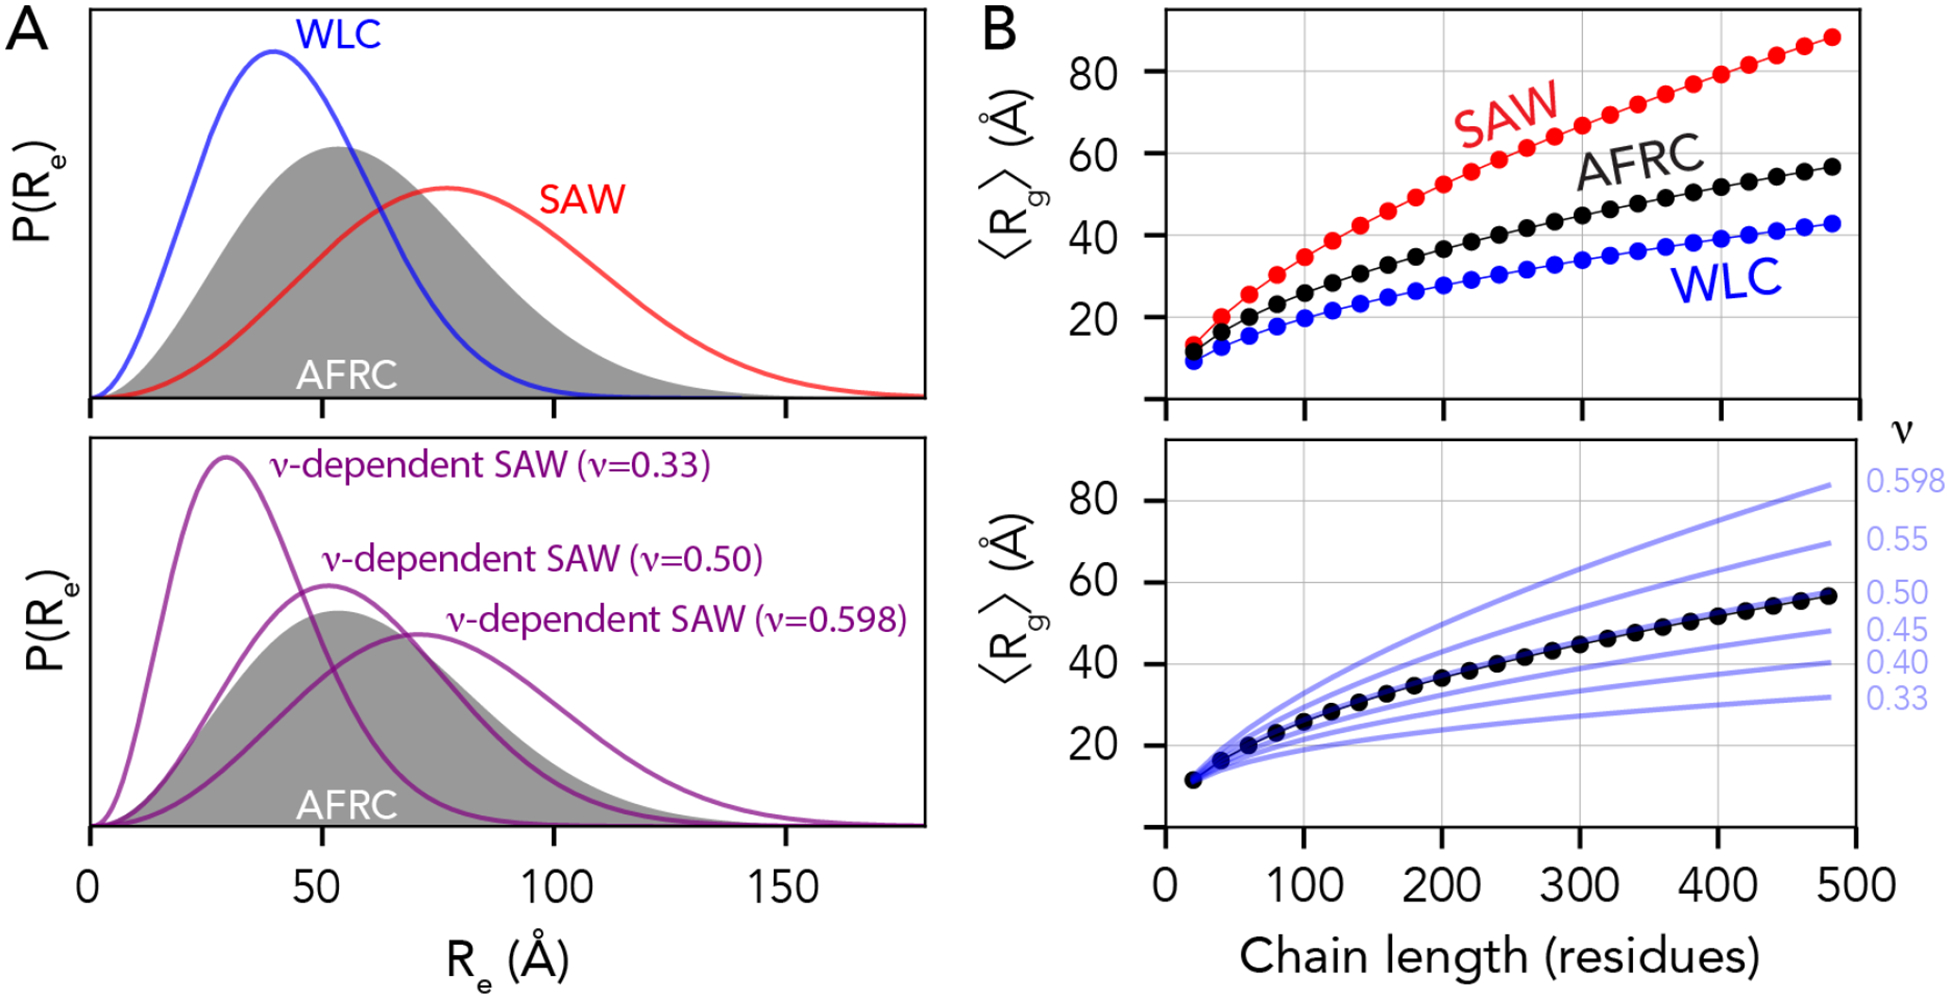
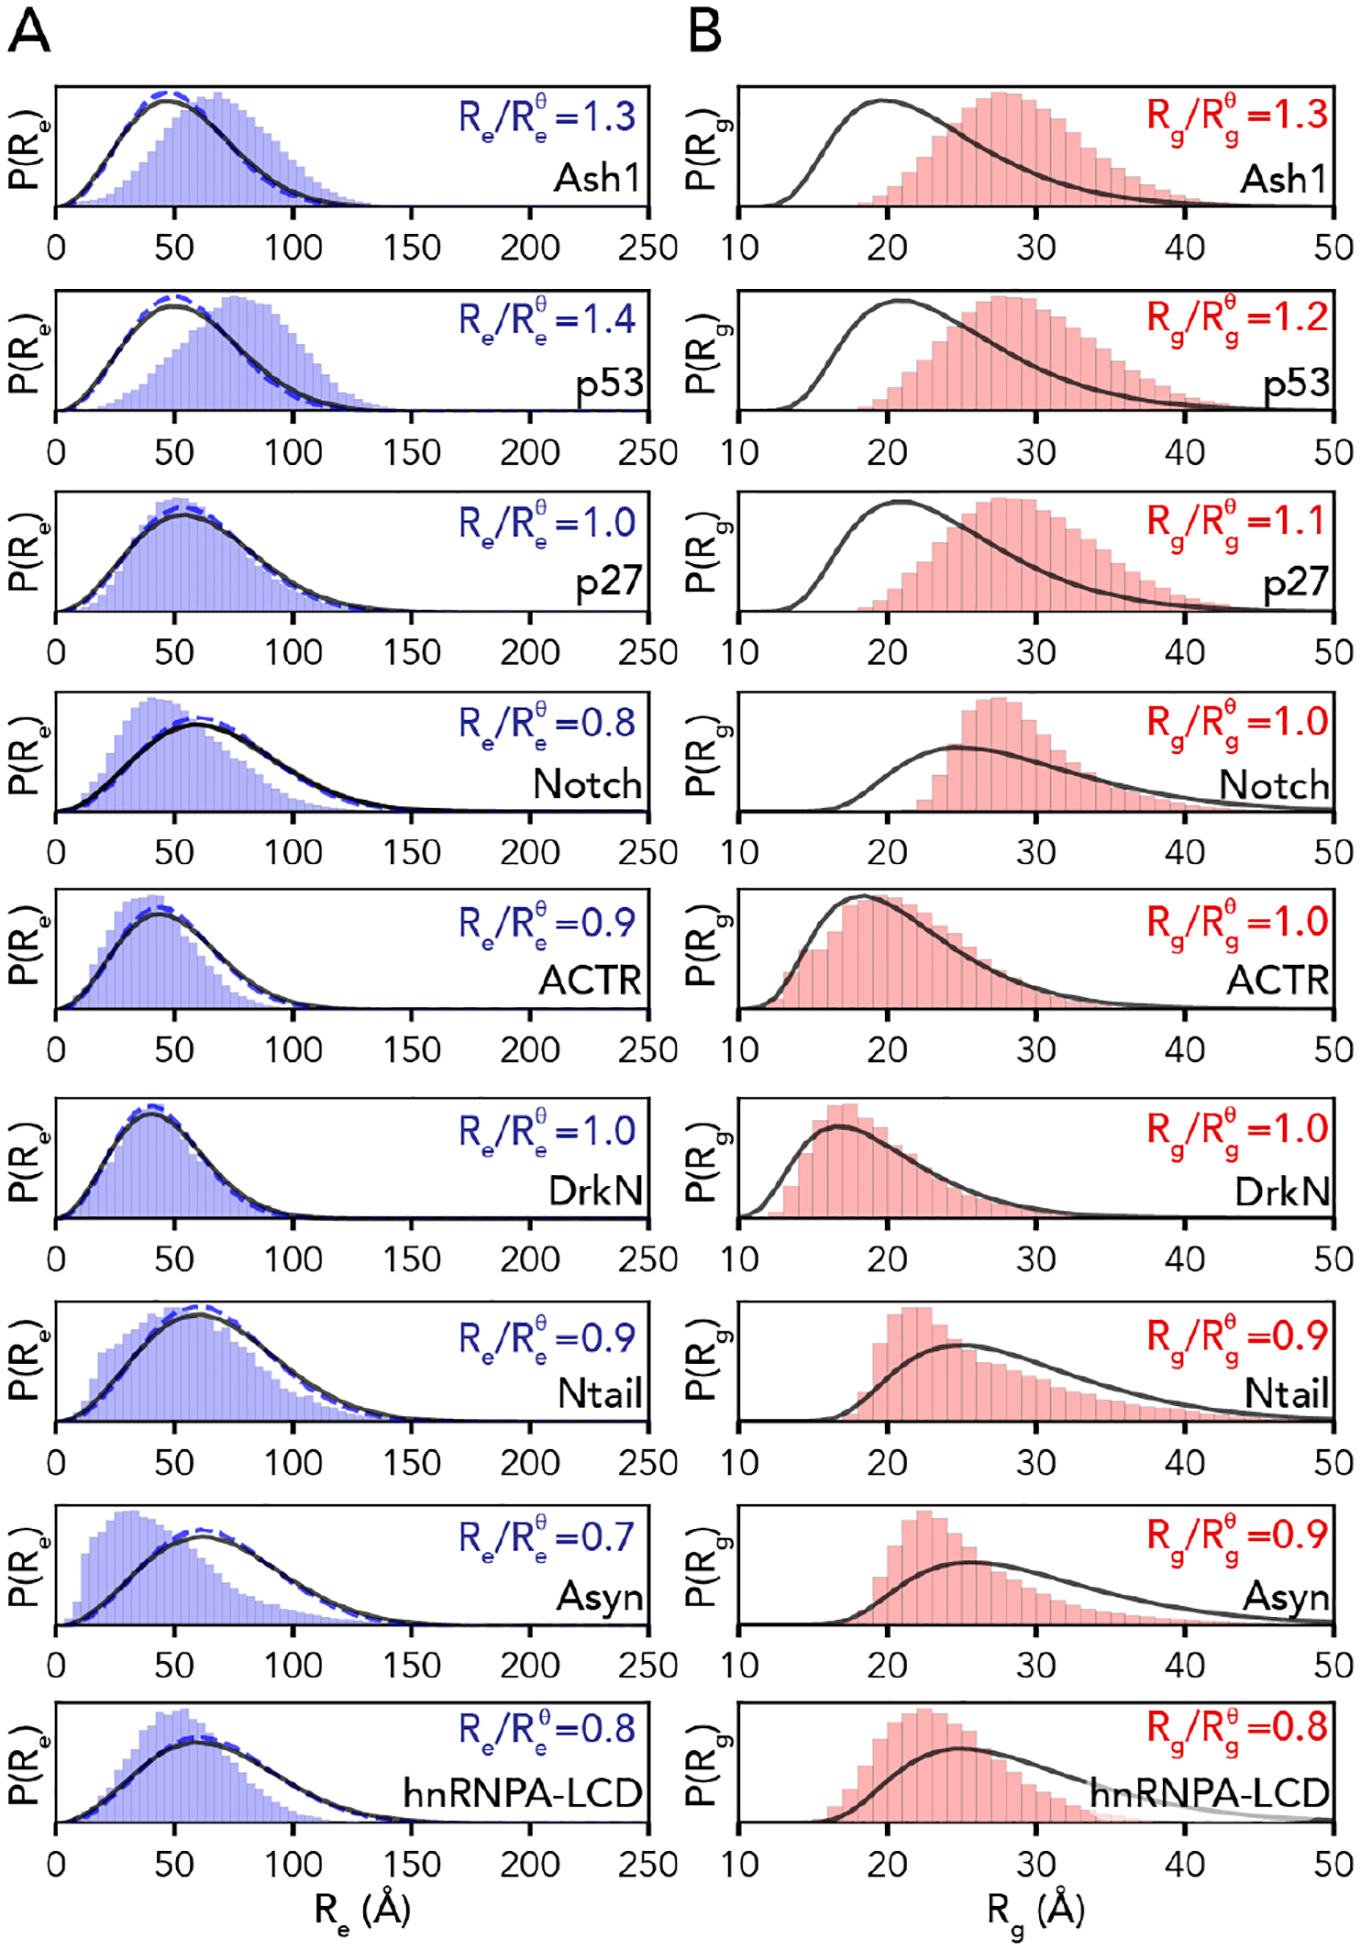
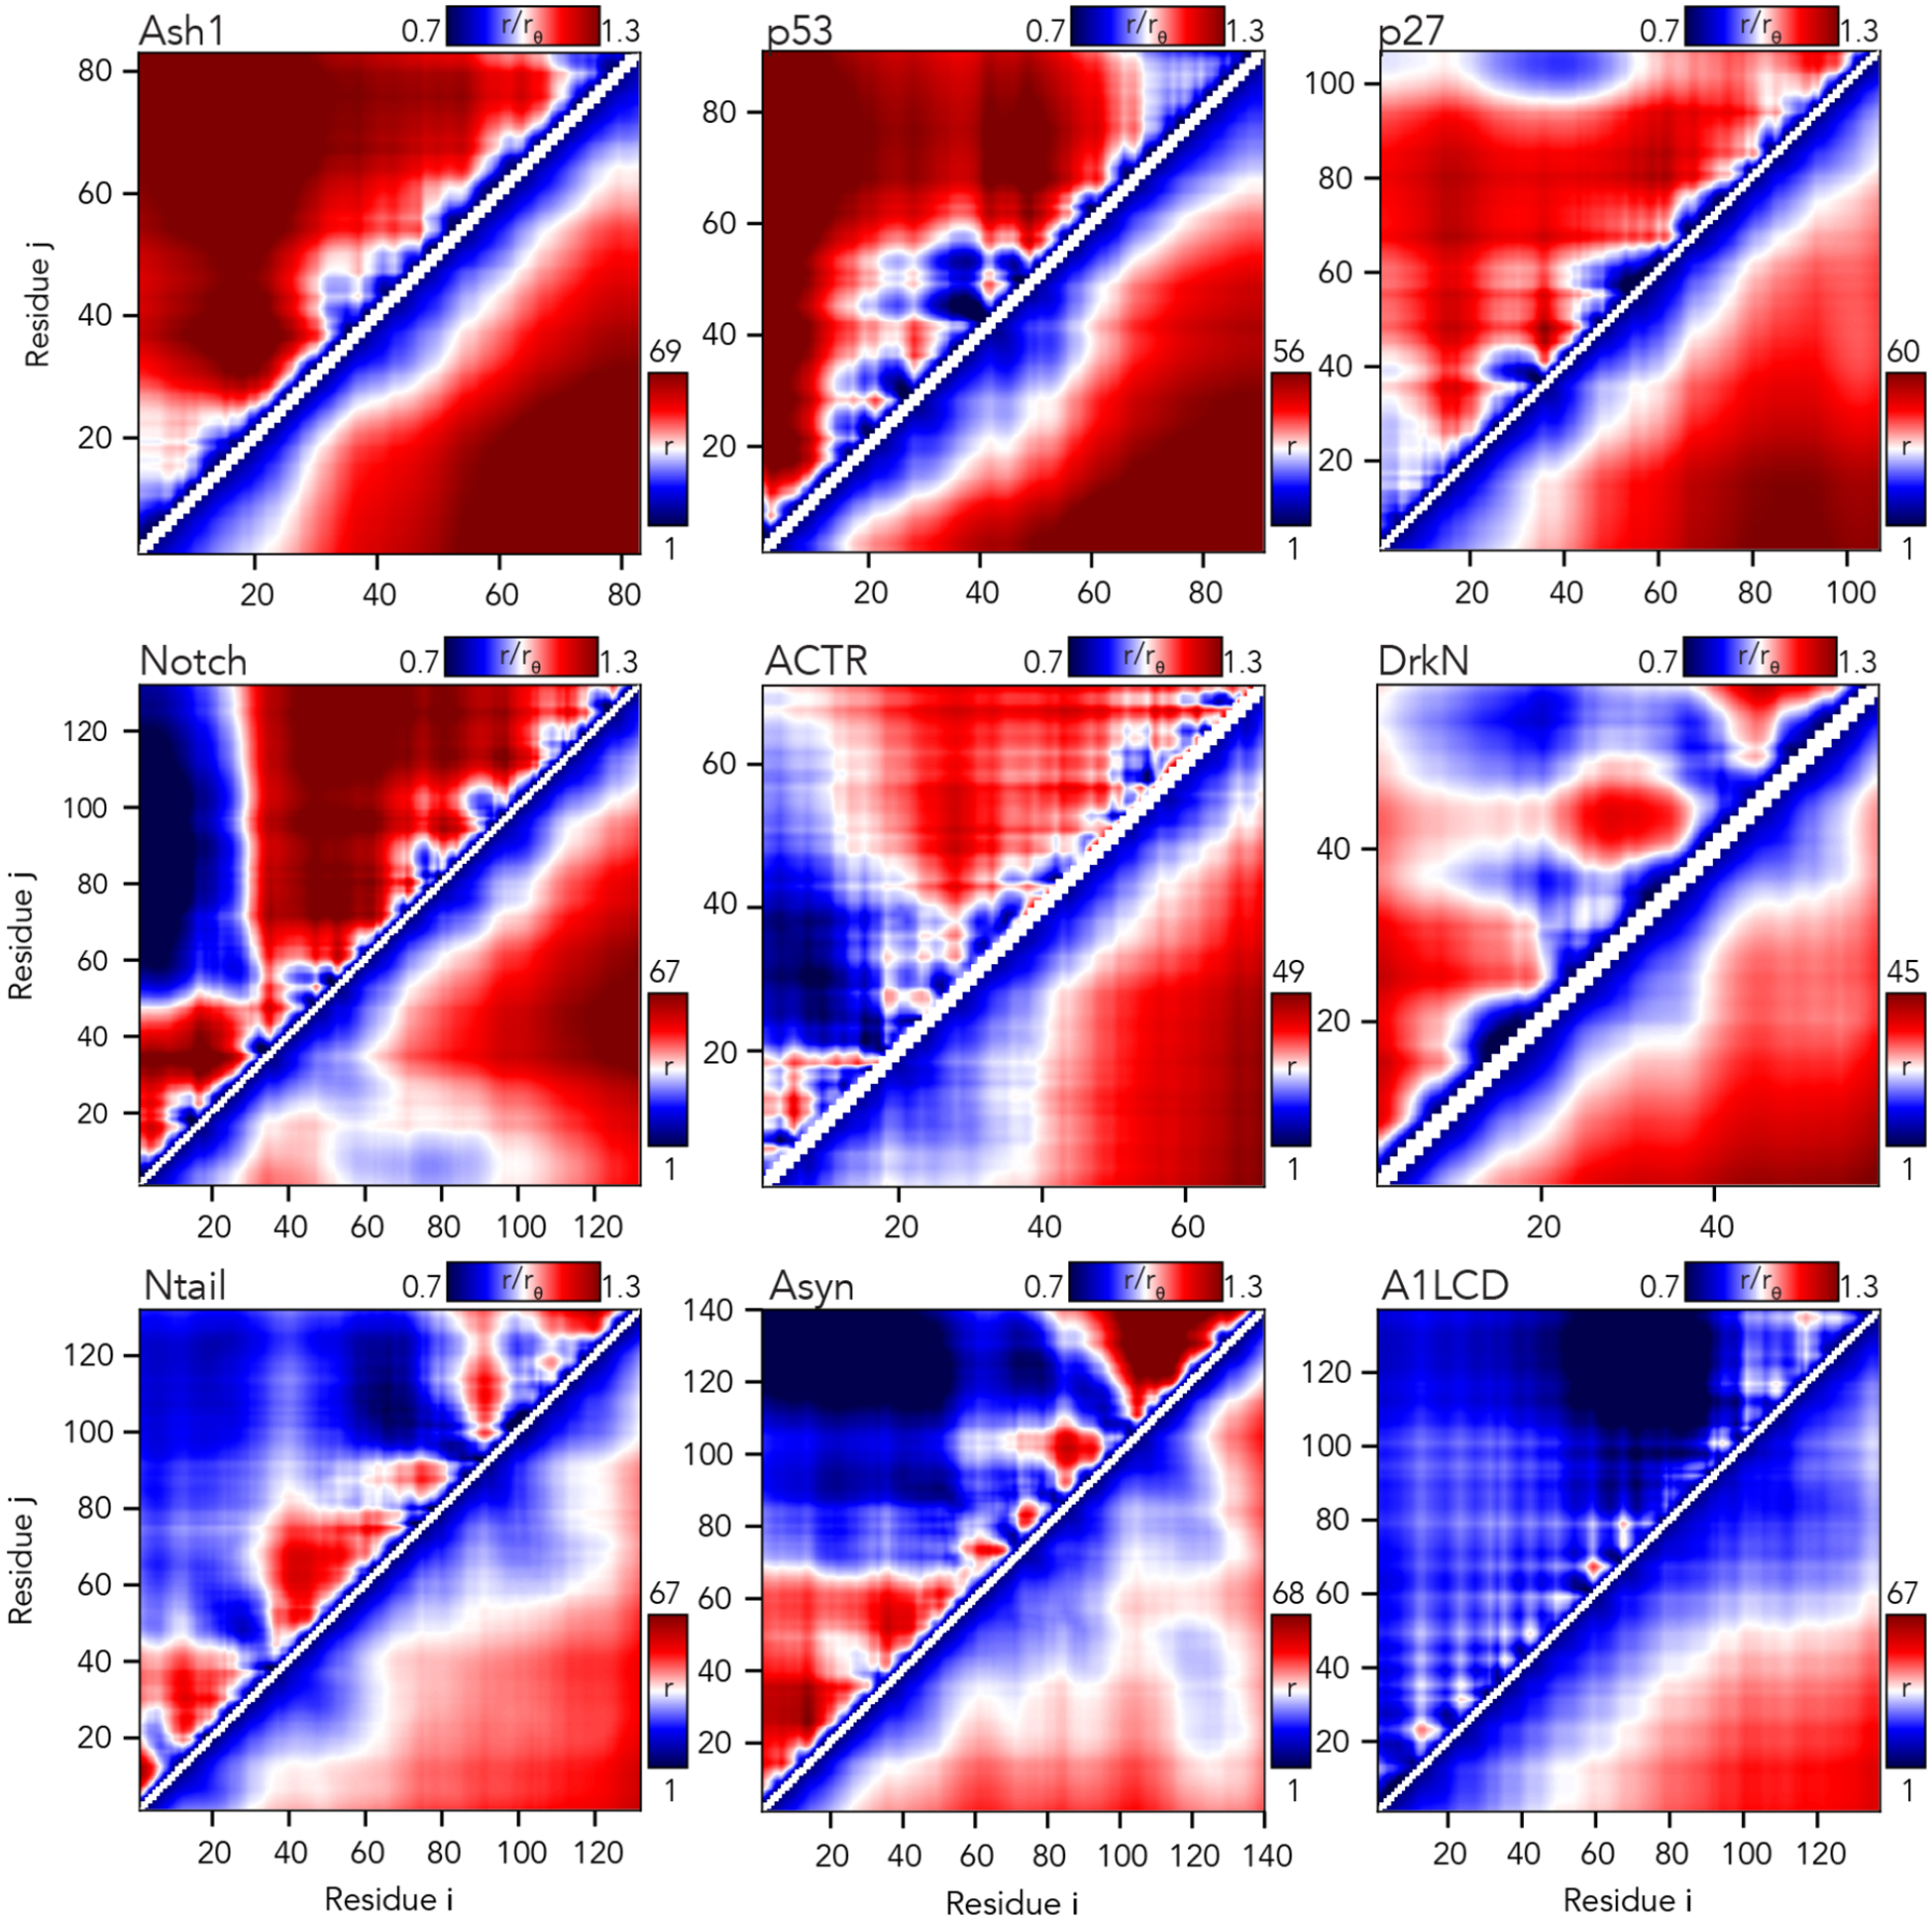
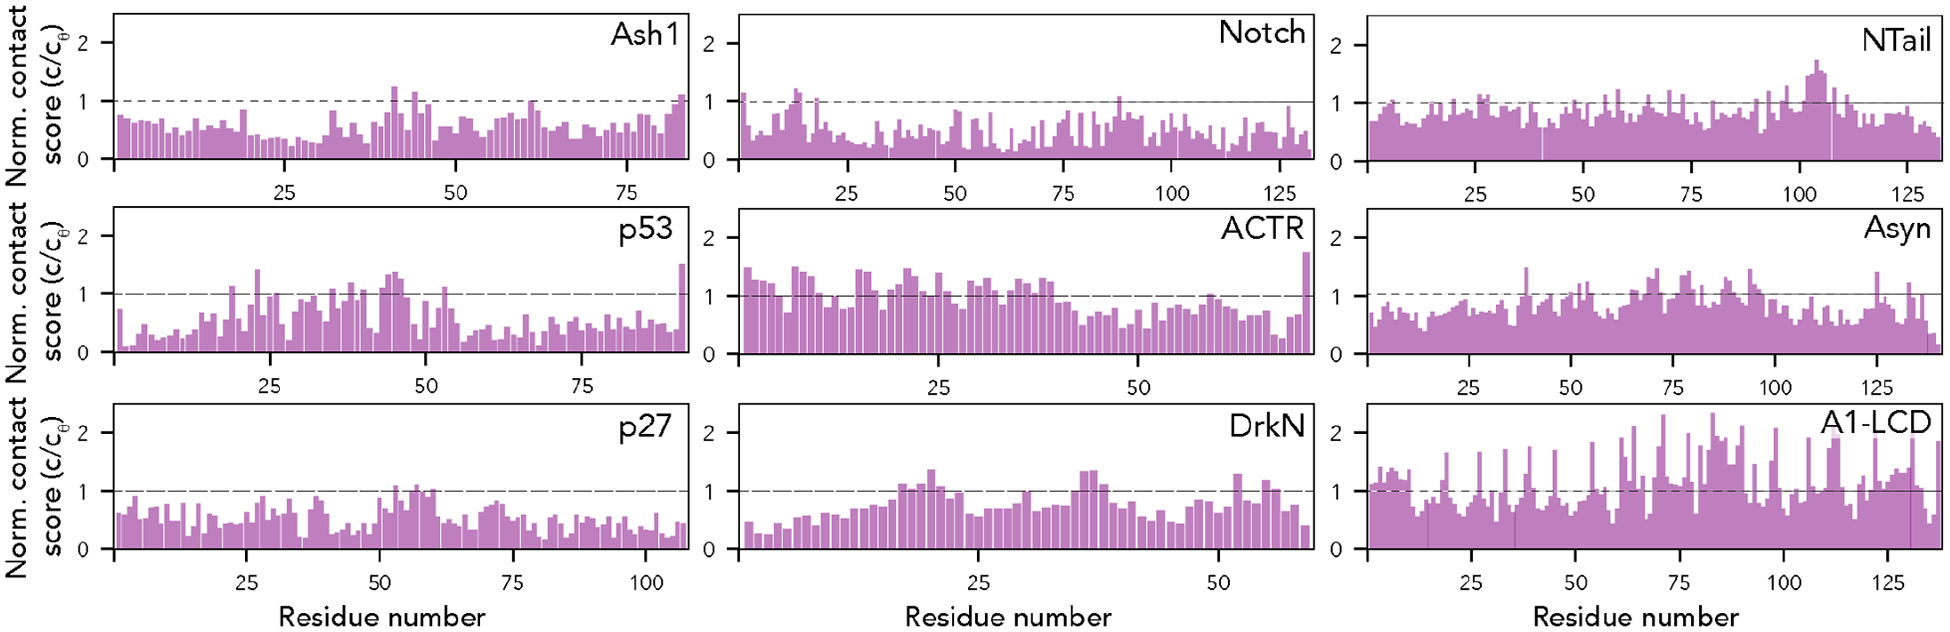
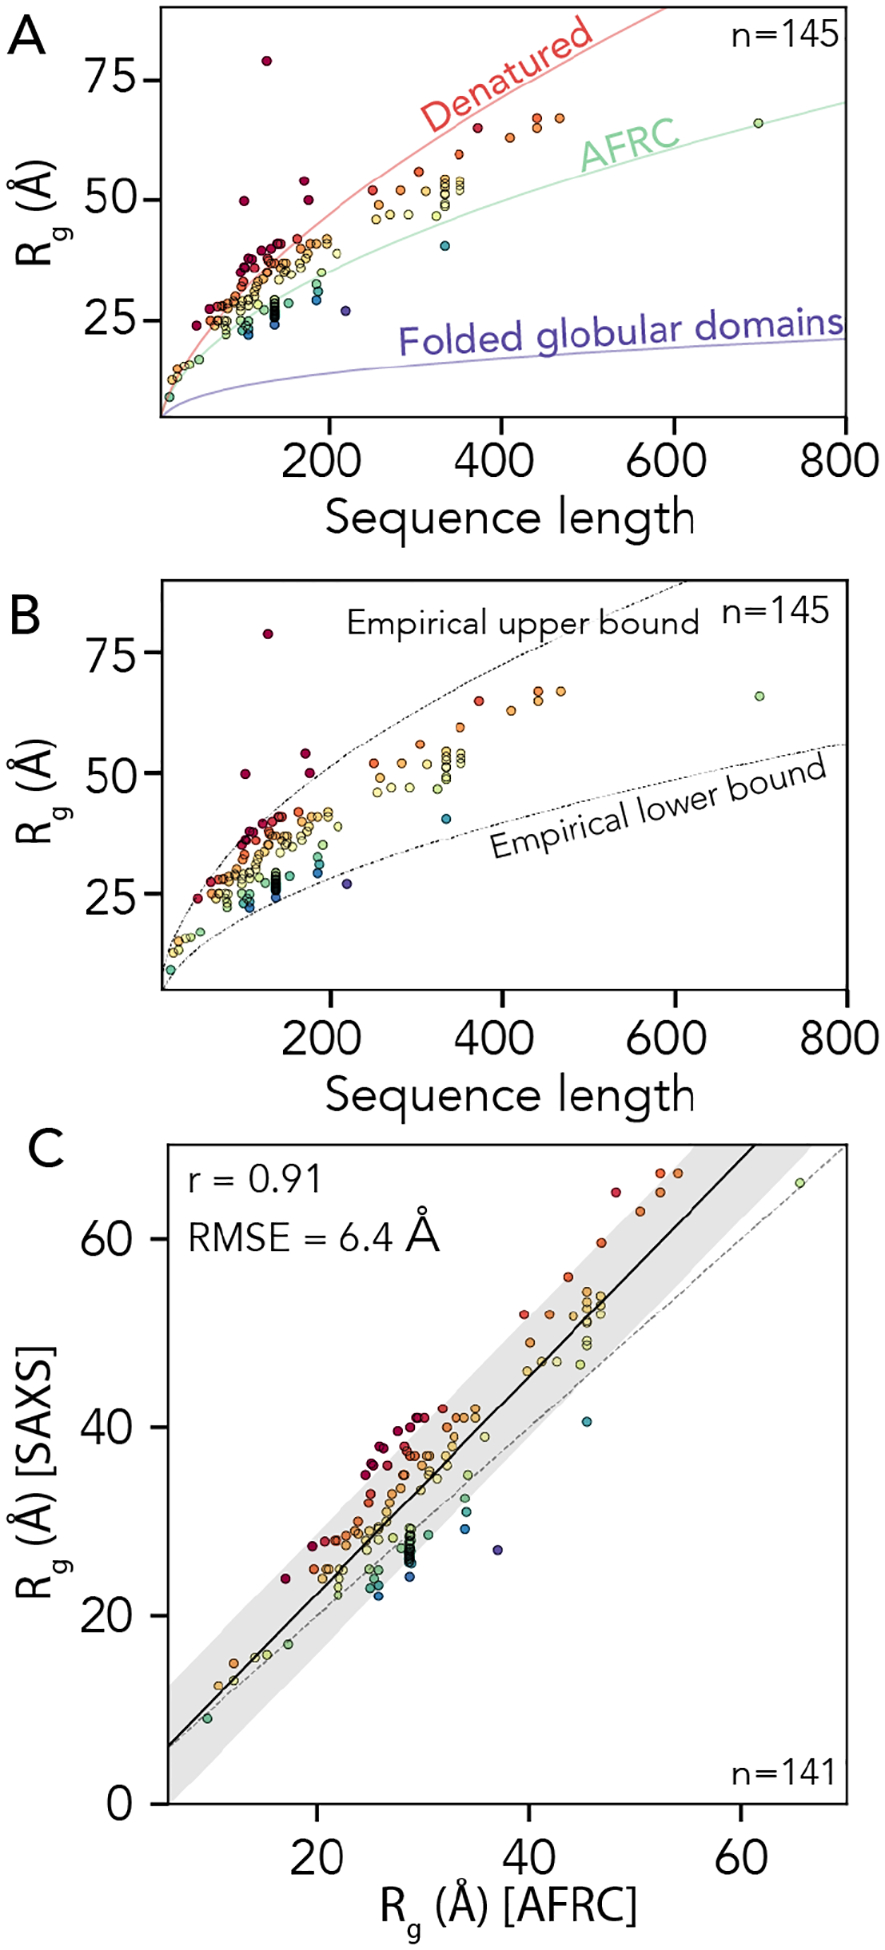
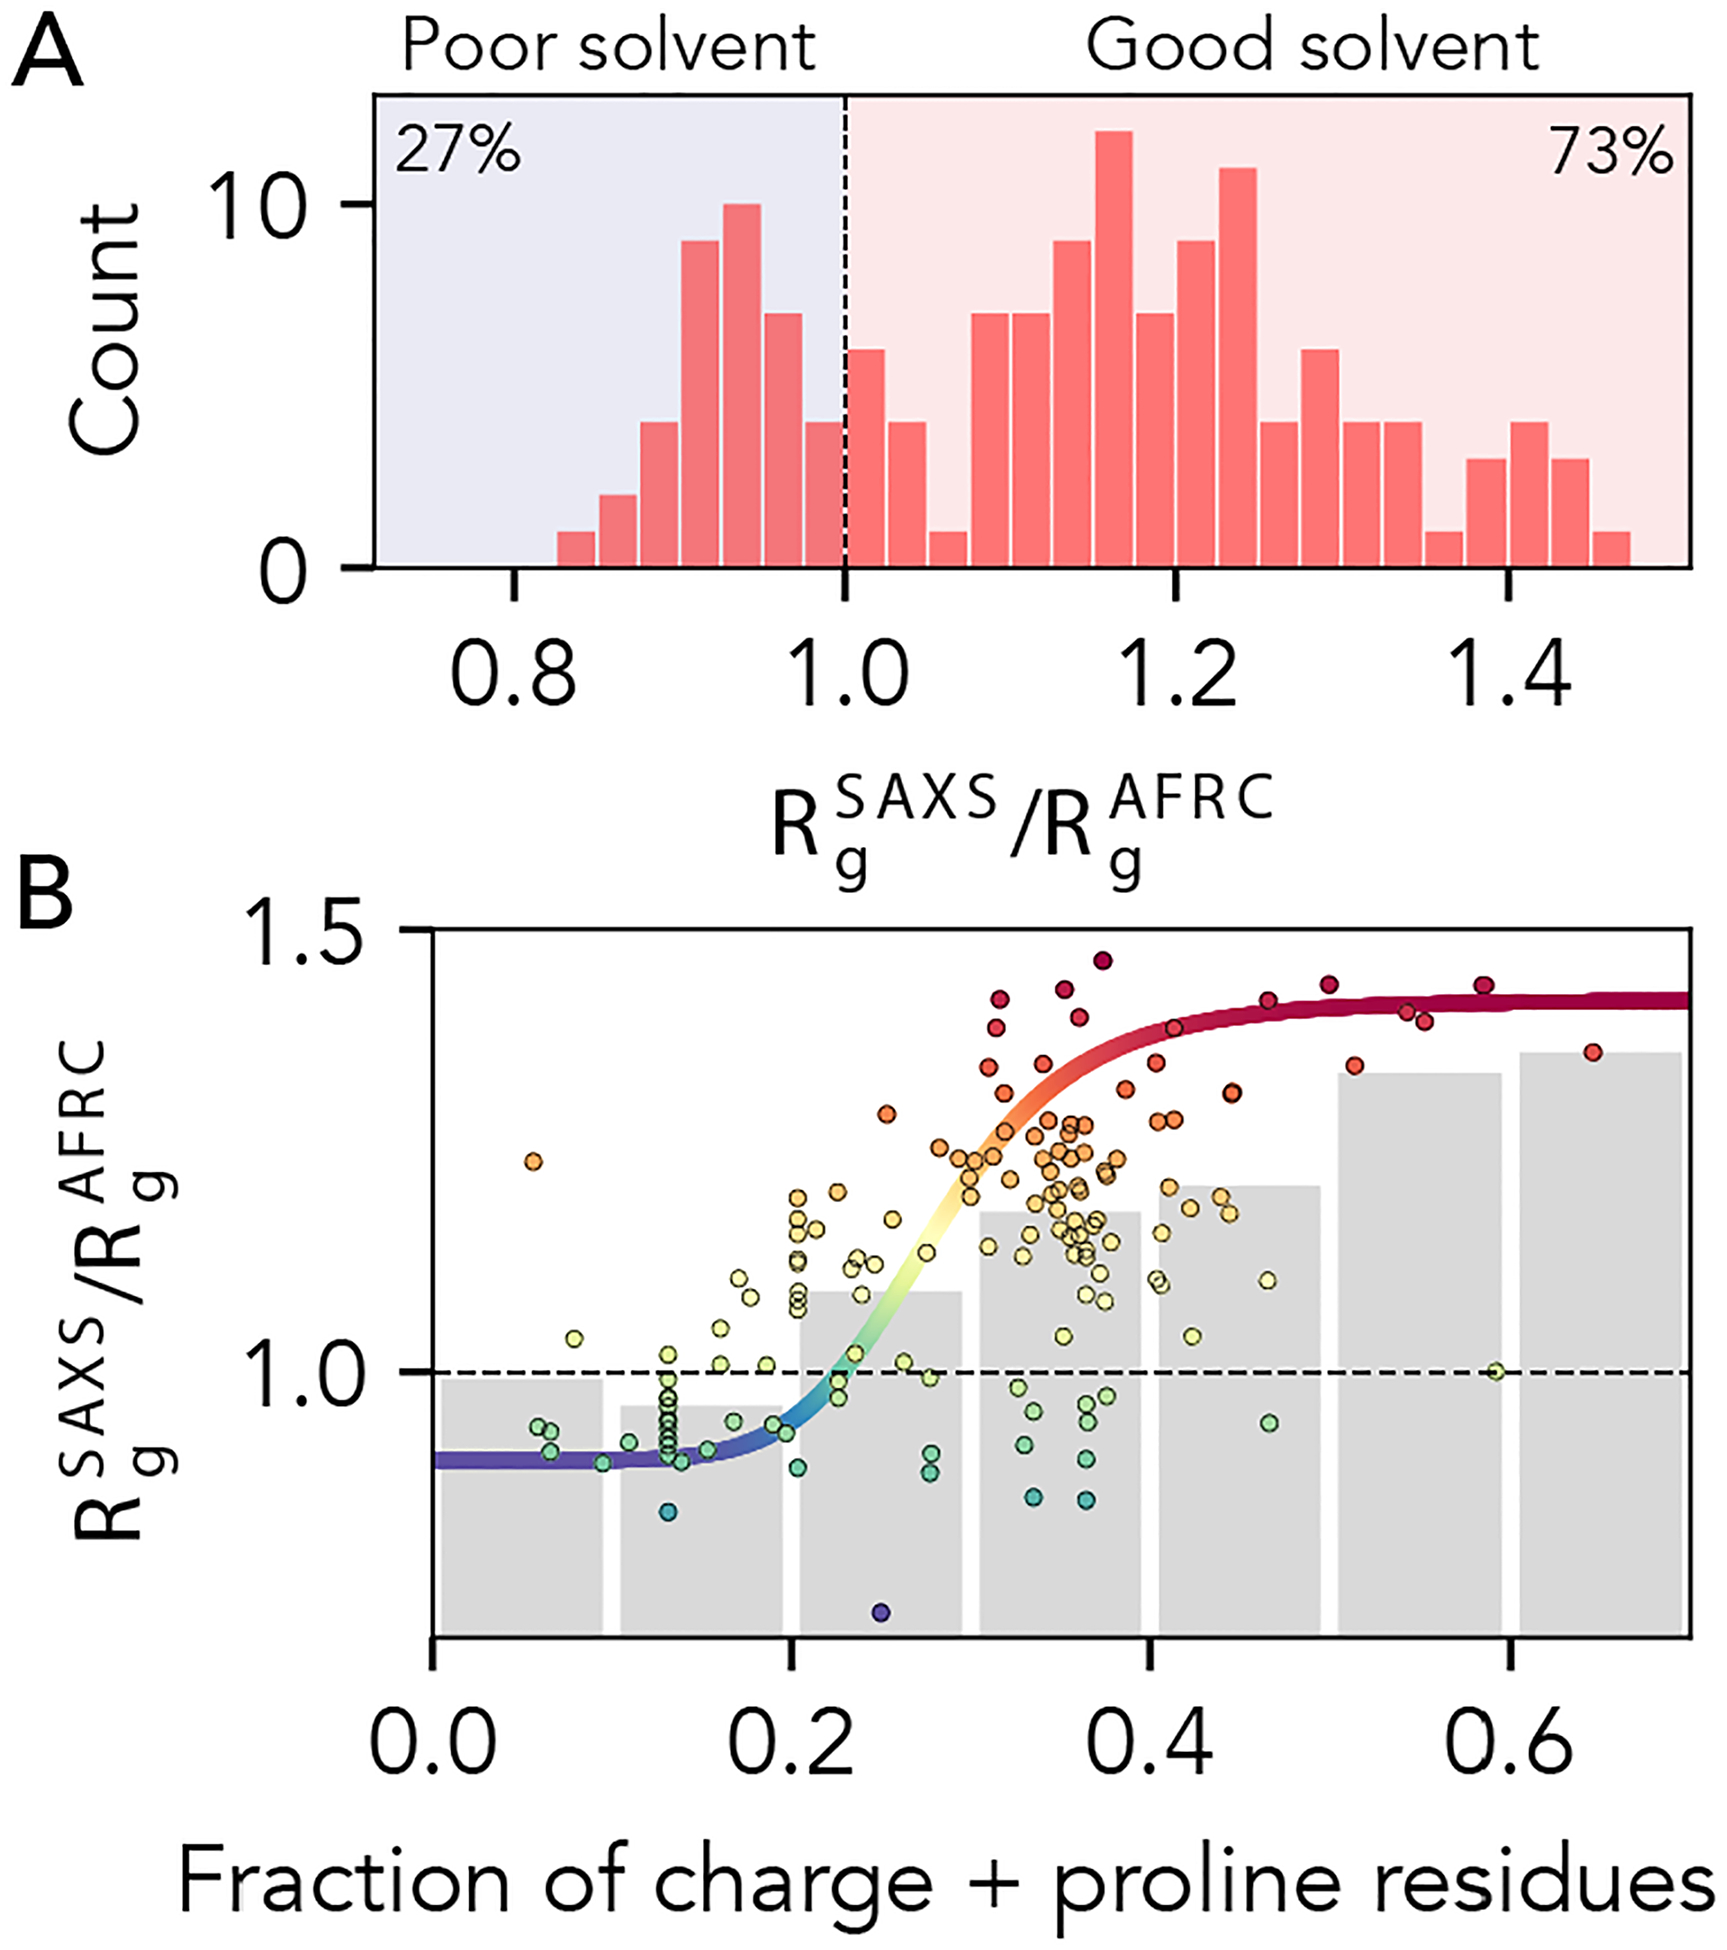
Denatured, unfolded, and intrinsically disordered proteins (collectively referred to here as unfolded proteins) can be described using analytical polymer models. These models capture various polymeric properties and can be fit to simulation results or experimental data. However, the model parameters commonly require users' decisions, making them useful for data interpretation but less clearly applicable as stand-alone reference models. Here we use all-atom simulations of polypeptides in conjunction with polymer scaling theory to parameterize an analytical model of unfolded polypeptides that behave as ideal chains (ν = 0.50). The model, which we call the analytical Flory random coil (AFRC), requires only the amino acid sequence as input and provides direct access to probability distributions of global and local conformational order parameters. The model defines a specific reference state to which experimental and computational results can be compared and normalized. As a proof-of-concept, we use the AFRC to identify sequence-specific intramolecular interactions in simulations of disordered proteins. We also use the AFRC to contextualize a curated set of 145 different radii of gyration obtained from previously published small-angle X-ray scattering experiments of disordered proteins. The AFRC is implemented as a stand-alone software package and is also available via a Google Colab notebook. In summary, the AFRC provides a simple-to-use reference polymer model that can guide intuition and aid in interpreting experimental or simulation results.


Figures

Figure 1:
Figure 1:. The AFRC is a pre-parameterized polymer model based on residue-specific polypeptide behavior.
A. Schematic of the amino acid dihedral angles. B. Ramachandran map for alanine used to select acceptable backbone conformations for the FRC simulations. All twenty amino acids are shown in Fig. S1. C. Graphical rendering of an FRC ensemble for a 100-residue homopolymer. The red chain is a highlighted single conformation, and the shaded other chains shown to highlight the heterogeneous nature of the underlying ensemble. D. Flory Random Coil (FRC) simulations performed using a modified version of the ABSINTH implicit model and CAMPARI simulation engine yield ensembles that scale as ideal chains (i.e., Re and Rg scale with the number of monomers to the power of 0.5). E. Internal scaling profiles for FRC simulations and Excluded Volume (EV) simulations for poly-alanine chains of varying lengths (filled circles demark the end of profiles for different polymer lengths). Internal scaling profiles map the average distance between all pairs of residues |i-j| apart in sequence space, where i and j define two residues. This double average reports on the fact we average over both all pairs of residues that are |i-j| apart and do so over all possible configurations. EV simulations show a characteristic tapering (“dangling end” effect) for large values of |i-j|. All FRC simulation profiles superimpose on top of one another, reflecting the absence of finite chain effects. F. Histograms of end-to-end distances (blue) taken from FRC simulations vs. corresponding probability density profiles generated by the Analytical FRC (AFRC) model (black line) show excellent agreement. G. Histograms of radii of gyration (red) taken from FRC simulations vs. corresponding probability density profiles generated by the AFRC model (black line) also show excellent agreement.
Figure 2.
Figure 2.. The AFRC enables the calculation of intra-residue distance distributions and expected distance-dependent contact fractions.
A. We compared all-possible mean inter-residue distances obtained from FRC simulations with predictions from the AFRC. The maximum deviation across the entire chain is around 2.5 Å, with 92% of all distances having a deviation of less than 1 Å. B. Using the inter-residue distance, we can calculate the average fraction of an ensemble in which two residues are in contact (i.e., within some threshold distance). Here, we assess how that fractional contact varies with the contact threshold (different lines) and distance between the two residues. The AFRC does a somewhat poor job of estimating contact fractions for pairs of residues separated by 1,2 or 3 amino acids due to the discrete nature of the FRC simulations vis the continuous nature of the Gaussian chain distribution. However, the agreement is excellent above a sequence separation of three or more amino acids, suggesting that the AFRC offers a reasonable route to normalize expected contact frequencies.
Fig. 3
Fig. 3. The AFRC generalizes to arbitrary heteropolymeric sequences with the same precision and accuracy as it does for homopolymeric sequences.
A. Representative examples of randomly selected heteropolymers of lengths 100, 250, and 450, comparing the AFRC-derived end-to-end distance distribution (black curve) with the empirically-determined end-to-end distance histogram from FRC simulations (blue bars). B. The same three polymers, as shown in A, now compare the AFRC-derived radius of gyration distance distribution (black curve) with the empirically-determined radius of gyration histogram from FRC simulations (blue bars). C Comparison of AFRC vs. FRC simulation-derived internal scaling profiles for a 150-amino acid random heteropolymer. The deviation between FRC and AFRC for these profiles offers a measure of agreement across all length scales. D Comparison of root-mean-square error (RMSE) obtained from internal scaling profile comparisons (i.e., as shown in C) for 320 different heteropolymers straddling 10 to 500 amino acids in length. In all cases, the agreement with theory and simulations is excellent.
Fig. 4
Fig. 4. The AFRC is complementary to existing polymer models.
(A) Comparison of end-to-end distance distributions for several other analytical models, including the Wormlike Chain (WLC), the self-avoiding walk (SAW), and the ν-dependent SAW model (SAW-ν). The AFRC behaves like a ν-dependent SAW with a scaling exponent of 0.5. (B) Comparisons of ensemble-average radii of gyration as a function of chain length for the same sets of polymer models. The AFRC behaves as expected and again is consistent with a ν-dependent SAW with a scaling exponent of 0.5.
Fig. 5
Fig. 5. AFRC-derived distance distributions enable simulations to be qualitatively compared against a null model.
A. Comparison of the end-to-end distance distributions from the AFRC (black line) and SAW-ν (blue dashed line, with ν=0.5 and prefactor = 5.5) with the simulation-derived end-to-end distribution (blue bars) for all-atom simulations of nine different disordered proteins. B. Comparison of the AFRC-derived radius of gyration distributions (black line) with the simulation-derived radius of gyration distribution (red bars) for all-atom simulations of nine different disordered proteins.
Fig. 6
Fig. 6. The AFRC enables a consistent normalization of intra-chain distances to identify specific sub-regions that are closer or further apart than expected.
Inter-residue scaling maps (top left) and distance maps (bottom right) reveal the nuance of intramolecular interactions. Scaling maps (top left) report the average distance between each pair of residues (i,j) divided by the distance expected for an AFRC-derived distance map, providing a unitless parameter that varies between 0.7 and 1.3 in these simulations. Distance maps (bottom right) report the absolute distance between each pair of residues in angstroms. While distance maps provide a measure of absolute distance in real space, scaling maps provide a cleaner, normalized route to identify deviations from expected polymer behavior, offering a convenient means to identify sequence-specific effects. For example, in Notch and alpha-synuclein, scaling maps clearly identify end-to-end distances as close than expected. Scaling maps also offer a much sharper resolution for residue-specific effects - for example, in p53, residues embedded in the hydrophobic transactivation domains are clearly identified as engaging in transient intramolecular interactions, leading to sharp deviations from expected AFRC distances.
Fig. 7
Fig. 7. The AFRC enables an expected contract fraction to be calculated, such that normalized contact frequencies can be easily calculated for simulations.
Across the nine different simulated disordered proteins, we computed the contact fraction (i.e., the fraction of simulations each residue is in contact with any other residue) and divided this value by the expected contact fraction from the AFRC model. This analysis revealed subregions within IDRs that contribute extensively to intramolecular interactions, mirroring finer-grain conclusions obtained in Fig. 6.
Fig 8.
Fig 8.. Comparison of AFRC-derived radii of gyration with experimentally-measured values.
A. We compared 145 experimentally-measured radii of gyration against three empirical polymer scaling models that capture the three classes of polymer scaling (ν = 0.33 [globular domains], ν = 0.5 [AFRC], and ν = 0.59 [denatured state]). Individual points are colored by their normalized radius of gyration (SAXS-derived radius of gyration divided by AFRC-derived radius of gyration). B. The same data as in panel A with the empirically defined upper and lower bound. As with panel A, individual points are colored by their normalized radius of gyration. C. Comparison of SAXS-derived radii of gyration and AFRC-derived radii of gyration, as with panels A and B, individual points are colored by their normalized radius of gyration.
Fig 9.
Fig 9.. AFRC-normalized radii of gyration from experimentally-measured proteins.
A. Histogram showing the normalized radii of gyration for 141 different experimentally-measured sequences. B. Comparison of normalized radii of gyration for 141 different experimentally-measured sequences against the fraction of charge and proline residues in those sequences. Individual points are colored by their normalized radius of gyration. Grey bars reflect the average radius of gyrations obtained by binning sequences with the corresponding fraction of charge and proline residues. The colored sigmoidal curve is included to guide the eye across the transition region, suggesting that – on average – the midpoint of this transition is at a fraction of charged and proline residues of ~0.25. The Pearson correlation coefficient (r) for the fraction of charged and proline residues vs. normalized radius of gyration is 0.58).

Update of

Similar articles

Cited by

References

    1. Dill KA; Shortle D Denatured States of Proteins. Annu. Rev. Biochem 1991, 60, 795–825. - PubMed
    1. Mao AH; Lyle N; Pappu RV Describing Sequence–ensemble Relationships for Intrinsically Disordered Proteins. Biochem. J 2013, 449 (2), 307–318. - PMC - PubMed
    1. Chan HS; Dill KA Polymer Principles in Protein Structure and Stability. Annu. Rev. Biophys. Biophys. Chem 1991, 20, 447–490. - PubMed
    1. Pappu RV; Wang X; Vitalis A; Crick SL A Polymer Physics Perspective on Driving Forces and Mechanisms for Protein Aggregation - Highlight Issue: Protein Folding. Arch. Biochem. Biophys 2008, 469 (1), 132–141. - PMC - PubMed
    1. Schuler B; Soranno A; Hofmann H; Nettels D Single-Molecule FRET Spectroscopy and the Polymer Physics of Unfolded and Intrinsically Disordered Proteins. Annu. Rev. Biophys 2016, 45, 207–231. - PubMed

Publication types