Increasing Pump-Probe Signal toward Asymptotic Limits
- PMID: 37200488
- PMCID: PMC10240498
- DOI: 10.1021/acs.jpcb.3c01270
Increasing Pump-Probe Signal toward Asymptotic Limits
Abstract
Optimization of pump-probe signal requires a complete understanding of how signal scales with experimental factors. In simple systems, signal scales quadratically with molar absorptivity, and linearly with fluence, concentration, and path length. In practice, scaling factors weaken beyond certain thresholds (e.g., OD > 0.1) due to asymptotic limits related to optical density, fluence and path length. While computational models can accurately account for subdued scaling, quantitative explanations often appear quite technical in the literature. This Perspective aims to present a simpler understanding of the subject with concise formulas for estimating absolute magnitudes of signal under both ordinary and asymptotic scaling conditions. This formulation may be more appealing for spectroscopists seeking rough estimates of signal or relative comparisons. We identify scaling dependencies of signal with respect to experimental parameters and discuss applications for improving signal under broad conditions. We also review other signal enhancement methods, such as local-oscillator attenuation and plasmonic enhancement, and discuss respective benefits and challenges regarding asymptotic limits that signal cannot exceed.
Conflict of interest statement
The authors declare no competing financial interest.
Figures

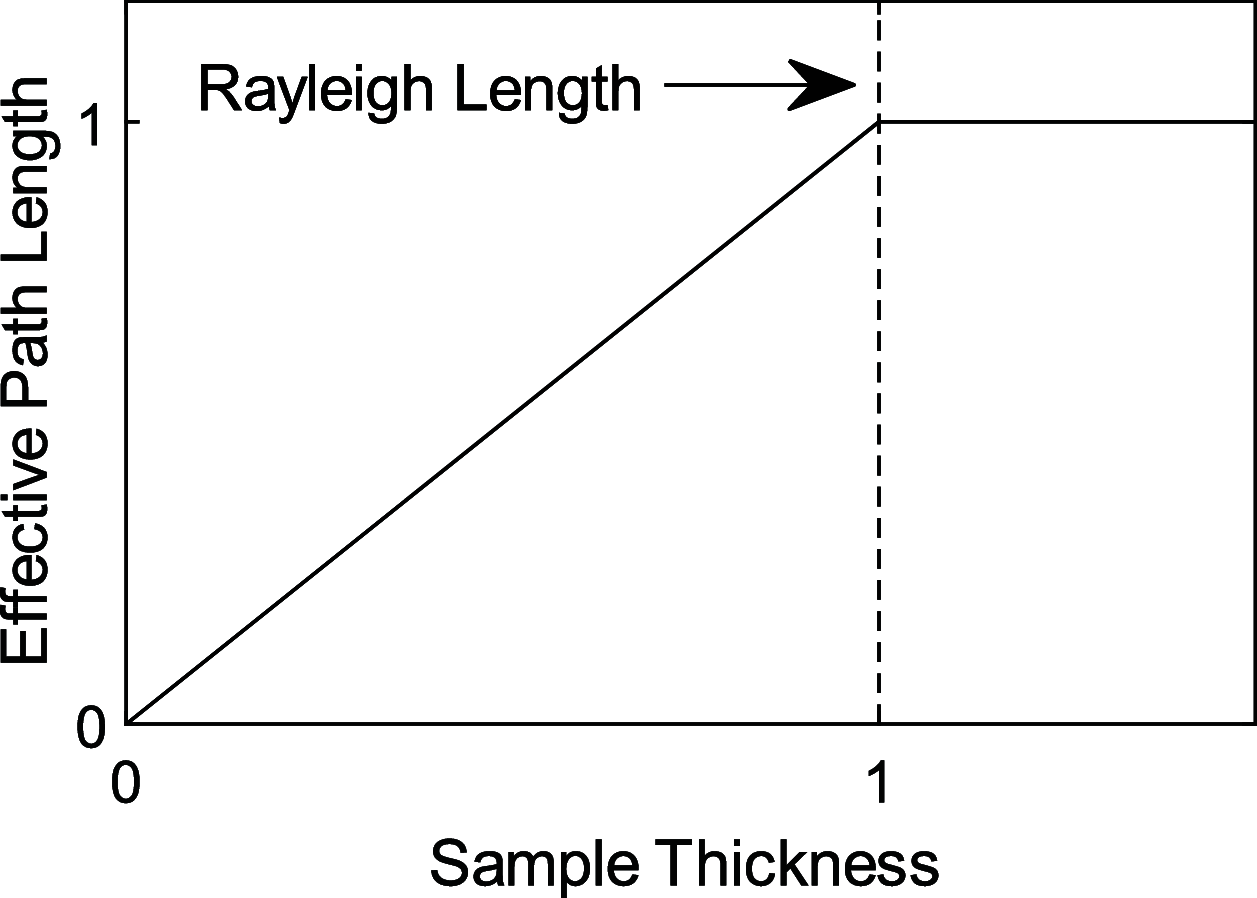
 , beam waist
  , Rayleigh length
  , and aperture diameter
  .
.


Similar articles
-
Assessment and statistical modeling of the relationship between remotely sensed aerosol optical depth and PM2.5 in the eastern United States.Res Rep Health Eff Inst. 2012 May;(167):5-83; discussion 85-91. Res Rep Health Eff Inst. 2012. PMID: 22838153
-
Molar Absorptivity Measurements in Absorbing Solvents: Impact on Solvent Absorptivity Values.Appl Spectrosc. 2017 Mar;71(3):446-455. doi: 10.1177/0003702816662883. Epub 2016 Nov 13. Appl Spectrosc. 2017. PMID: 27756864
-
Ultrafast low-pump fluence all-optical modulation based on graphene-metal hybrid metasurfaces.Light Sci Appl. 2022 Apr 20;11(1):102. doi: 10.1038/s41377-022-00787-8. Light Sci Appl. 2022. PMID: 35443739 Free PMC article.
-
Italian Society of Cardiovascular Echography (SIEC) Consensus Conference on the state of the art of contrast echocardiography.Ital Heart J. 2004 Apr;5(4):309-34. Ital Heart J. 2004. PMID: 15185894 Review.
-
Opportunistic Rain Rate Estimation from Measurements of Satellite Downlink Attenuation: A Survey.Sensors (Basel). 2021 Aug 31;21(17):5872. doi: 10.3390/s21175872. Sensors (Basel). 2021. PMID: 34502767 Free PMC article. Review.
Cited by
-
Biomolecular infrared spectroscopy: making time for dynamics.Chem Sci. 2023 Nov 28;15(2):414-430. doi: 10.1039/d3sc05223k. eCollection 2024 Jan 3. Chem Sci. 2023. PMID: 38179520 Free PMC article. Review.
References
-
- Ruban A. V.; Berera R.; Ilioaia C.; van Stokkum I. H. M.; Kennis J. T. M.; Pascal A. A.; van Amerongen H.; Robert B.; Horton P.; van Grondelle R. Identification of a mechanism of photoprotective energy dissipation in higher plants. Nature 2007, 450 (7169), 575–U22. 10.1038/nature06262. - DOI - PubMed
Publication types
LinkOut - more resources
Full Text Sources

