

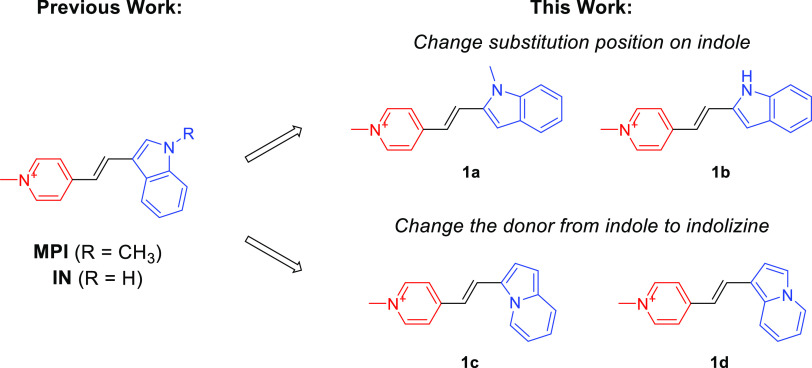
Development of Highly Fluorogenic Styrene Probes for Visualizing RNA in Live Cells
- PMID: 37200527
- PMCID: PMC10367048
- DOI: 10.1021/acschembio.3c00141
Development of Highly Fluorogenic Styrene Probes for Visualizing RNA in Live Cells
Abstract
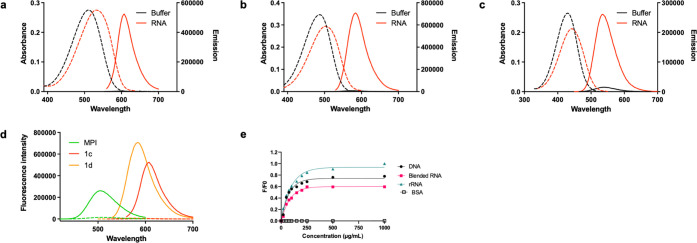
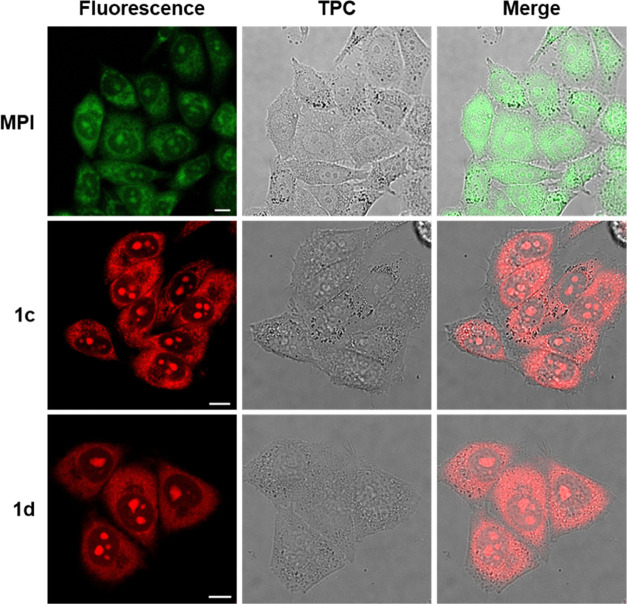
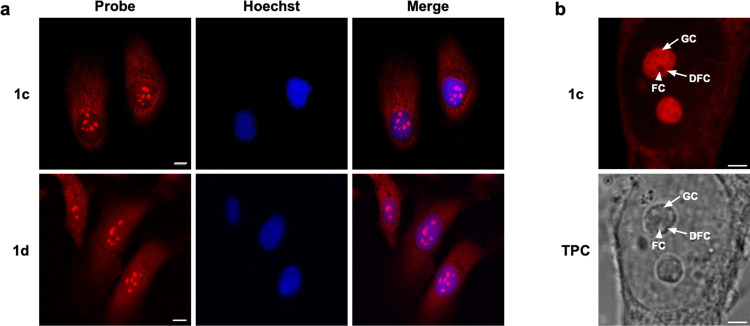
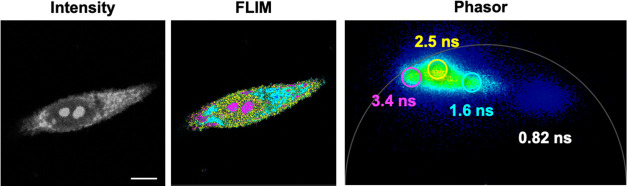
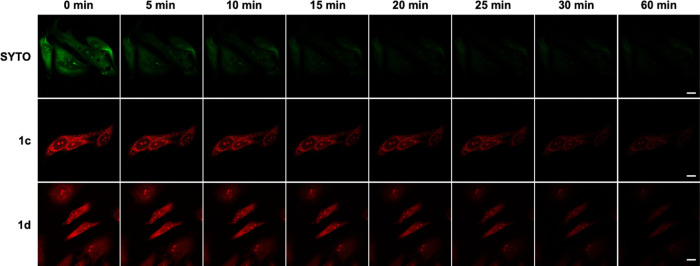
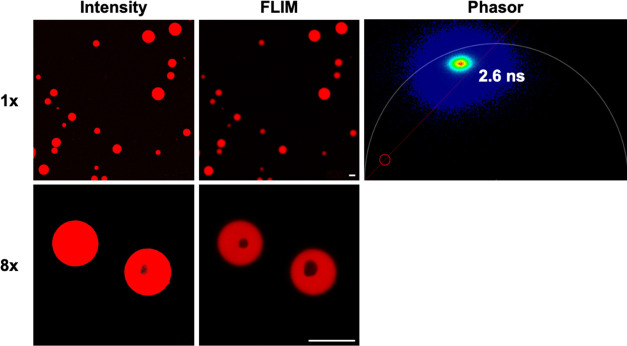
Styrene dyes are useful imaging probes and fluorescent sensors due to their strong fluorogenic responses to environmental changes or binding macromolecules. Previously, indole-containing styrene dyes have been reported to selectively bind RNA in the nucleolus and cytoplasm. However, the application of these indole-based dyes in cell imaging is limited by their moderate fluorescence enhancement and quantum yields, as well as relatively high background associated with these green-emitting dyes. In this work, we have investigated the positional and electronic effects of the electron donor by generating regioisomeric and isosteric analogues of the indole ring. Select probes exhibited large Stokes shifts, enhanced molar extinction coefficients, and bathochromic shifts in their absorption and fluorescence wavelengths. In particular, the indolizine analogues displayed high membrane permeability, strong fluorogenic responses upon binding RNA, compatibility with fluorescence lifetime imaging microscopy (FLIM), low cytotoxicity, and excellent photostability. These indolizine dyes not only give rise to rapid, sensitive, and intense staining of nucleoli in live cells but can also resolve subnucleolar structures enabling highly detailed studies of nucleolar morphology. Furthermore, our dyes can partition into RNA coacervates and resolve the formation of multiphase complex coacervate droplets. These indolizine-containing styrene probes offer the highest fluorescence enhancement among the RNA-selective dyes reported in the literature; thus, these new dyes are excellent alternatives to the commercially available RNA dye, SYTO RNASelect, for visualizing RNA in live cells and in vitro.
Conflict of interest statement
The authors declare the following competing financial interest(s): C. Z. is a stockholder and consultant to BridGene Biosciences.
Figures

References
Publication types
MeSH terms
Substances
Grants and funding
LinkOut - more resources
Full Text Sources
