. 2023 May 16;9(3):e200076.
doi: 10.1212/NXG.0000000000200076. eCollection 2023 Jun.

Complex 4q35 and 10q26 Rearrangements: A Challenge for Molecular Diagnosis of Patients With Facioscapulohumeral Dystrophy

Affiliations

Complex 4q35 and 10q26 Rearrangements: A Challenge for Molecular Diagnosis of Patients With Facioscapulohumeral Dystrophy

Megane Delourme et al. Neurol Genet. .

Abstract

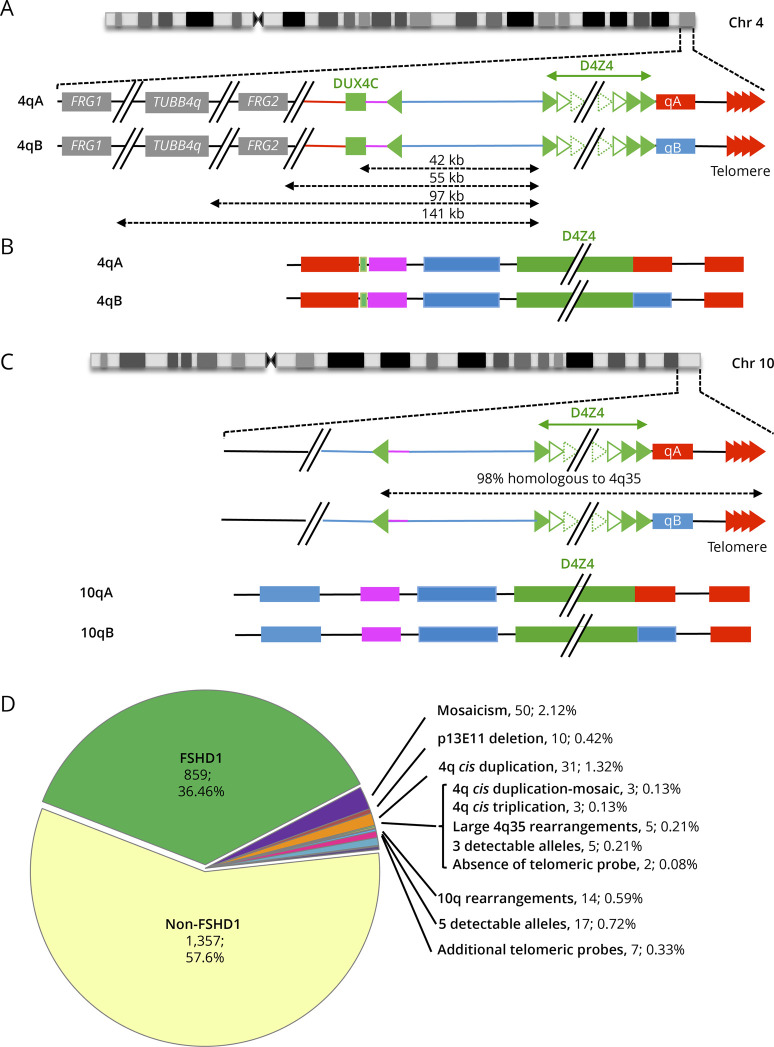
Background and objectives: After clinical evaluation, the molecular diagnosis of type 1 facioscapulohumeral dystrophy (FSHD1) relies in most laboratories on the detection of a shortened D4Z4 array at the 4q35 locus by Southern blotting. In many instances, this molecular diagnosis remains inconclusive and requires additional experiments to determine the number of D4Z4 units or identify somatic mosaicism, 4q-10q translocations, and proximal p13E-11 deletions. These limitations highlight the need for alternative methodologies, illustrated by the recent emergence of novel technologies such as molecular combing (MC), single molecule optical mapping (SMOM), or Oxford Nanopore-based long-read sequencing providing a more comprehensive analysis of 4q and 10q loci. Over the last decade, MC revealed a further increasing complexity in the organization of the 4q and 10q distal regions in patients with FSHD with cis-duplication of D4Z4 arrays in approximately 1%-2% of cases.

Methods: By using MC, we investigated in our center 2,363 cases for molecular diagnosis of FSHD. We also evaluated whether previously reported cis-duplications might be identified by SMOM using the Bionano EnFocus FSHD 1.0 algorithm.

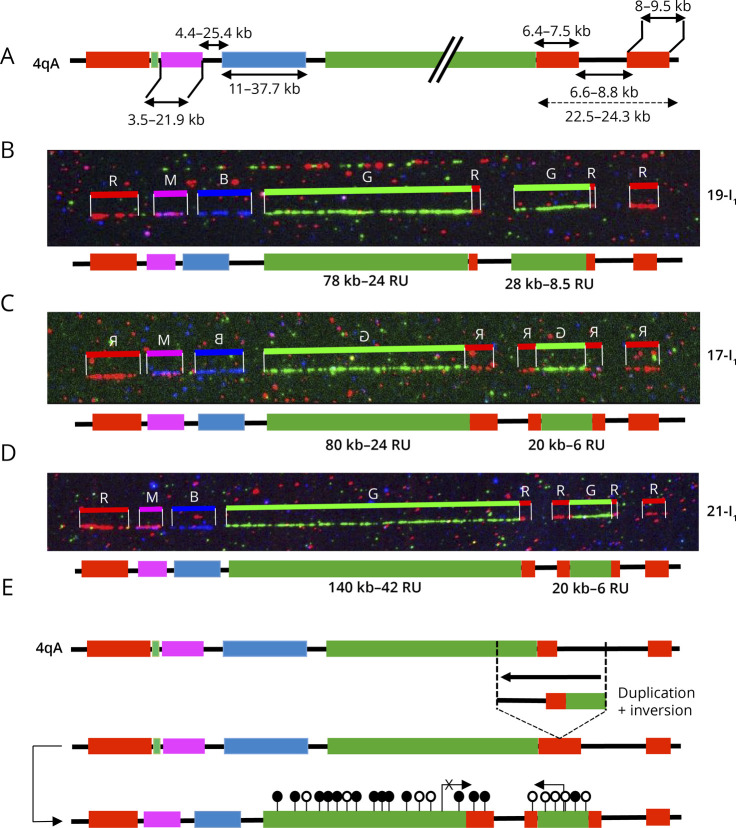
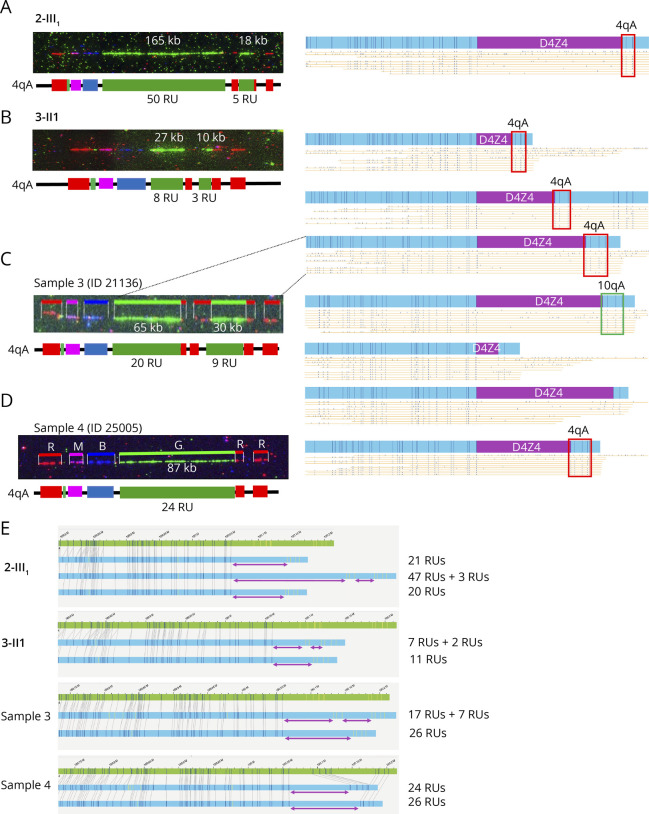
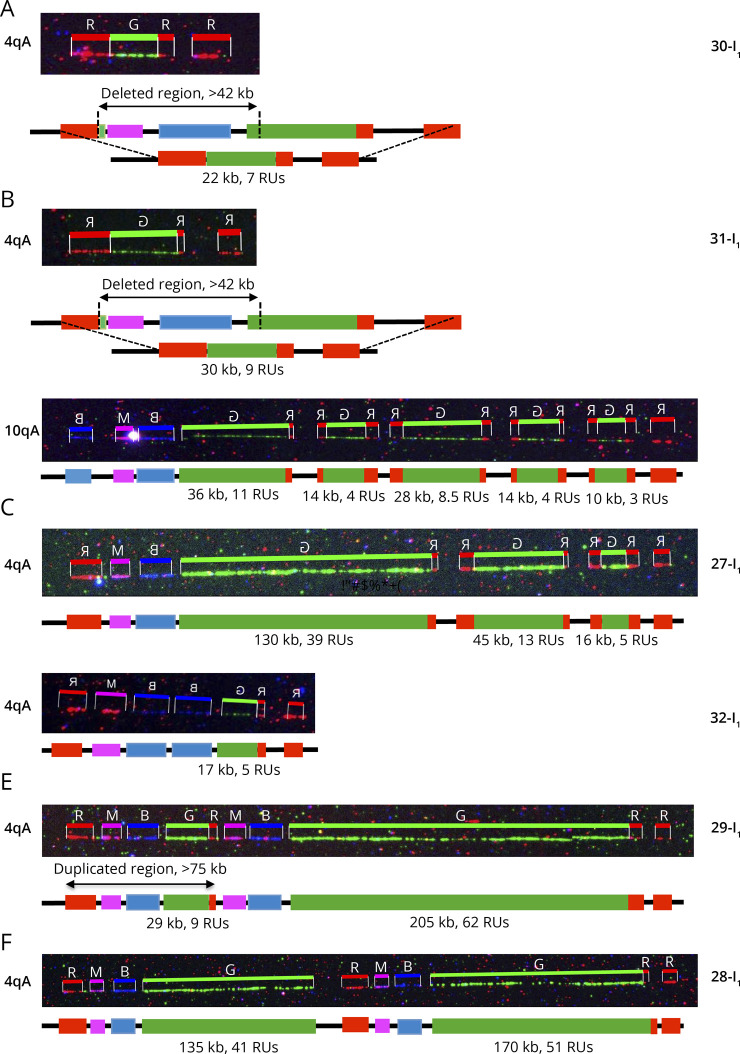
Results: In our cohort of 2,363 samples, we identified 147 individuals carrying an atypical organization of the 4q35 or 10q26 loci. Mosaicism is the most frequent category followed by cis-duplications of the D4Z4 array. We report here chromosomal abnormalities of the 4q35 or 10q26 loci in 54 patients clinically described as FSHD, which are not present in the healthy population. In one-third of the 54 patients, these rearrangements are the only genetic defect suggesting that they might be causative of the disease. By analyzing DNA samples from 3 patients carrying a complex rearrangement of the 4q35 region, we further showed that the SMOM direct assembly of the 4q and 10q alleles failed to reveal these abnormalities and lead to negative results for FSHD molecular diagnosis.

Discussion: This work further highlights the complexity of the 4q and 10q subtelomeric regions and the need of in-depth analyses in a significant number of cases. This work also highlights the complexity of the 4q35 region and interpretation issues with consequences on the molecular diagnosis of patients or genetic counseling.


Conflict of interest statement

The authors report no relevant disclosures. Go to Neurology.org/NG for full disclosures.

Figures

Figure 1
Figure 1. Overview of More Than 10 Years of Molecular Combing–Based Diagnosis of FSHD
(A) The most distal 4q region is represented (4q35 locus) together with the proximal FRG1, TUBB4Q, and FRG2 genes. As described in reference , the D4Z4 array is depicted by green triangles. Sequences starting with an inverted D4Z4 repeat (green arrow) are specific to the 4q35 locus (red lines). Regions located between the D4Z4 array and the inverted D4Z4 repeat are also present on the 10q26 locus (blue bar).The 4qA (red rectangle) is characterized by the presence of the pLAM sequence distal to the last D4Z4 repeat and followed by the telomere (red arrows). The 4qB allele (blue rectangle) differs from the 4qA. (B) The V3 pink barcode used to distinguish the different alleles (4qA/B; 10qA/B) is based on a specific combination of 4 different colors (blue, pink, red, and green) used to label the 4q35 locus and 10q26 loci up to the telomeric sequence. The proximal 4q-specific region is detected by a combination of red and pink probes. The proximal 10q-specific region is identified by a blue probe. For chromosome 4, the four-color barcode comprises 1 probe detected in blue and one in pink, which hybridize the proximal region, one 6 kb red probe, which hybridizes the (TTAGGG)n telomeric ends (red). The qB-specific probe, adjacent to D4Z4, is detected in blue. (C) Schematic representation of chromosome 10q and illustration of the V3 pink barcode used to distinguish the 2 10q alleles (qA/B) based on a combination of 4 different colors and different DNA probes encompassing the distal regions up to the telomeric sequence. The barcodes for the 4q-10q homologous regions are identical. The proximal 10q-specific region is identified by a blue probe leading to a combination of blue-pink-blue probe for the 10q26 locus and red-pink-blue for the 4q35 region. The distal A-type region is identified by a red probe, the B-type allele by a blue probe. (D) Of the 2,363 patients analyzed since 2011 by MC, 91.3% showed a normal profile with 4 distinct alleles and absence (1,357 cases, 57.6%) or presence (859 cases, 36.46%) of D4Z4 array contraction on a 4qA allele. The authors identified 6.26% of cases with an atypical profile with 2.12% (n = 50) of samples with a mosaic D4Z4 array contraction, 0.42% (n = 10) with a deletion of the p13E-11 probe, 1.32% (n = 31) of patients with a 4qA cis-duplication, 0.13% (n = 3) with a cis-duplication in mosaic, 0.13% (n = 3) with a cis-triplication, and 0.21% (n = 5) with a complex 4q35 rearrangement. In 0.21% (n = 5) of cases, only 3 alleles were detectable while 5 alleles were observed in 0.72% (n = 17) of cases. The authors noticed the presence of 10q26 rearrangements in 0.59% (n = 14) of cases, the absence of telomeric probes in 2 cases (0.08%), and 0.33% (n = 7) with multiple telomeric probes. FSHD = facioscapulohumeral dystrophy; MC = molecular combing.
Figure 2
Figure 2. Presence of a Red Probe and Gap Upstream of the Duplicated D4Z4 Array Suggests Genomic Inversion
(A) Schematic representation of the 4q35 barcode. The size of the different regions was estimated by the analysis of >1000 DNA samples previously processed by MC. For the 4qA allele, a probe labeled in red hybridizes the qA-specific β-satellite region of variable lengths (6.4–7.5 kb). The size of the gap between the A-type and telomeric probe is estimated around 6.6–8.8 kb. (B–D) Images and schematic representations of new cis-duplication identified using the Fibervision tool. For each D4Z4 array, the size in kb is indicated together with the number of D4Z4 units. (B) Absence of the red probe corresponding to the A-type region upstream of the duplicated D4Z4 array (case 19-I1). (C and D) Presence of the red probe (A-type region) upstream of the duplicated D4Z4 array (C, case 17-I1; D, case 21-I1). (E) Schematic representation of the possible mechanism leading to the 4q35 cis-duplication. The authors hypothesize a duplication and inversion of the region containing a variable number of D4Z4 repeats (<10 RUs), the A-type region, and the gap between this A-type region and the telomere followed by insertion or the duplicated region within the A-type region. Depending on the context (presence or absence of SMCHD1 variant), the long D4Z4 array might remain methylated (black dots) while the short allele might be hypomethylated (white dots). In this configuration, the DUX4 coding region is in the opposite orientation. It remains to be determined whether the recombined allele remains permissible for transcription. MC = molecular combing.
Figure 3
Figure 3. Comparative Analysis of 4qter and 10qter Regions by Molecular Combing and Single Molecule Optical Mapping
(A–D) The V3 pink barcode was used to distinguish the different alleles (4qA/B, 10qA/B) by MC. For the samples selected, only the cis-duplicated 4q allele is presented. On scanned images, the size of the D4Z4 arrays is given in kb. A schematic representation of the 4q locus is presented with the number of D4Z4 repeats (RUs) indicated. SMOM analyses Bionano EnFocus FSHD tool is presented next to the combing images. For SMOM, the D4Z4 array is depicted in purple with only the putative cis-duplicated alleles presented. The 4qA-specific region is identified by a red square. Complete details are provided in Table. (A) Sample 1 (ID 16705) and (B) Sample 2 (ID 15906), analyzed using the GV lab software, were previously reported. (C and D) Samples 3 and 4 were analyzed using the FiberStudio analysis software. (A–C) Only the cis-duplicated 4q allele is presented. (A–D) The size of the D4Z4 arrays is given in kb. The number of D4Z4 repeats (RUs) is indicated underneath the schematic representation of the 4q locus. The results of SMOM are presented for the 2 4q alleles together with one of the 2 10qA allele, identified by a green square. The 4q35 allele corresponding to the duplicated locus is indicated by dashed lines. The 2 unmapped alleles, identified by MC as being 10qA are represented. (D) Representation of the shortest 4qA allele for sample 4. (E) Samples were reanalyzed using the Bionano de novo assembly tool. For identification of D4Z4 cis-duplication, distance between labels of the repeat region (purple region of SMOM Enfocus representation) was manually calculated, minus the static region of the labels around the repeat region (hg19: 19,691 for 4qA or 11,791 for 4qB). MC = molecular combing; SMOM = single molecule optical mapping.
Figure 4
Figure 4. Complex Rearrangements at the 4q35 Locus
(A) Presence of a large deletion encompassing the proximal pink and blue probes in a patient (30-I1, Table) affected with FSHD, with deletion of a number of D4Z4 units. The size of the deletion is estimated of more than 42 kb. (B) This patient (31-I1) carries a deletion of the proximal 4q35 region upstream of D4Z4 (>42 kb) together with a complex rearrangement of one 10q end. This rearrangement consists in the cis-duplication of 5 D4Z4 arrays of different sizes, all flanked by red probes (A-type allele) and separated by the gap present between the type A allele and the telomere. (C) This patient (27-I1) carries a triplication of D4Z4 arrays of different sizes (39 RUs, 13 RUs, 5 RUs from the centromere to the telomere). The 2 additional D4Z4 arrays are flanked by A-type probes, and all repeated arrays are separated by a gap. (D) Patient 32-I1 carries a cis-duplication of the blue probe encompassing the p13E11 probe (D4S104S1 marker), upstream of a short D4Z4 array (17 kb, 5 RUs). (E) Presence of a large duplication of the 4q35 region encompassing the proximal chromosome 4–specific region (red, pink, and blue probes) followed by a short D4Z4 array (9 RUs). This region is followed by a larger chromosome 4–specific region (red, pink, and blue probes) containing a 205 kb long D4Z4 array (62 RUs). Each D4Z4 array is followed by an A-type probe. (F) Presence of a large duplication of the 4q-specific region encompassing the proximal regions (red, pink, and blues probes), the D4Z4 array and the A-type probe. The 2 different D4Z4 arrays are of different sizes (135 kb, 41 RUs and 170 kb, 51 RUs) and above the threshold of 10 units. FSHD = facioscapulohumeral dystrophy.
Figure 5
Figure 5. Complex Rearrangements at the 10q26 Locus
(A) Schematic representation of chromosome 10q and illustration of the V3 pink barcode used to distinguish the 2 10q alleles (qA/B). The proximal 10q-specific region is identified by hybridization with a blue probe, with a combination of blue-pink-blue probe for the 10q26 locus and red-pink-blue for the 4q35 region as described. (B) Cis-duplication of the 10q26 region with 2 D4Z4 arrays of different sizes (38 RUs and 7.5 RUs) separated by a gap. The second repeated array is flanked by red probes. (C) Triplication of the D4Z4 region in 2 different cases (37-I1 and 38-I1). The 2 additional D4Z4 arrays are flanked by red probes. All 3 arrays are separated by a gap. The shortest D4Z4 array is not the most distal as observed for chromosome 4. (D) Presence of additional copies of the terminal telomeric probes in 2 cases, 33-I1 with 3 probes (estimated size, 29–36 kb) and 35-I1 with 9 probes (estimated size, 117–288 kb).

References

    1. Mostacciuolo ML, Pastorello E, Vazza G, et al. . Facioscapulohumeral muscular dystrophy: epidemiological and molecular study in a north-east Italian population sample. Clin Genet. 2009;75(6):550-555. doi:10.1111/j.1399-0004.2009.01158.x - DOI - PubMed
    1. Deenen JC, Arnts H, van der Maarel SM, et al. . Population-based incidence and prevalence of facioscapulohumeral dystrophy. Neurology. 2014;83(12):1056-1059. doi:10.1212/wnl.0000000000000797 - DOI - PMC - PubMed
    1. Padberg GW, van Engelen BG. Facioscapulohumeral muscular dystrophy. Curr Opin Neurol. 2009;22(5):539-542. doi:10.1097/wco.0b013e328330a572 - DOI - PubMed
    1. Wijmenga C, van Deutekom JC, Hewitt JE, et al. . Pulsed-field gel electrophoresis of the D4F104S1 locus reveals the size and the parental origin of the facioscapulohumeral muscular dystrophy (FSHD)-associated deletions. Genomics. 1994;19(1):21-26. doi:10.1006/geno.1994.1006 - DOI - PubMed
    1. Sarfarazi M, Wijmenga C, Upadhyaya M, et al. . Regional mapping of facioscapulohumeral muscular dystrophy gene on 4q35: combined analysis of an international consortium. Am J Hum Genet. 1992;51(2):396-403. - PMC - PubMed

LinkOut - more resources