The gene expression patterns as surrogate indices of pH in the brain
- PMID: 37200901
- PMCID: PMC10185791
- DOI: 10.3389/fpsyt.2023.1151480
The gene expression patterns as surrogate indices of pH in the brain
Abstract
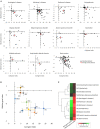
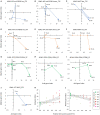
Hydrogen ion (H+) is one of the most potent intrinsic neuromodulators in the brain in terms of concentration. Changes in H+ concentration, expressed as pH, are thought to be associated with various biological processes, such as gene expression, in the brain. Accumulating evidence suggests that decreased brain pH is a common feature of several neuropsychiatric disorders, including schizophrenia, bipolar disorder, autism spectrum disorder, and Alzheimer's disease. However, it remains unclear whether gene expression patterns can be used as surrogates for pH changes in the brain. In this study, we performed meta-analyses using publicly available gene expression datasets to profile the expression patterns of pH-associated genes, whose expression levels were correlated with brain pH, in human patients and mouse models of major central nervous system (CNS) diseases, as well as in mouse cell-type datasets. Comprehensive analysis of 281 human datasets from 11 CNS disorders revealed that gene expression associated with decreased pH was over-represented in disorders including schizophrenia, bipolar disorder, autism spectrum disorders, Alzheimer's disease, Huntington's disease, Parkinson's disease, and brain tumors. Expression patterns of pH-associated genes in mouse models of neurodegenerative disease showed a common time course trend toward lower pH over time. Furthermore, cell type analysis identified astrocytes as the cell type with the most acidity-related gene expression, consistent with previous experimental measurements showing a lower intracellular pH in astrocytes than in neurons. These results suggest that the expression pattern of pH-associated genes may be a surrogate for the state- and trait-related changes in pH in brain cells. Altered expression of pH-associated genes may serve as a novel molecular mechanism for a more complete understanding of the transdiagnostic pathophysiology of neuropsychiatric and neurodegenerative disorders.
Keywords: gene expression patterns; meta-analysis; neurodegenerative diseases; neuropsychiatric disorders; pH; postmortem brain.
Copyright © 2023 Hagihara, Murano and Miyakawa.
Conflict of interest statement
The authors declare that the research was conducted in the absence of any commercial or financial relationships that could be construed as a potential conflict of interest.
Figures


Similar articles
-
Large-scale animal model study uncovers altered brain pH and lactate levels as a transdiagnostic endophenotype of neuropsychiatric disorders involving cognitive impairment.Elife. 2024 Mar 26;12:RP89376. doi: 10.7554/eLife.89376. Elife. 2024. PMID: 38529532 Free PMC article.
-
Postmortem evidence of decreased brain pH in major depressive disorder: a systematic review and meta-analysis.Transl Psychiatry. 2024 Nov 4;14(1):460. doi: 10.1038/s41398-024-03173-7. Transl Psychiatry. 2024. PMID: 39496593 Free PMC article.
-
Decreased Brain pH as a Shared Endophenotype of Psychiatric Disorders.Neuropsychopharmacology. 2018 Feb;43(3):459-468. doi: 10.1038/npp.2017.167. Epub 2017 Aug 4. Neuropsychopharmacology. 2018. PMID: 28776581 Free PMC article.
-
Big Data Analysis of Genes Associated With Neuropsychiatric Disorders in an Alzheimer's Disease Animal Model.Front Neurosci. 2018 Jun 15;12:407. doi: 10.3389/fnins.2018.00407. eCollection 2018. Front Neurosci. 2018. PMID: 29962931 Free PMC article.
-
Astrocytes in Neuropsychiatric Disorders: A Review of Postmortem Evidence.Adv Neurobiol. 2021;26:153-172. doi: 10.1007/978-3-030-77375-5_8. Adv Neurobiol. 2021. PMID: 34888835 Review.
Cited by
-
H3K18 lactylation-mediated nucleotide-binding oligomerization domain-2 (NOD2) expression promotes bilirubin-induced pyroptosis of astrocytes.J Neuroinflammation. 2025 Mar 12;22(1):76. doi: 10.1186/s12974-025-03399-2. J Neuroinflammation. 2025. PMID: 40075479 Free PMC article.
-
Glu592 of the axon guidance receptor ROBO3 mediates a pH-dependent interaction with NELL2 ligand.FEBS Lett. 2025 Feb;599(4):571-580. doi: 10.1002/1873-3468.15054. Epub 2024 Nov 12. FEBS Lett. 2025. PMID: 39531524 Free PMC article.
-
Synergistic label-free fluorescence imaging and miRNA studies reveal dynamic human neuron-glial metabolic interactions following injury.Sci Adv. 2024 Dec 13;10(50):eadp1980. doi: 10.1126/sciadv.adp1980. Epub 2024 Dec 11. Sci Adv. 2024. PMID: 39661671 Free PMC article.
-
Decreased Brain pH Correlated With Progression of Alzheimer Disease Neuropathology: A Systematic Review and Meta-Analyses of Postmortem Studies.Int J Neuropsychopharmacol. 2024 Oct 1;27(10):pyae047. doi: 10.1093/ijnp/pyae047. Int J Neuropsychopharmacol. 2024. PMID: 39422361 Free PMC article.
-
Evidence for an Association Between a pH-Dependent Potassium Channel, TWIK-1, and the Accuracy of Smooth Pursuit Eye Movements.Invest Ophthalmol Vis Sci. 2024 Jul 1;65(8):24. doi: 10.1167/iovs.65.8.24. Invest Ophthalmol Vis Sci. 2024. PMID: 39012638 Free PMC article.
References
-
- Kaila K, Ransom BR. pH and Brain Function. New York: Wiley-Liss. (1998).
LinkOut - more resources
Full Text Sources

