. 2023 Aug 1:276:120173.
doi: 10.1016/j.neuroimage.2023.120173. Epub 2023 May 16.

Brain morphometry in older adults with and without dementia using extremely rapid structural scans

Affiliations

Brain morphometry in older adults with and without dementia using extremely rapid structural scans

Maxwell L Elliott et al. Neuroimage. .

Abstract

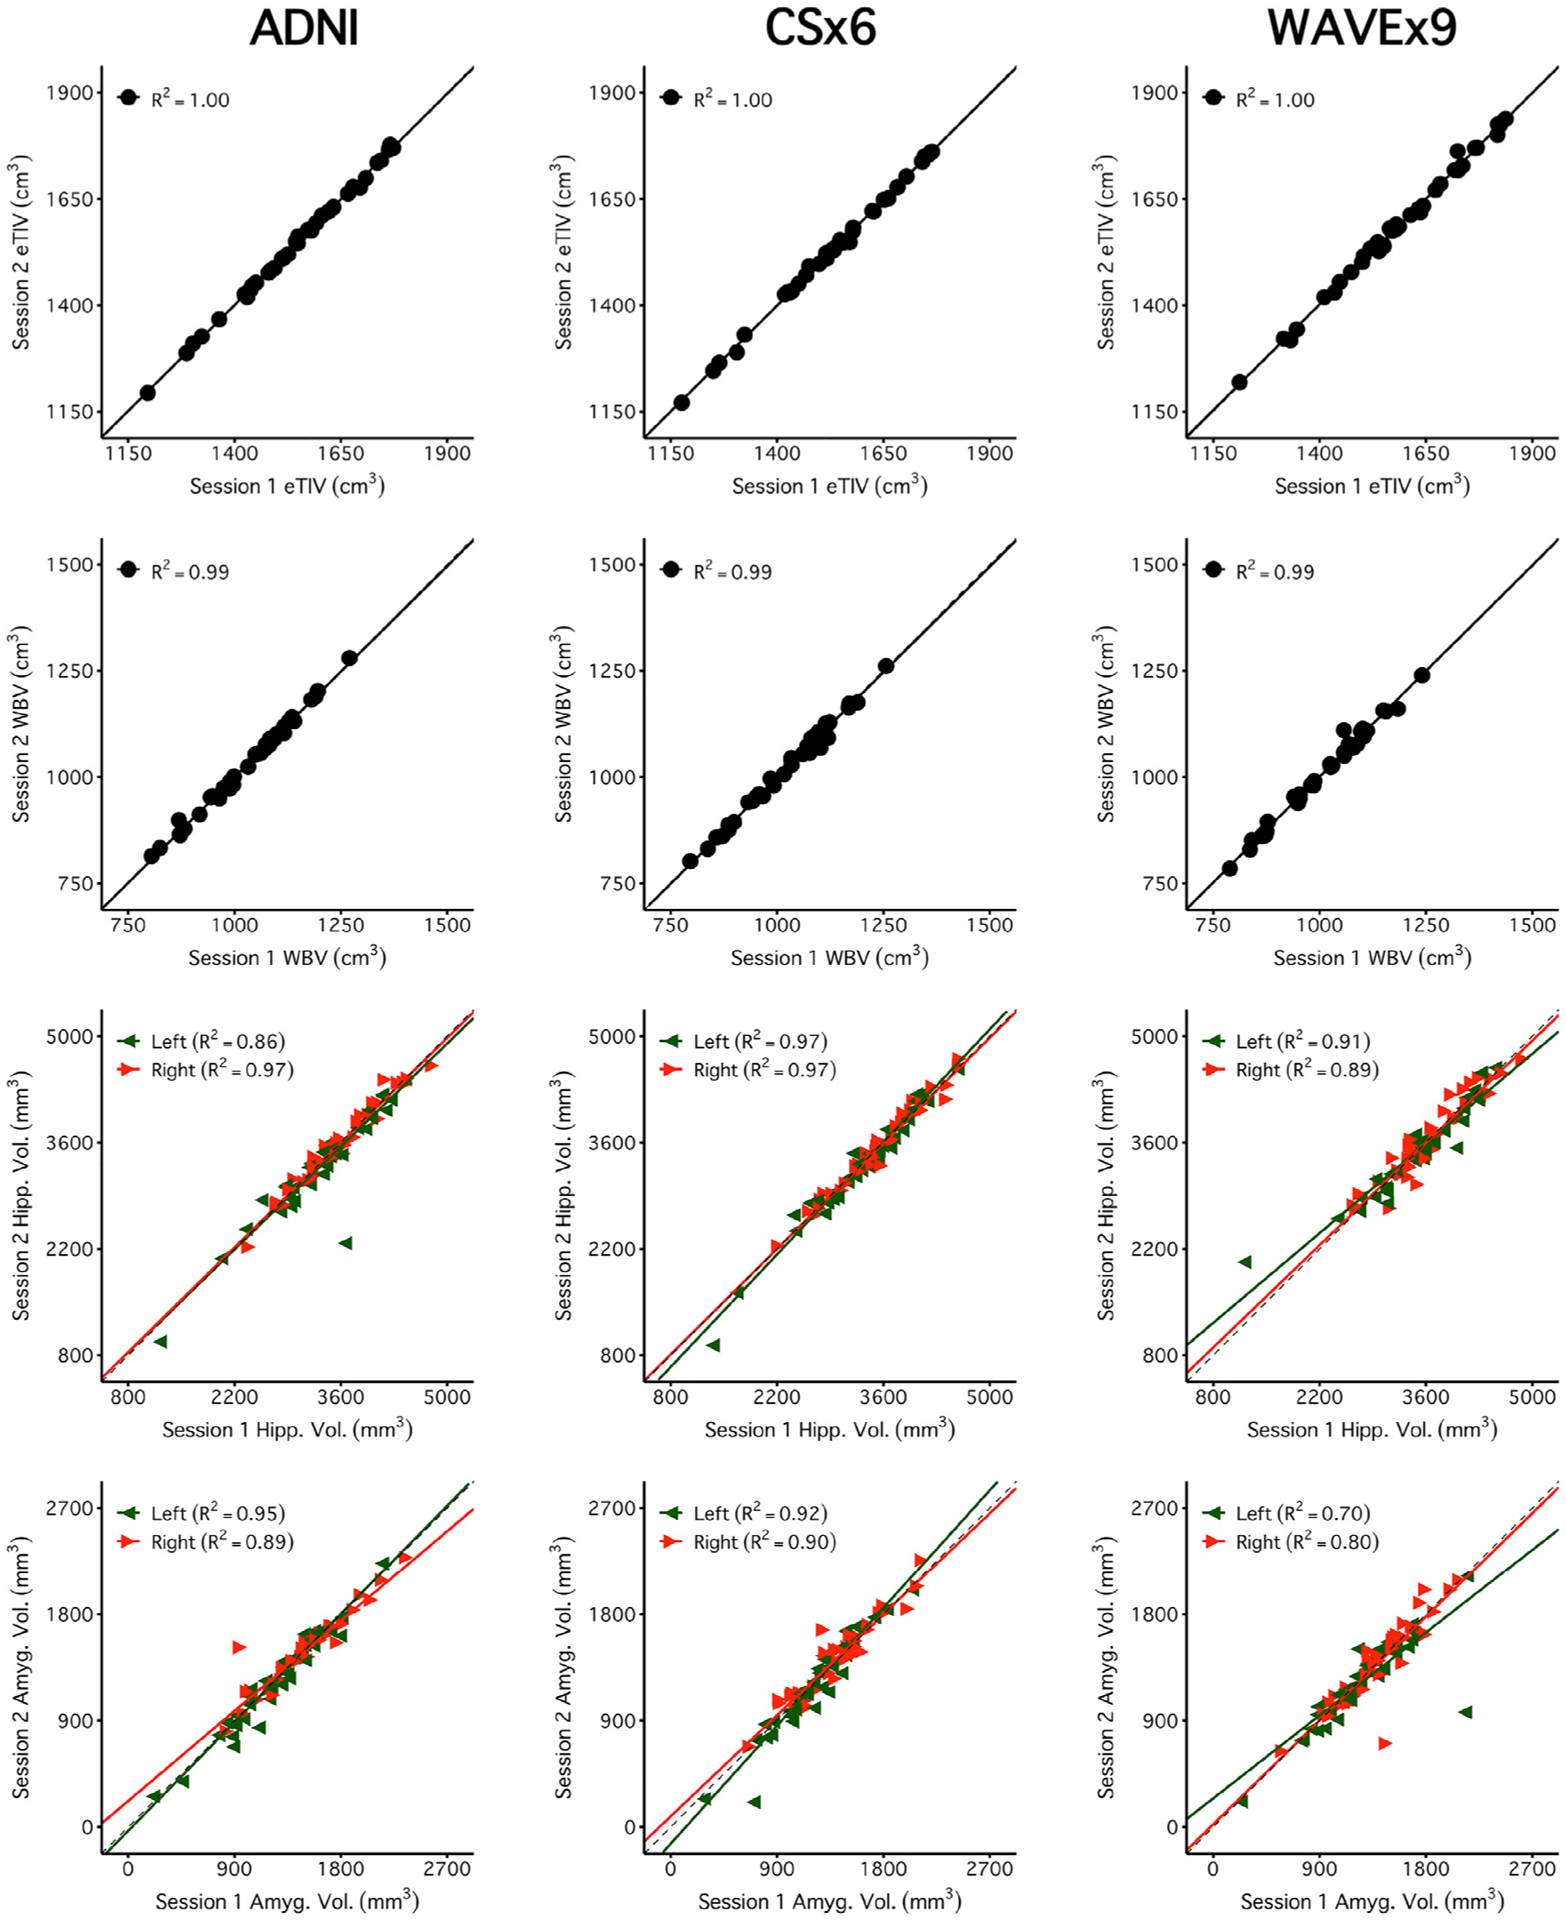
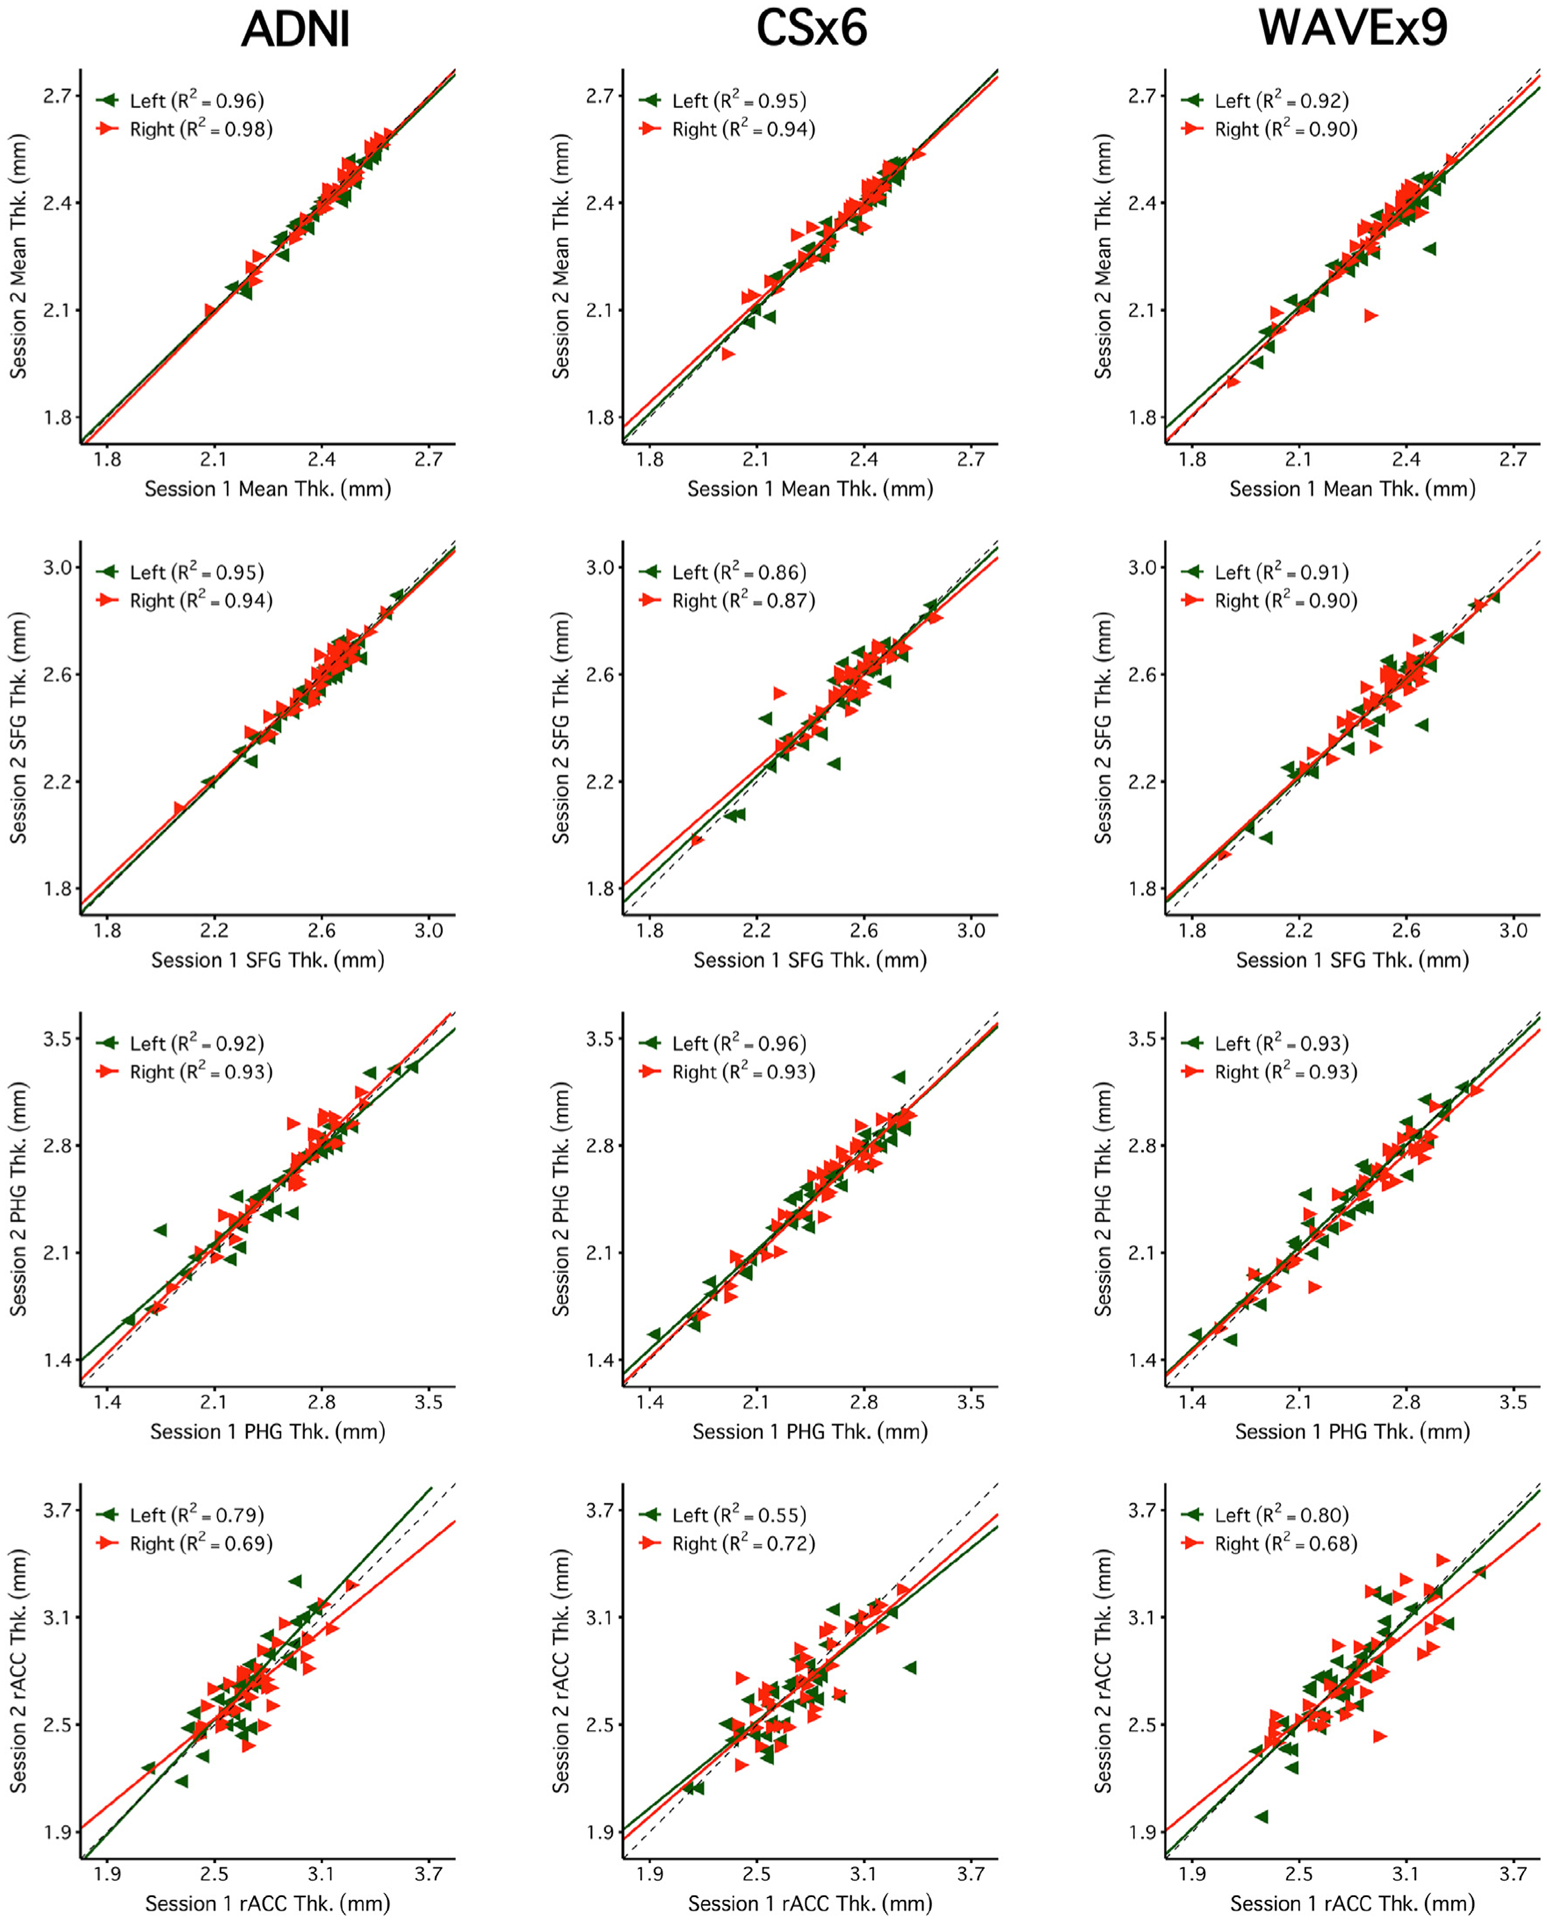
T1-weighted structural MRI is widely used to measure brain morphometry (e.g., cortical thickness and subcortical volumes). Accelerated scans as fast as one minute or less are now available but it is unclear if they are adequate for quantitative morphometry. Here we compared the measurement properties of a widely adopted 1.0 mm resolution scan from the Alzheimer's Disease Neuroimaging Initiative (ADNI = 5'12'') with two variants of highly accelerated 1.0 mm scans (compressed-sensing, CSx6 = 1'12''; and wave-controlled aliasing in parallel imaging, WAVEx9 = 1'09'') in a test-retest study of 37 older adults aged 54 to 86 (including 19 individuals diagnosed with a neurodegenerative dementia). Rapid scans produced highly reliable morphometric measures that largely matched the quality of morphometrics derived from the ADNI scan. Regions of lower reliability and relative divergence between ADNI and rapid scan alternatives tended to occur in midline regions and regions with susceptibility-induced artifacts. Critically, the rapid scans yielded morphometric measures similar to the ADNI scan in regions of high atrophy. The results converge to suggest that, for many current uses, extremely rapid scans can replace longer scans. As a final test, we explored the possibility of a 0'49'' 1.2 mm CSx6 structural scan, which also showed promise. Rapid structural scans may benefit MRI studies by shortening the scan session and reducing cost, minimizing opportunity for movement, creating room for additional scan sequences, and allowing for the repetition of structural scans to increase precision of the estimates.

Keywords: ADNI; Aging; Alzheimer's disease; Frontotemporal lobar degeneration; Hippocampus; MRI.


Conflict of interest statement

Declaration of Competing Interest Tom Hilbert and Tobias Kober are employed by Siemens Healthineers International AG, Switzerland. The authors have no other conflicts of interest to report.

Figures

Fig. 1.
Fig. 1.
Extremely rapid compressed-sensing and Wave-CAIPI protocols generate morphometrics-ready high-resolution T1-weighted structural scans. The same coronal and sagittal slices (A, C) alongside a zoomed-in portion of each respective slice (B, D) are displayed from the same scan session for three scan types from a single representative participant (77-year-old cognitively unimpaired female). In row 1, images are from a standard 1.0 mm isotropic T1-weighted acquisition (5′12”; ADNI). In row 2, images are from the 1.0 mm isotropic CSx6 acquisition (1′12”). CSx6 achieves a ~5-fold reduction in scan time compared to the standard ADNI acquisition by sparsely sampling k-space data during acquisition. In row 3, images are from the 1.0 mm isotropic WAVEx9 acquisition (1′09”). WAVEx9 achieves a ~5-fold reduction in acquisition time through parallel imaging. Note that while the CSx6 and WAVEx9 achieve high-resolution images, there are differences in image quality when compared with the ADNI image. In B the boundary between the pallidum, putamen, and the surrounding white matter shows lower contrast. In D, the medial prefrontal cortex appears grainier with lower contrast.
Fig. 2.
Fig. 2.
Parcellations of subcortical structures can be estimated from rapid structural scans. Automated volumetric labeling is illustrated from FreeSurfer’s recon-all pipeline for the ADNI (row 1), CSx6 (row 2), and WAVEx9 (row 3) images. To aid visual comparison, coronal (A) and sagittal (B) sections from each scan type from a single representative participant are shown (86-year-old cognitively unimpaired male). Volumetric labels (FreeSurfer aseg) are successfully estimated in the rapid scans and are comparable to the ADNI scan with only minor differences.
Fig. 3.
Fig. 3.
Cortical surfaces align across much of the cortex for all scan types with exceptions. Representative pial surfaces (outer boundaries) and gray/white surfaces (inner boundaries) from a single representative participant (73-year-old male with Alzheimer’s Dementia) are visualized for each scan type simultaneously on top of the same ADNI image (ADNI = cyan, CSx6 = green, and WAVEx9 = orange). Coronal (A, B, G, H), transverse (C, D), and sagittal (E, F) sections are shown at two levels of zoom to aid visualization. This visualization illustrates the similarity in surface estimates across much of the cortex as well as local regions of departure. Local regions of disagreement are illustrated by unclear, messy boundaries where individual boundaries stand out (examples noted by asterisks). For example, in the orbitofrontal prefrontal cortex (a region with relatively low test-retest reliability across scan types), each scan type has a different surface estimate (H, zoom). Estimation errors of this type contribute to the regions with lower reliability and validity estimates in Fig. 6.
Fig. 4.
Fig. 4.
Brain volume measures are highly reliable across days including measures from rapid structural sequences. Each plot displays the test-retest reliability brain volume measures that were independently estimated from two scan sessions on separate days. The between-subject correlation between volumetric measures from session 1 (x-axis) and session 2 (y-axis) are displayed for each scan type (columns) and four separate brain volume measures (rows). The four morphometric measures were selected to possess varied reliability from highest (top) to lowest (bottom). The size of each test-retest correlation (R2) is displayed in the top left of each panel. The first two rows display two widely used global brain volume measures – estimated total intracranial volume (eTIV) and whole brain volume (WBV). The third and fourth rows display measures of hippocampal volume (Hipp. Vol.) and amygdala volume (Amyg. Vol.). For these bilateral regional volume measures, estimates from each hemisphere are plotted separately (green triangles for the left and red triangles for the right). Perfect agreement (X = Y) is displayed in each plot as a dotted identity line. Generally, these plots illustrate excellent test-retest reliability, even displaying reliable estimation for the cases of neurodegeneration (the lowest values in the hippocampal and amygdala plots). Note that while ADNI and CSx6 reliabilities are similar in each case, the reliability for ADNI hippocampal volume and WAVEx9 amygdala volume are lower due to outlier measures in an individual with svPPA where the temporal lobe has marked neurodegeneration. While uncommon, these examples highlight how outliers occur in both ADNI and rapid scans.
Fig. 5.
Fig. 5.
Regional cortical thickness measures are highly reliable across days including measures from rapid structural sequences. Each plot displays the test-retest reliability of regional thickness measures that were independently estimated from two scan sessions on separate days. Plots are arranged as in Fig. 4 with scan types in each column and regional thickness measures in each row. The four example measures were again selected to possess varied reliability from highest (top) to lowest (bottom). The first row is a global measure of mean cortical thickness across the entire cortex (Mean Thk.). Next are rows displaying regional thickness measures including the superior-frontal gyrus (SFG Thk.), the parahippocampal gyrus (PHG Thk.), and the rostral anterior cingulate (rACC Thk.). The rapid scans perform similarly to ADNI. Notably, reliability estimates were lower across all scans for the rACC, a region with known estimation challenges.
Fig. 6.
Fig. 6.
Reliability and validity estimates for all measures. The top row (A) extends from the data presented in Figs. 4 and 5, to compare the test-retest correlations (R2) between ADNI (x-axis) directly to each of the rapid scan types (y-axis) for all measures. Correlation values are plotted for CSx6 (left) and WAVEx9 (right). Volume measures are in red and thickness measures are in blue. Most correlations are clustered along the identity line in the upper right-hand corner indicating that estimates are similar between scan types and highly reliable. Several regions in the orbitofrontal cortex are above the identity line indicating that they have higher reliabilities in both CSx6 and WAVEx9 than in ADNI. Conversely, several regions that are located near the midline of the brain (e.g., pallidum and cingulate cortex) are found below the identity line indicating that they have higher reliabilities in ADNI than in both rapid scan types. Notably, these regions are furthest away from the head coil and thus may be most impacted by lower SNR in the rapid scans. The bottom row (B) comprehensively displays the validity estimates for all measures. All regional validity estimates are plotted from correlations (R2) between ADNI and each rapid scan type (CSx6 on the left and WAVEx9 on the right). Each plot displays Session 1 validity estimates (x-axis) plotted against Session 2 validity estimates (y-axis). Validity estimates for volume measures are plotted in red and thickness measures are plotted in blue. Most validity estimates are clustered in the upper right of the plot along the X = Y identity line indicating strong convergent validity that is consistent across sessions. Regions away from the identity line, including the lateral orbitofrontal cortex, posterior cingulate, and pallidum, highlight regions where validity estimates are inconsistent between sessions and may be affected by outlier estimates in a single session. Abbreviations: left (L), right (R), pallidum (Pall), posterior cingulate cortex (pCC), medial orbitofrontal cortex (mOFC), lateral orbitofrontal cortex (lOFC), caudal anterior cingulate cortex (caCC), rostral anterior cingulate cortex (raCC), peri-calcarine (pCalc), lingual (Ling), frontal pole (FP), precentral (preC), paracentral (paraC).
Fig. 7.
Fig. 7.
Measurement error is similar across scan types. Mean measurement errors were estimated for each measure from Figs. 4 and 5. For each morphometric measure, the measurement error is estimated as percent errors, defined as the absolute difference between the Session 1 and Session 2 estimates divided by the average morphometric size, averaged across all participants. Error bars represent the standard error of the mean. Error estimates are roughly similar across scan types. These results suggest that rapid scans can match ADNI’s precision across many measures of interest, including widely used regional measures like hippocampal volume.
Fig. 8.
Fig. 8.
Measurement error estimates for all regions. Extending from the data presented in Fig. 7, which illustrates measurement error estimates for individual measures, the present plots comprehensively show the error estimates for all measures. Error estimates are plotted for CSx6 (left) and WAVEx9 (right) against error estimates for ADNI. Errors for volumes are plotted in red and thickness in blue. In most cases, error estimates fall near the X = Y identity line indicating similar regional errors in both rapid and ADNI scans. In aggregate, more estimates fall above the identity line than below indicating that, while the differences tend to be small, the rapid scans tend to have larger error estimates. Regions with notably larger errors in rapid scans compared to ADNI include regions along the midline (e.g., the pallidum) (see also Fig. 6). Across scan types, error estimates were the largest in the accumbens which is a small region known to be influenced by susceptibility artifacts. Abbreviations: left (L), right (R), accumbens (Acc), amygdala (Amyg), pallidum (Pall), temporal pole (TP).
Fig. 9.
Fig. 9.
Measures estimated from CSx6 scans are similar to those obtained from the standard ADNI reference scan. Estimates of convergent validity are displayed as the correlation (R2) for each measure displayed in Figs. 4 and 5. Plots display the between-subject correlation between brain volume measures estimated from the ADNI images (x-axis) with those estimated from the CSx6 images (CSx6; y-axis). Given each set of scan types was collected over two sessions, two separate R2 estimates are available. Session 1 is visualized here, and Session 2 is displayed in Supplemental Figure 2. High correlations are replicable across both sessions and closely cluster along the X = Y identity line, indicating a high degree of validity for the extremely rapid CSx6 scans. Note, the values for mean thickness fall off the identity line but remain proportionate across scan types with a high R2. This mean shift is likely due to different contrast properties between the ADNI and CSx6 scans leading to a subtle shift in the automated placement of gray/white boundaries that is made clearest in the global measure of mean thickness.
Fig. 10.
Fig. 10.
Measures estimated from WAVEx9 scans are similar to those obtained from the standard ADNI reference scan. Estimates of convergent validity are displayed as the correlation (R2 ) for each of the regional cortical thickness measures displayed in Figs. 4 and 5. Plots display the between-subjects correlation between the thickness measures estimated from the ADNI images (x-axis) and those estimated from the CSx6 images (CSx6; y-axis). Given each set of scan types was collected over two sessions, two separate R2 estimates are available. Session 1 is visualized here, and Session 2 is displayed in Supplemental Figure 3. High correlations are generally replicable across both sessions and closely cluster along the X = Y identity line, indicating a high degree of validity for the extremely rapid CSx6 scans. Note, the values for mean thickness fall off the identity line but remain proportionate across scan types with a high R2. This mean shift is likely due to different contrast properties between the ADNI and CSx6 scans leading to a subtle shift in the automated placement of gray/white boundaries that is made clearest in the global measure of mean thickness.
Fig. 11.
Fig. 11.
Extremely rapid scans of under one minute may be viable. Measurement errors were estimated for two new scan types that differed in resolution: CSx6 at 0.8 mm (1′49″, matching the resolution used by the Human Connectome Project in Aging; Bookheimer et al., 2019) and CSx6 at 1.2 mm resolution (0′49″, matching the resolution used by the Brain Genomics Superstruct Project; Holmes et al., 2015). For each measure, the percent error is defined as the absolute difference between Session 1 and Session 2 estimates divided by the average size of each morphometric, averaged across all participants. Error bars represent the standard error of the mean. Error estimates are roughly similar to ADNI scans for the sub-millimeter (CSx6 0.8 mm) and the sub-minute (CSx6 1.2 mm) scans. Extremely rapid lower-resolution scans may be viable for quantitative morphometry. Abbreviations: estimated total intracranial volume (eTIV), whole-brain volume (WBV), hippocampus (Hipp), amygdala (Amyg), mean cortical thickness (Mean Thk.), superior-frontal gyrus thickness (SFG Thk.), parahippocampal gyrus thickness (PHG Thk.), rostral anterior cingulate thickness (rACC Thk.).
Fig. 12.
Fig. 12.
Extremely rapid scans yield reliable measures. Plots display the test-retest reliability estimates for each measure of interest. For each measure, the extremely rapid scan produces highly reliable measures. Despite the larger voxel size, which enables sub-minute scanning, the CSx6 1.2 mm scan performed similarly to the CSx6 1.0 mm scan and the ADNI scan even in small regions like the amygdala. Notably, as in the other scans, reliability estimates were lower for the rACC, a region with known estimation challenges. Abbreviations: estimated total intracranial volume (eTIV), whole-brain volume (WBV), hippocampus (Hipp), amygdala (Amyg), mean cortical thickness (Mean Thk.), superior-frontal gyrus thickness (SFG Thk.), parahippocampal gyrus thickness (PHG Thk.), rostral anterior cingulate thickness (rACC Thk.).
Fig. 13.
Fig. 13.
Measures estimated from extremely rapid scans are similar to those obtained from the standard ADNI reference scan. Plots display the convergent validity estimates for each measure of interest. The eight example measures were again selected to possess varied reliability. The extremely rapid scans produce morphometric measures that tend to have high convergent validity despite their larger voxel size and sub-minute acquisition. Note, the values for mean thickness fall off the identity line but remain proportionate across scan types with a high R2 . This mean shift is likely due to different contrast properties between the ADNI and CSx6 scans leading to a subtle shift in the automated placement of gray/white boundaries that is made clearest in the global measure of mean thickness. Abbreviations: estimated total intracranial volume (eTIV), whole-brain volume (WBV), hippocampus (Hipp), amygdala (Amyg), mean cortical thickness (Mean Thk.), superior-frontal gyrus thickness (SFG Thk.), parahippocampal gyrus thickness (PHG Thk.), rostral anterior cingulate thickness (rACC Thk.).

Similar articles

Cited by

References

    1. Aisen PS, Jimenez-Maggiora GA, Rafii MS, Walter S, Raman R, 2022. Early-stage Alzheimer disease: getting trial-ready. Nat. Rev. Neurol 18, 389–399. doi:10.1038/s41582-022-00645-6. - DOI - PMC - PubMed
    1. Alexander-Bloch A, Clasen L, Stockman M, Ronan L, Lalonde F, Giedd J, Raznahan A, 2016. Subtle in-scanner motion biases automated measurement of brain anatomy from in vivo MRI. Hum. Brain Mapp 37, 2385–2397. doi:10.1002/hbm.23180. - DOI - PMC - PubMed
    1. Barnes J, Bartlett JW, van de Pol LA, Loy CT, Scahill RI, Frost C, Thompson P, Fox NC, 2009. A meta-analysis of hippocampal atrophy rates in Alzheimer’s disease. Neurobiol. Aging 30, 1711–1723. doi:10.1016/j.neurobiolaging.2008.01.010. - DOI - PMC - PubMed
    1. Baum GL, Flournoy JC, Glasser MF, Harms MP, Mair P, Sanders AFP, Barch DM, Buckner RL, Bookheimer S, Dapretto M, Smith S, Thomas KM, Yacoub E, Van Essen DC, Somerville LH, 2022. Graded variation in T1w/T2w ratio during adolescence: measurement, caveats, and implications for development of cortical myelin. J. Neurosci 42, 5681–5694. doi:10.1523/JNEUROSCI.2380-21.2022. - DOI - PMC - PubMed
    1. Bejanin A, Tammewar G, Marx G, Cobigo Y, Iaccarino L, Kornak J, Staffaroni AM, Dickerson BC, Boeve BF, Knopman DS, Gorno-Tempini M, Miller BL, Jagust WJ, Boxer AL, Rosen HJ, Rabinovici GD, 2020. Longitudinal structural and metabolic changes in frontotemporal dementia. Neurology 95, e140–e154. doi:10.1212/WNL.0000000000009760. - DOI - PMC - PubMed

Publication types