Review
. 2023 Sep;123(9):1280-1288.
doi: 10.1016/j.jand.2023.05.015. Epub 2023 May 16.

Healthy Eating Index-2020: Review and Update Process to Reflect the Dietary Guidelines for Americans,2020-2025

Affiliations
Review

Healthy Eating Index-2020: Review and Update Process to Reflect the Dietary Guidelines for Americans,2020-2025

Marissa M Shams-White et al. J Acad Nutr Diet. 2023 Sep.

Abstract

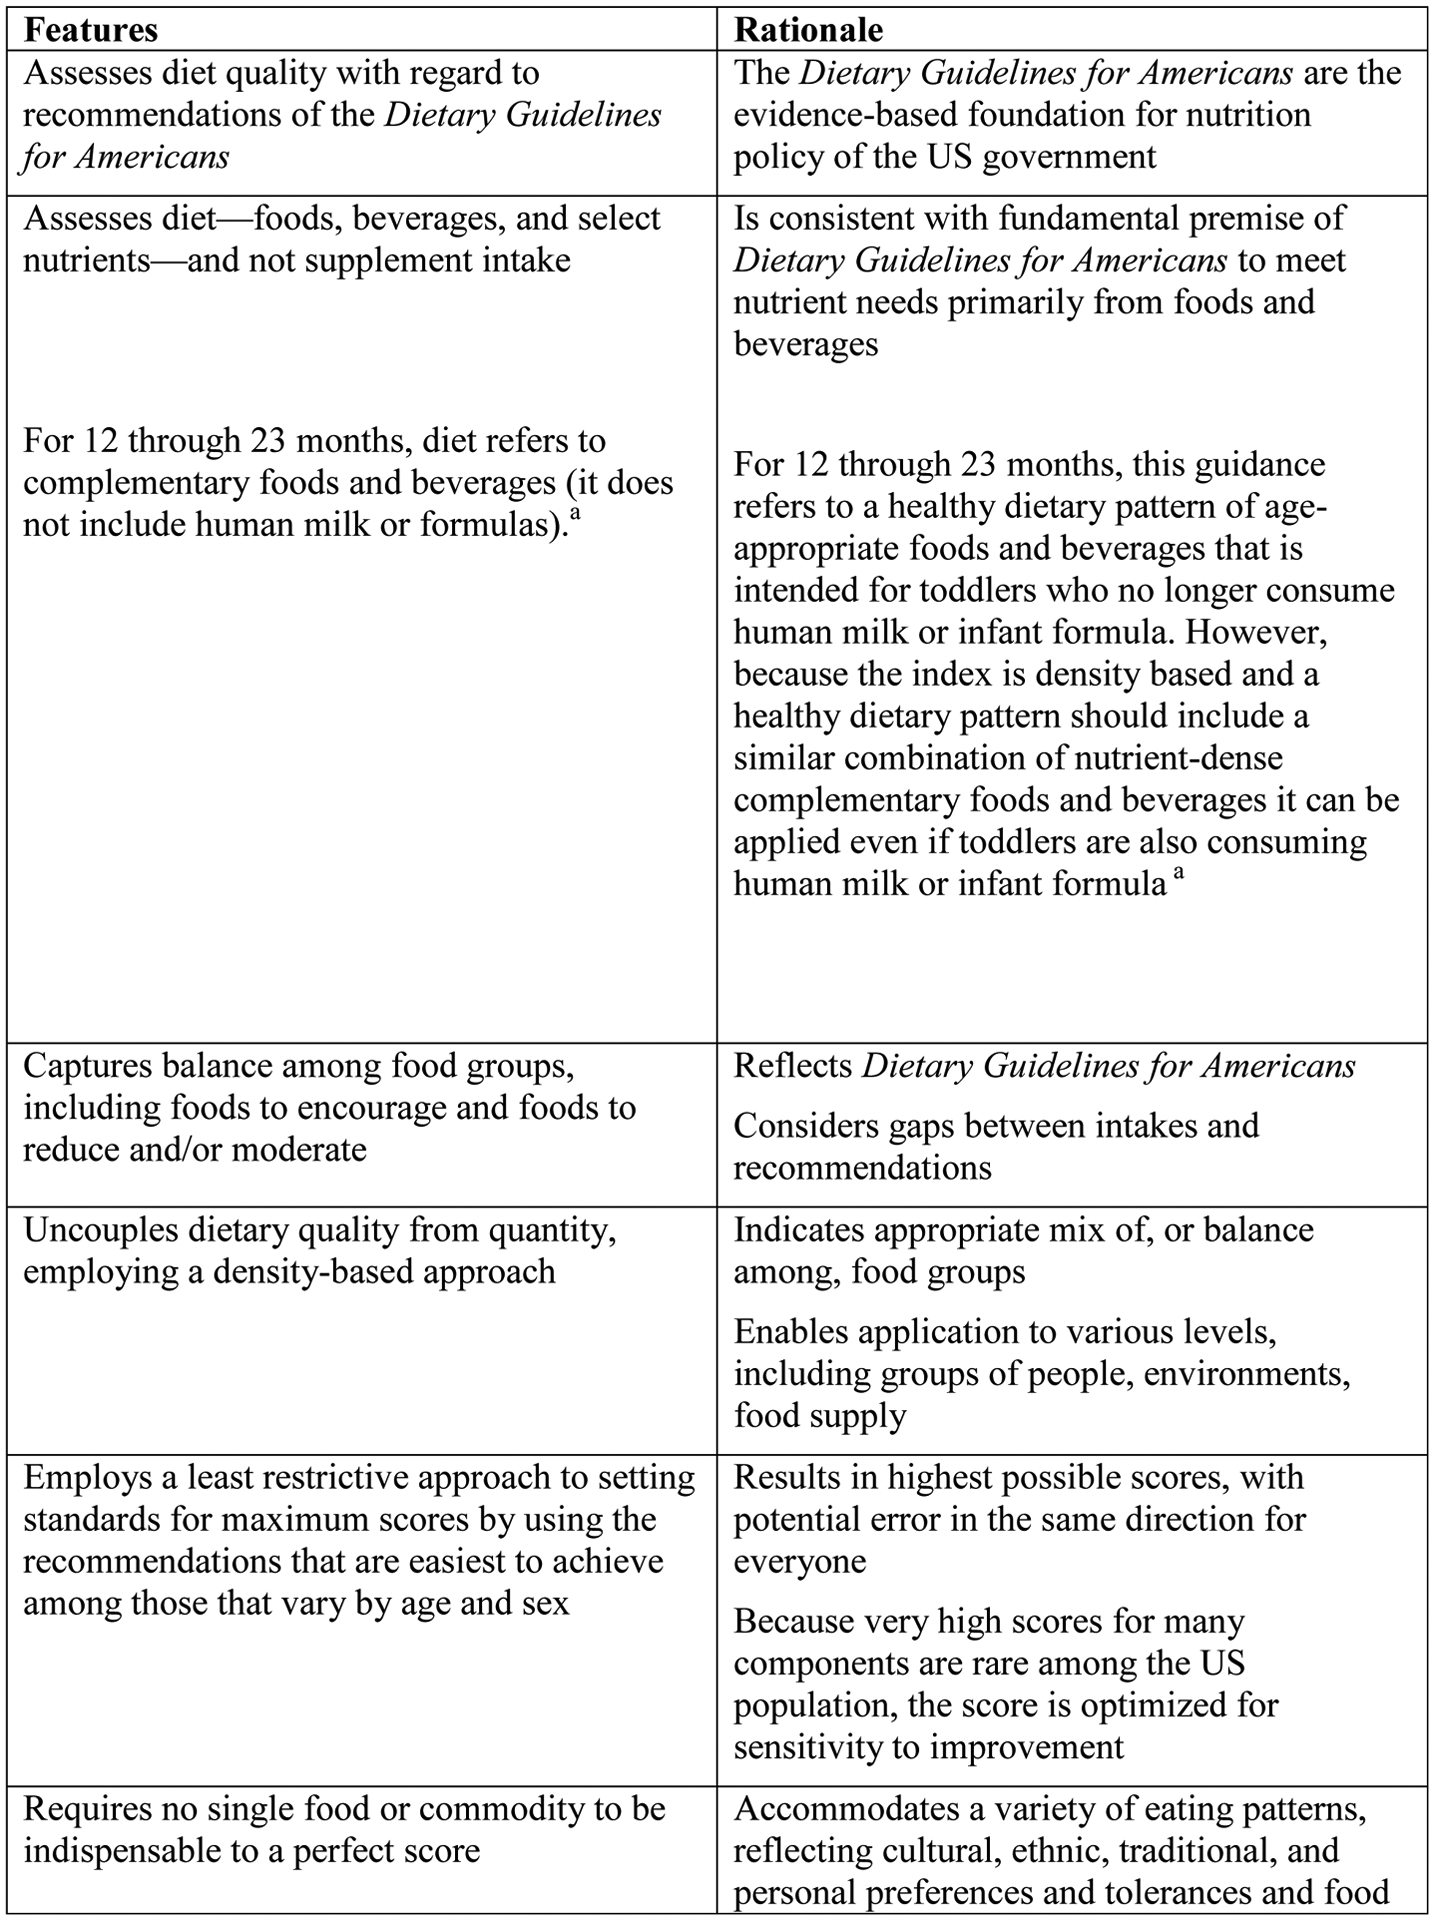
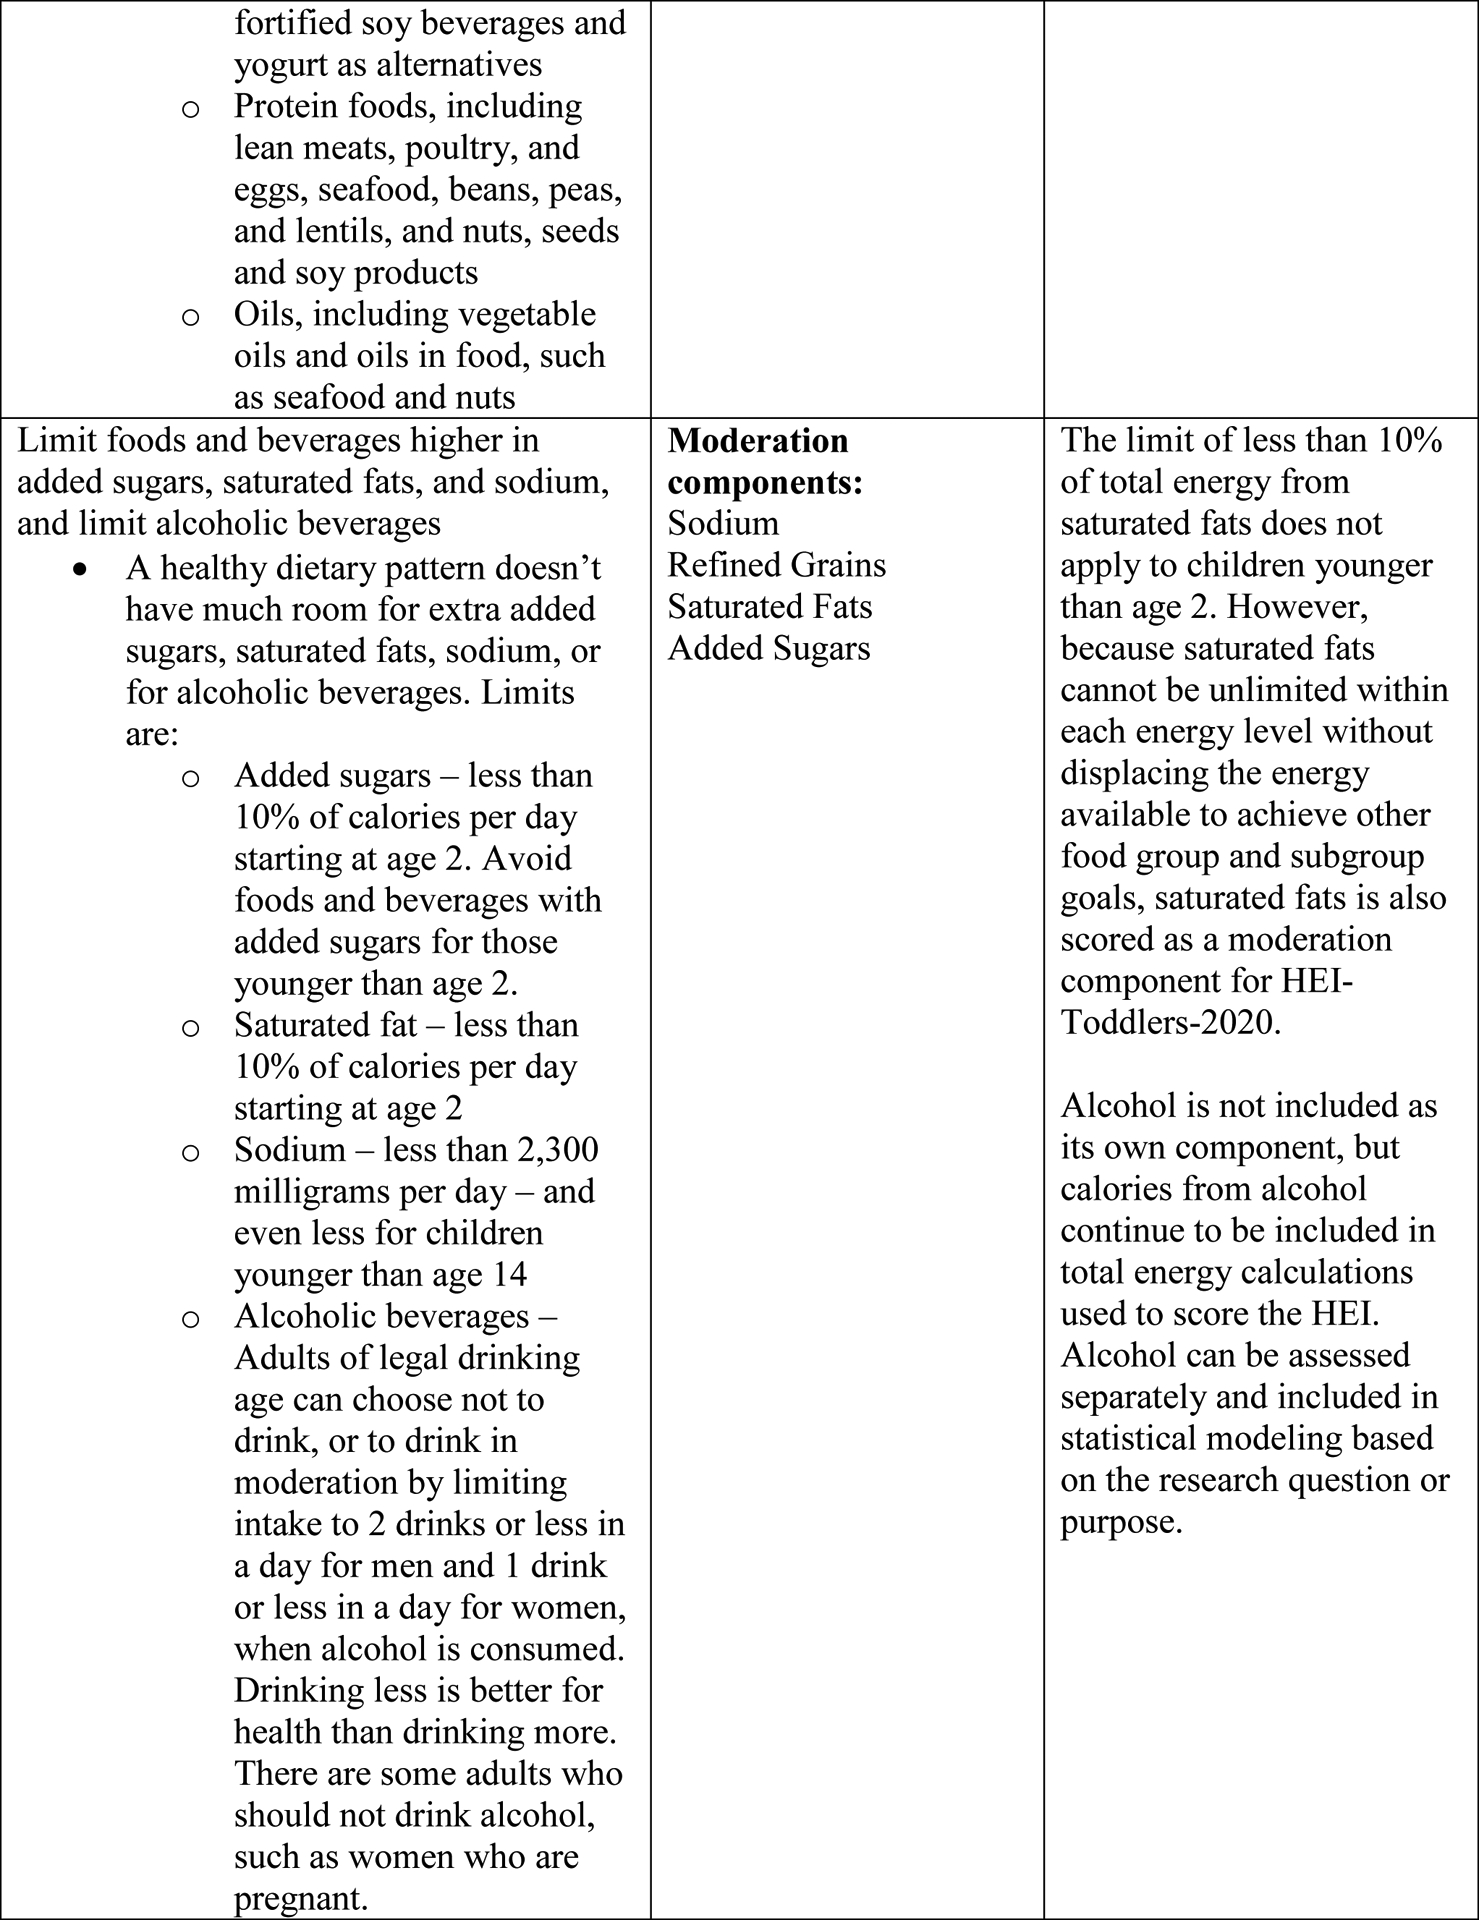
The purpose of this review is to share the process for reviewing, updating, and developing the most recent version of the Healthy Eating Index-2020 (HEI-2020) for ages 2 and older, following the release of the Dietary Guidelines for Americans (DGA), 2020-2025. The overall review process included: 1) gathering information from the updated DGA, experts, and federal stakeholders; 2) considering substantive changes and needs for new development, keeping in mind the HEI's key features and guiding principles, the US Department of Agriculture's Dietary Patterns that serve as the foundation for the HEI, and scoring considerations; and 3) completing evaluation analyses, including the examination of content validity. The review process led to the development of the HEI-2020; a separate HEI-Toddlers-2020 was developed for ages 12 through 23 months. The 13 components and scoring standards of the HEI-2020 fully align with the HEI-2015, although the index was renamed to clarify that it aligned with the most recent 2020-2025 DGA. As the evidence informing the DGA continues to evolve, various aspects of the HEI may need to evolve in the future as well. Further methodological research is encouraged to add to the scientific evidence base on dietary patterns, to examine needs specific to each life stage, and to model optimal trajectories of healthy dietary patterns over the lifespan.

Keywords: Diet quality; Dietary intake; Healthy Eating Index; diet indices.


Conflict of interest statement

Conflicts of Interest Disclosure: none

Figures

Figure 1.
Figure 1.
Features of the Healthy Eating Index (HEI) and guiding principles for development and updates. a Added to align with Dietary Guidelines for Americans, 2020–2025
Figure 1.
Figure 1.
Features of the Healthy Eating Index (HEI) and guiding principles for development and updates. a Added to align with Dietary Guidelines for Americans, 2020–2025
Figure 2.
Figure 2.
Components mapped to key dietary recommendations for HEI-2020a a HEI-2020, Healthy Eating Index-2020. The HEI-2020 is designed for Americans ages 2 and older. For those less than 2 years of age, see the HEI-Toddlers-2020., b DGA, Dietary Guidelines for Americans. The text in this column reflects exact language from the DGA.
Figure 2.
Figure 2.
Components mapped to key dietary recommendations for HEI-2020a a HEI-2020, Healthy Eating Index-2020. The HEI-2020 is designed for Americans ages 2 and older. For those less than 2 years of age, see the HEI-Toddlers-2020., b DGA, Dietary Guidelines for Americans. The text in this column reflects exact language from the DGA.
Figure 3.
Figure 3.
Healthy Eating Index-2020 (HEI-2020) components and scoring standardsa a The HEI-2020 components and scoring standards are the same as the HEI-2015. Intakes between the minimum and maximum standards are scored proportionately.  Component scores are summed to create the total score. b  Includes 100% fruit juice. c  Includes all forms except juice. d Includes beans, peas, and lentils. e Includes all milk products, such as fluid milk, yogurt, and cheese, and fortified soy beverages. f Includes seafood, nuts, seeds, soy products (other than beverages), and beans, peas, and lentils. g Ratio of poly- and monounsaturated fatty acids (PUFAs and MUFAs) to saturated fatty acids (SFAs). h PUFAs = polyunsaturated fatty acids i MUFAs = monounsaturated fatty acids j SFAs = saturated fatty acids
Figure 4.
Figure 4.
Healthy Eating Index-2020 (HEI-2020) radar plots across the lifespan, National Health and Nutrition Examination Survey 2011–2018, with (a) HEI-Toddlers-2020 for toddlers (12 through 23 months); (b) HEI-2020 for children (2–18 years); (c) HEI-2020 for adults (≥19 years).a-c a The HEI-Toddlers-2020 for 12 through 23 months is included to illustrate radar plots across the lifespan, however components and scoring approaches differ from the HEI-2020 for ages 2 and older. Further details on the HEI-Toddlers-2020 and scoring of each component are provided in the HEI-Toddlers-2020 Development paper. b On the radar plots, each component score is plotted as a percentage of its maximum points on 13 different axes. The outer edge of the radar represents 100% of the maximum score for that component; the center represents 0% of the maximum score for any component. Additional information on HEI visualization and radar plots can be found on the NCI website. c Total HEI Scores (out of 100 points) with (a): HEI-Toddlers-2020 for toddlers, 12 through 23 months = 63.4; (b) HEI-2020 for children, 2–4 years = 58.3; 5–8 years = 52.6; 9–13 years = 50.1; 14–18 years = 49.3; and (c) HEI-2020 for adults: 19–30 years = 55.3; 31–59 years = 55.3; ≥60 years = 59.5. Due to the overlapping, consistent results between age groups 19–30 years and 31–59 years, they are combined in the radar plot.
Figure 4.
Figure 4.
Healthy Eating Index-2020 (HEI-2020) radar plots across the lifespan, National Health and Nutrition Examination Survey 2011–2018, with (a) HEI-Toddlers-2020 for toddlers (12 through 23 months); (b) HEI-2020 for children (2–18 years); (c) HEI-2020 for adults (≥19 years).a-c a The HEI-Toddlers-2020 for 12 through 23 months is included to illustrate radar plots across the lifespan, however components and scoring approaches differ from the HEI-2020 for ages 2 and older. Further details on the HEI-Toddlers-2020 and scoring of each component are provided in the HEI-Toddlers-2020 Development paper. b On the radar plots, each component score is plotted as a percentage of its maximum points on 13 different axes. The outer edge of the radar represents 100% of the maximum score for that component; the center represents 0% of the maximum score for any component. Additional information on HEI visualization and radar plots can be found on the NCI website. c Total HEI Scores (out of 100 points) with (a): HEI-Toddlers-2020 for toddlers, 12 through 23 months = 63.4; (b) HEI-2020 for children, 2–4 years = 58.3; 5–8 years = 52.6; 9–13 years = 50.1; 14–18 years = 49.3; and (c) HEI-2020 for adults: 19–30 years = 55.3; 31–59 years = 55.3; ≥60 years = 59.5. Due to the overlapping, consistent results between age groups 19–30 years and 31–59 years, they are combined in the radar plot.

Similar articles

Cited by

References

    1. U.S. Department of Agriculture and U.S. Department of Health and Human Services.Dietary Guidelines for Americans, 2020 – 2025.; 2020.
    1. U.S. Department of Agriculture and U.S. Department of Health and Human Services.Process | Dietary Guidelines for Americans.AccessedApril 25, 2022. https://www.dietaryguidelines.gov/about-dietary-guidelines/process
    1. Guenther PM, Casavale KO, Reedy J, Kirkpatrick SI, Hiza HAB, Kuczynski KJ, Kahle LL, Krebs-Smith SM. Update of the Healthy Eating Index: HEI-2010. J Acad Nutr Diet. 2013;113(4):569–580. doi:10.1016/j.jand.2012.12.016 - DOI - PMC - PubMed
    1. Guenther PM, Reedy J, Krebs-Smith SM. Development of the Healthy Eating Index-2005. J Am Diet Assoc. 2008;108(11):1896–1901. doi:10.1016/j.jada.2008.08.016 - DOI - PubMed
    1. Krebs-Smith SM, Pannucci TRE, Subar AF, Kirkpatrick SI, Lerman JL, Tooze JA, Wilson MM, Reedy J. Update of the Healthy Eating Index: HEI-2015. J Acad Nutr Diet. 2018;118(9):1591–1602. doi:10.1016/j.jand.2018.05.021 - DOI - PMC - PubMed