. 2023 May 18;14(5):332.
doi: 10.1038/s41419-023-05853-6.

Butyrate limits inflammatory macrophage niche in NASH

Affiliations

Butyrate limits inflammatory macrophage niche in NASH

Ankita Sarkar et al. Cell Death Dis. .

Abstract

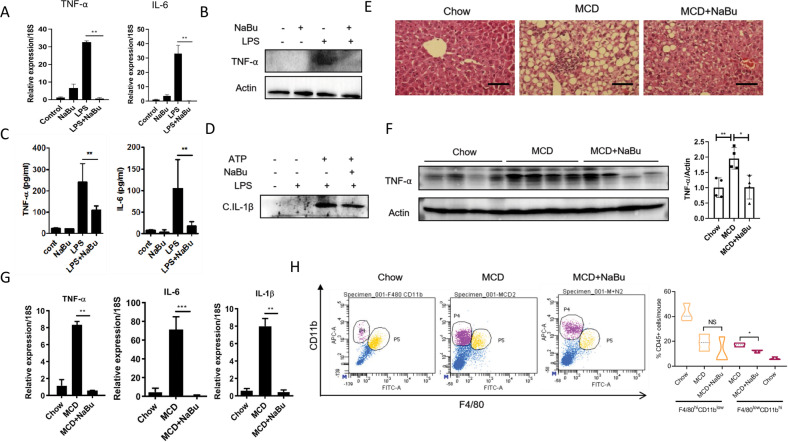
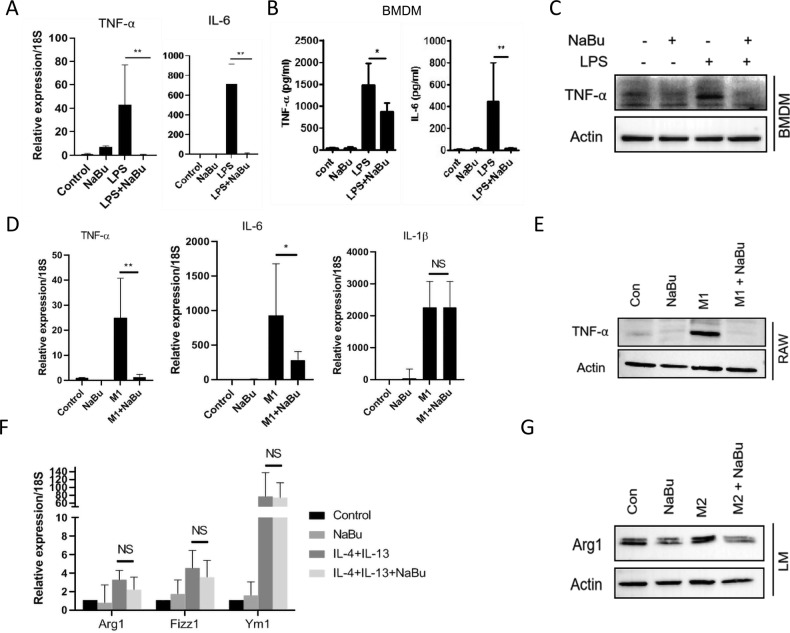
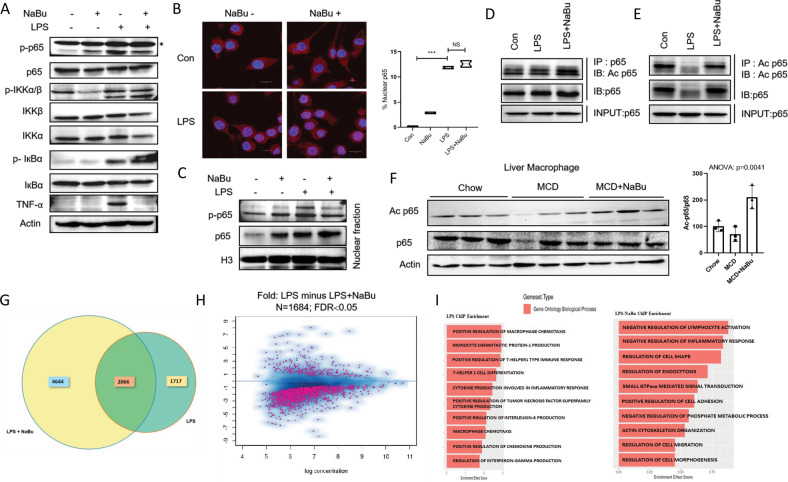
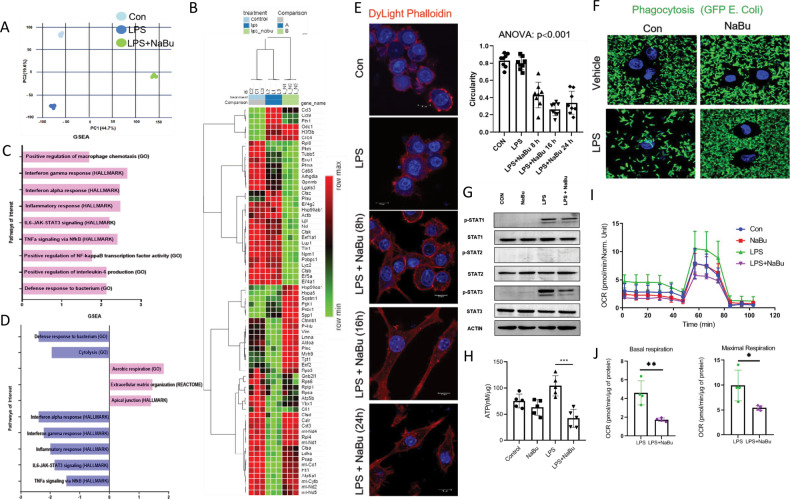
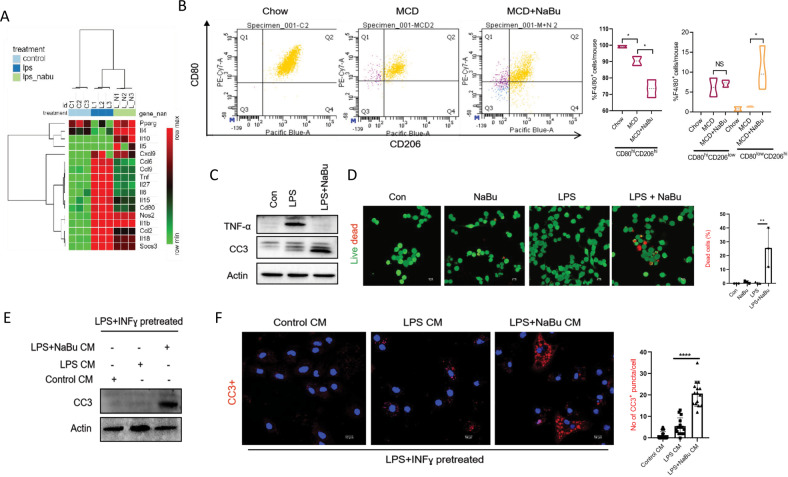
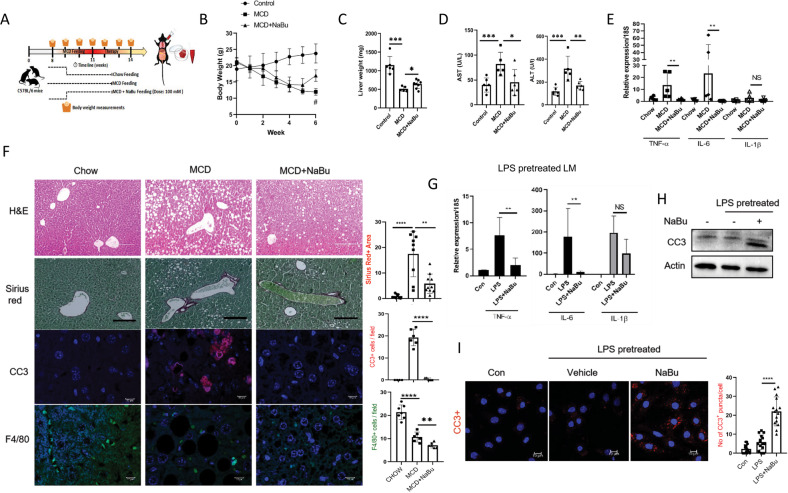
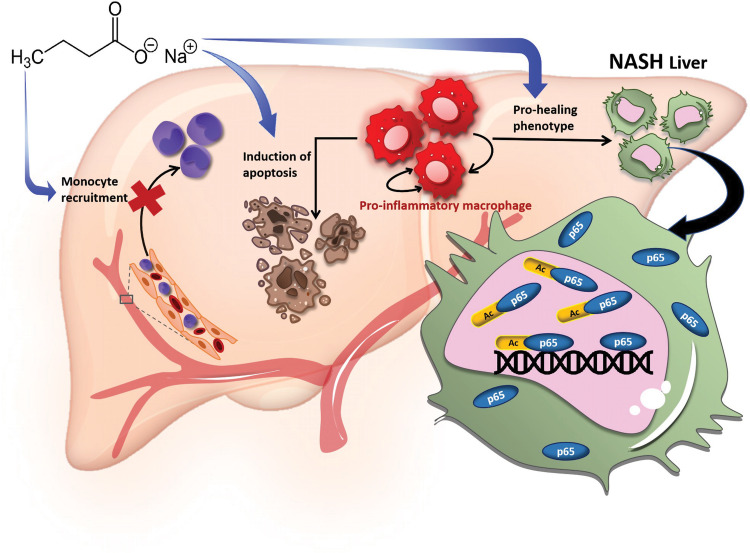
Immune cell infiltrations with lobular inflammation in the background of steatosis and deregulated gut-liver axis are the cardinal features of non-alcoholic steatohepatitis (NASH). An array of gut microbiota-derived metabolites including short-chain fatty acids (SCFA) multifariously modulates NASH pathogenesis. However, the molecular basis for the favorable impact of sodium butyrate (NaBu), a gut microbiota-derived SCFA, on the immunometabolic homeostasis in NASH remains elusive. We show that NaBu imparts a robust anti-inflammatory effect in lipopolysaccharide (LPS) stimulated or classically activated M1 polarized macrophages and in the diet-induced murine NASH model. Moreover, it impedes monocyte-derived inflammatory macrophage recruitment in liver parenchyma and induces apoptosis of proinflammatory liver macrophages (LM) in NASH livers. Mechanistically, by histone deactylase (HDAC) inhibition NaBu enhanced acetylation of canonical NF-κB subunit p65 along with its differential recruitment to the proinflammatory gene promoters independent of its nuclear translocation. NaBu-treated macrophages thus exhibit transcriptomic signatures that corroborate with a M2-like prohealing phenotype. NaBu quelled LPS-mediated catabolism and phagocytosis of macrophages, exhibited a differential secretome which consequently resulted in skewing toward prohealing phenotype and induced death of proinflammatory macrophages to abrogate metaflammation in vitro and in vivo. Thus NaBu could be a potential therapeutic as well as preventive agent in mitigating NASH.


Conflict of interest statement

The authors declare no competing interests.

Figures

Fig. 1
Fig. 1. NaBu attenuates LM activation in NASH.
AC Isolated murine LMs were pretreated with NaBu (3 mM) for 30 min followed by LPS (1 μg/ml) stimulation for 4 h. Gene expressions were determined by qPCR and normalized to 18S (A); Expression of TNF-α was assessed by immunoblotting (B); Culture supernatants were analyzed for the presence of TNF-α and IL-6 by ELISA (C). D Inflammasome activation was induced in isolated LMs with dual stimulation of LPS (1 μg/ml) for 4 h followed by ATP (5 mM) for 30 min and supernatants were analyzed for the presence of cleaved IL-1β by immunoblotting. EG Mice were fed with MCD diet for 2 weeks with simultaneous oral gavage of NaBu (100 mg/kg body weight) [n = 6 for each group]. Staining of liver sections with hematoxylin and eosin (scale bars: 200 μm) of chow fed control (left), MCD fed (middle), and MCD+NaBu group (right) of mice (E). TNF-α expression in liver lysates of treatment groups analyzed by immunoblotting (left) and relative band intensities of TNF-α (right) (F). qPCR for gene expression (G). H Flow cytometric analysis of isolated non-parenchymal fraction from mice liver gated for CD45+ cells. Two distinct populations identified as F4/80high CD11blow (P5) and F4/80low CD11bhigh (P4) as resident and recruited population of macrophages, respectively. Values were presented as mean ± SD, *P < 0.05; **P < 0.01; NS, not significant.
Fig. 2
Fig. 2. NaBu suppresses LPS-induced macrophage activation and polarization.
AC Isolated murine BMDMs were pretreated with NaBu (3 mM) for 30 min followed by LPS (1 μg/ml) stimulation for 4 h. Gene expressions were normalized to 18S (A). Supernatants of aforementioned treatment conditions were analyzed for the presence of TNF-α and IL-6 by ELISA (B). Expression of TNF-α was assessed by immunoblotting (C). D, E Gene expressions in NaBu pretreated M1 polarized (LPS, 1 μg/ml; IFN-γ, 50 ng/ml) BMDM (D) and TNF-α protein levels by immunoblotting RAW264.7 (E). F qPCR analysis for mentioned genes in IL-4 and IL-13 stimulated BMDM and gene expression was normalized to 18S. G Immunoblot of TNF-α in M2 polarized LM. Values were presented as mean ± SD, *P < 0.05; **P < 0.01; NS, not significant.
Fig. 3
Fig. 3. NaBu augments p65 acetylation and its chromatin recruitment.
A RAW264.7 cells were pretreated with NaBu (3 mM) for 30 min followed LPS (1 μg/ml) stimulation for 4 h and canonical NF-κB pathway was analyzed by immunoblotting via for the expressions of phospho-p65, p65, p-IKKα/β, IKKβ, IKKα, p-IκBα, IκBα. B Nuclear localization of p65 was assessed by immunofluorescence staining of p65 in LPS-stimulated RAW264.7 cells with and without pretreated NaBu and images were taken by using confocal microscopy (scale bars, 10 μm). C LPS stimulated RAW264.7 cells pretreated with NaBu for 30 min, p65 and phospho-p65 expressions were analyzed by immunoblotting in fractionated nuclear extracts. D, E Expression of acetylated p65 in control, LPS, and LPS+NaBu RAW264.7 cells by immunoblotting (IB, immunoblot; IP, immunoprecipitation). F Expression levels of acetylated p65 in isolated non-parenchymal fraction of liver from Chow fed, MCD fed, and MCD+NaBu fed mice (left). Relative band intensities of acetylated p65 (n = 3, right). G Venn diagram showing overlapped promoter recruitment site of p65 between LPS and LPS+NaBu treated ChIPseq data. H Volcano plot showing the p65 promoter recruitment status of LPS and LPS+NaBu treated RAW264.7 cells (FDR < 0.05). I Representation of ChIP enrichment analysis and the upregulated pathways with gene sets of Gene Ontology Biological Process of LPS and LPS+NaBu treated RAW264.7 cells.
Fig. 4
Fig. 4. NaBu rewires transcriptional landscape and skews macrophages toward prohealing phenotype.
A PCA analysis of the RNA seq data of control, LPS, and LPS+NaBu treated RAW264.7 cells. B Heat map of the differentially expressed genes identified from RNA seq data of control, LPS, and LPS+NaBu treated cells. C GSEA of different pathway databases of Control vs. LPS RNA seq data. Pink bars indicating upregulated pathways. D GSEA of different pathway databases of LPS vs. LPS+NaBu, pink bars represented upregulated and blue bars represented the downregulated pathways. E DyLight Phalloidin staining of NaBu pretreated, LPS-activated RAW264.7 cells for various time points (8, 16, 24 h) [Scale bars, 10 μm]. Quantification of cellular circularity (right). F Phagocytosis assay, GFP-tagged E. coli were incubated with NaBu pretreated LPS stimulated RAW264.7 cells for 3 h followed by images were taken by confocal microscopy [Scale bars, 10 μm]. G Expressions of STAT1, p-STAT1, STAT2, p-STAT2, STAT3, and p-STAT3 in NaBu treated (3 mM) followed by LPS-activated RAW264.7 cells. H ATP levels determined in NaBu pretreated LPS stimulated RAW264.7 cells. I, J Oxygen consumption rate (OCR) measured under basal and maximal state (FCCP, 2.5 μg) and normalized with total protein concentration. Values were presented as mean ± SD, *P < 0.05; **P < 0.01; ***P < 0.001.
Fig. 5
Fig. 5. NaBu induces apoptosis of proinflammatory macrophages.
A Heat map of selected M1- and M2-like genes from RNA seq data. B Flow cytometric analysis of isolated non-parenchymal fraction from Chow fed, MCD fed, NaBu gavaged MCD fed mice liver and gated for all F4/80+ cells followed by CD80hiCD206low (M1 like) and CD80lowCD206hi (M2 like) populations (left); Statistical summary of flow cytometry data (right, n = 4). C Expression of TNF-α and cleaved caspase 3 by immunoblotting pretreated with NaBu followed by LPS stimulation with total incubation of 8 h in RAW264.7 cells. D Apoptosis was assessed by Live/Dead assay in RAW264.7 cells pretreated with NaBu followed by LPS stimulation (left). Quantification of % of dead cells (right). E, F Expression of CC3 by immunoblotting (E) and immunofluorescence microscopy (F) in LMs stimulated with LPS (1 μg/ml) and IFN-γ (50 ng/ml) for 16 h followed by treatment with conditioned media of control, LPS, and LPS+NaBu treated LMs for 10 h. Values were presented as mean ± SD, *P < 0.05; **P < 0.01; ***P < 0.001; ****P < 0.0001; NS, not significant.
Fig. 6
Fig. 6. NaBu treatment reverses hallmarks of NASH.
AF Wild-type mice fed with either chow diet or with MCD diet for 3 weeks. MCD diet fed mice were randomly distributed into two groups followed by ad libitum NaBu (100 mM in drinking water) given as therapy for 3 weeks (n = 6/group). Schematic representation of in vivo therapeutic study (A). Body weight over the entire period of experimental regimen; #P < 0.05 (B). Liver weight (C) and serum AST and ALT (D). qPCR analysis for mentioned genes from liver and gene expression normalized to 18S (E). H&E, sirius red, IF staining of cleaved caspase 3 and F4/80 of liver sections (left) (H&E, sirius red, scale bars: 200 μm); Quantifications of sirius red area, CC3+ cells and F4/80 positive cells (right) (F). GI LMs stimulated with LPS for 16 h followed by NaBu treatment for 8 h. qPCR analysis for mentioned genes normalized to 18S (G), expression of CC3 via immunoblotting (H), and expression of CC3 via immunofluorescence microscopy (left), quantification of CC3+ puncta per cell (right) (I). Values were presented as mean ± SD, *P < 0.05; **P < 0.01; ***P < 0.001; ****P < 0.0001; ns, not significant.
Fig. 7
Fig. 7. Schematic of the mechanism of NaBu in amelioration of NASH.
NaBu ameliorated inflammatory insults of NASH by inhibiting proinflammatory macrophage infiltration, modulating polarization status as well as by inducing apoptosis of proinflammatory macrophages (blue arrows). The molecular mechanism of mitigated inflammatory response is hyperacetylation of p65 and its differential recruitment to proinflammatory gene promoters.

References

    1. Tripathi A, Debelius J, Brenner DA, Karin M, Loomba R, Schnabl B, et al. The gut–liver axis and the intersection with the microbiome. Nat Rev Gastroenterol Hepatol. 2018;15:397–411. doi: 10.1038/s41575-018-0011-z. - DOI - PMC - PubMed
    1. Wree A, Broderick L, Canbay A, Hoffman HM, Feldstein AE. From NAFLD to NASH to cirrhosis—new insights into disease mechanisms. Nat Rev Gastroenterol Hepatol. 2013;10:627–36. doi: 10.1038/nrgastro.2013.149. - DOI - PubMed
    1. Natividad JM, Agus A, Planchais J, Lamas B, Jarry AC, Martin R, et al. Impaired aryl-hydrocarbon receptor ligand production by the gut microbiota is a key factor in metabolic syndrome. Cell Metab. 2018;28:737–49. doi: 10.1016/j.cmet.2018.07.001. - DOI - PubMed
    1. Friedman SL, Neuschwander-Tetri BA, Rinella M, Sanyal AJ. Mechanisms of NAFLD development and therapeutic strategies. Nat Med. 2018;24:908–22. doi: 10.1038/s41591-018-0104-9. - DOI - PMC - PubMed
    1. Baffy G. Kupffer cells in non-alcoholic fatty liver disease: the emerging view. J Hepatol. 2009;51:212–23. doi: 10.1016/j.jhep.2009.03.008. - DOI - PMC - PubMed

Publication types