. 2023 May 18;14(5):329.
doi: 10.1038/s41419-023-05835-8.

Tunnelling nanotubes between neuronal and microglial cells allow bi-directional transfer of α-Synuclein and mitochondria

Affiliations

Tunnelling nanotubes between neuronal and microglial cells allow bi-directional transfer of α-Synuclein and mitochondria

Ranabir Chakraborty et al. Cell Death Dis. .

Abstract

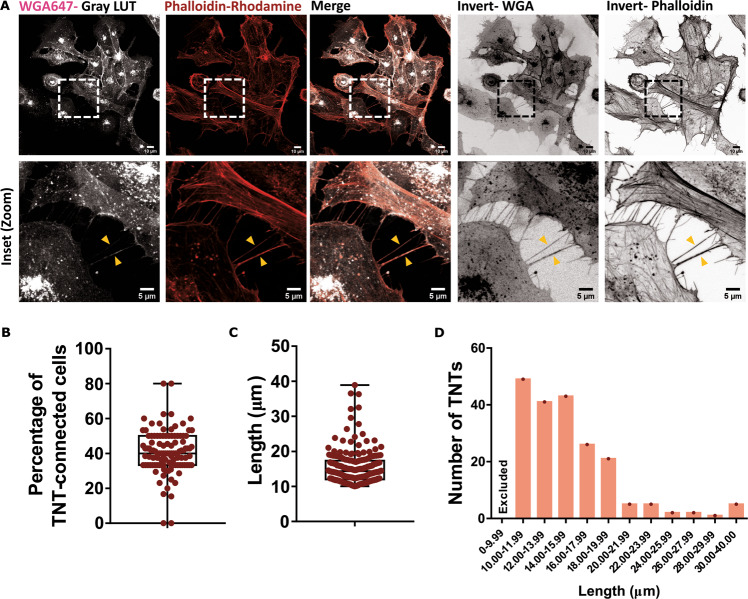
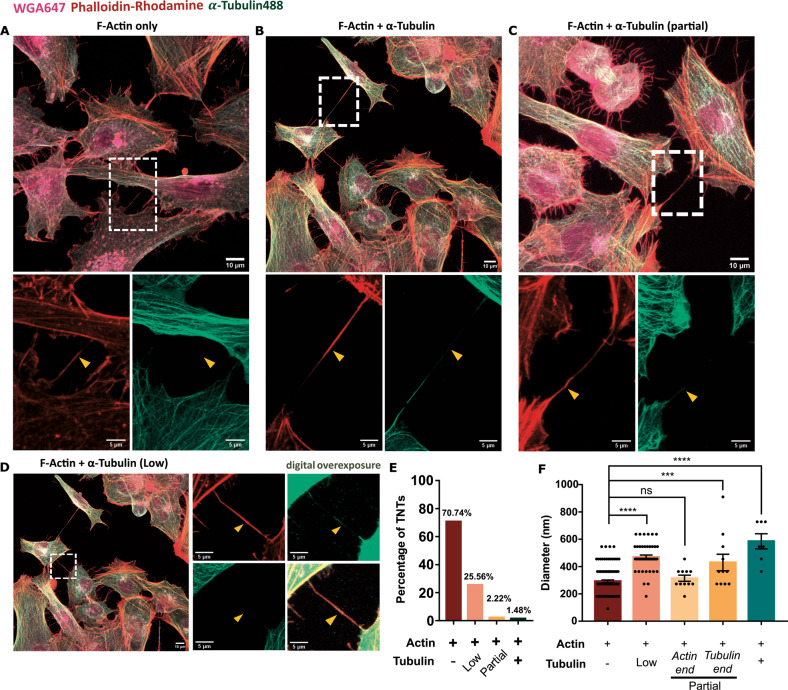
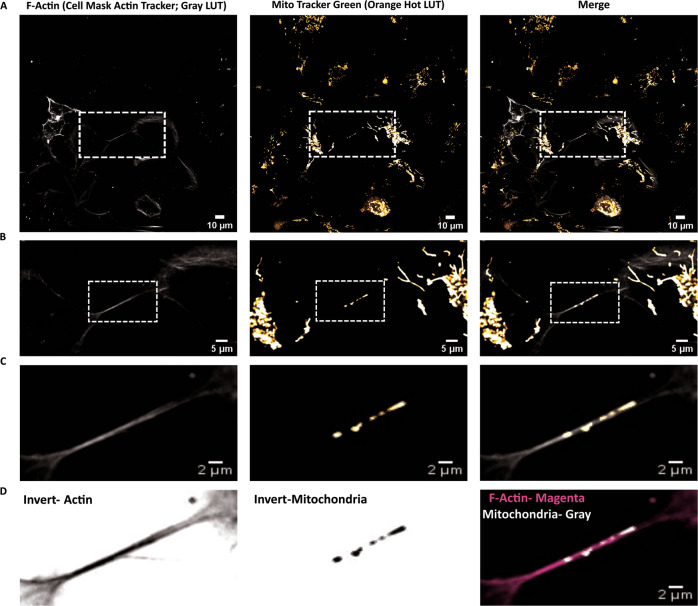
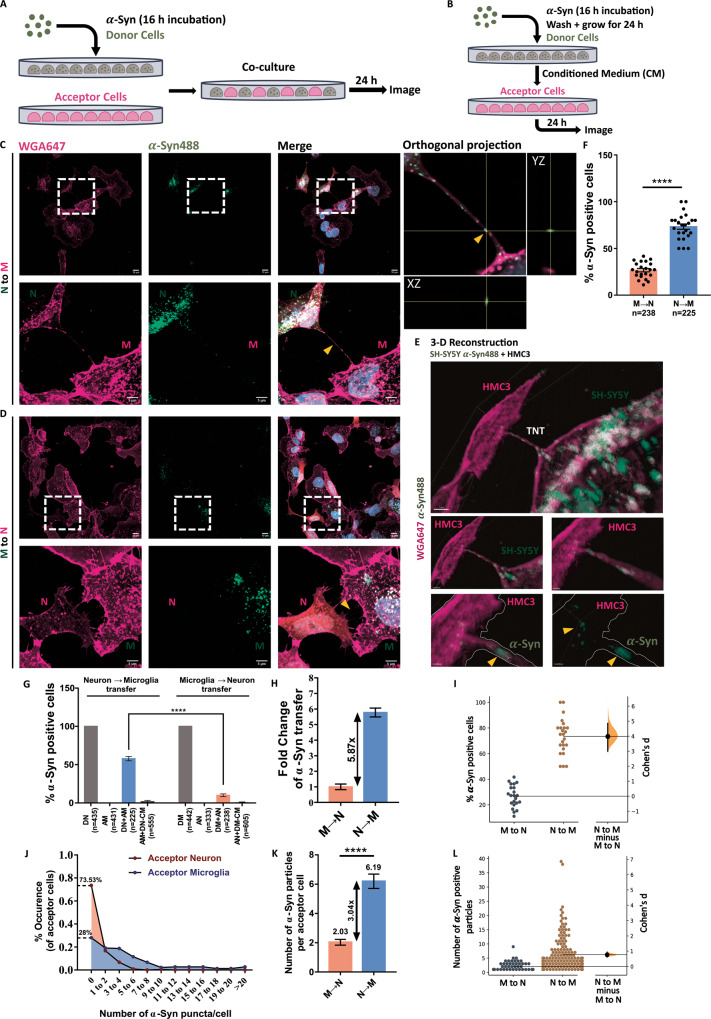
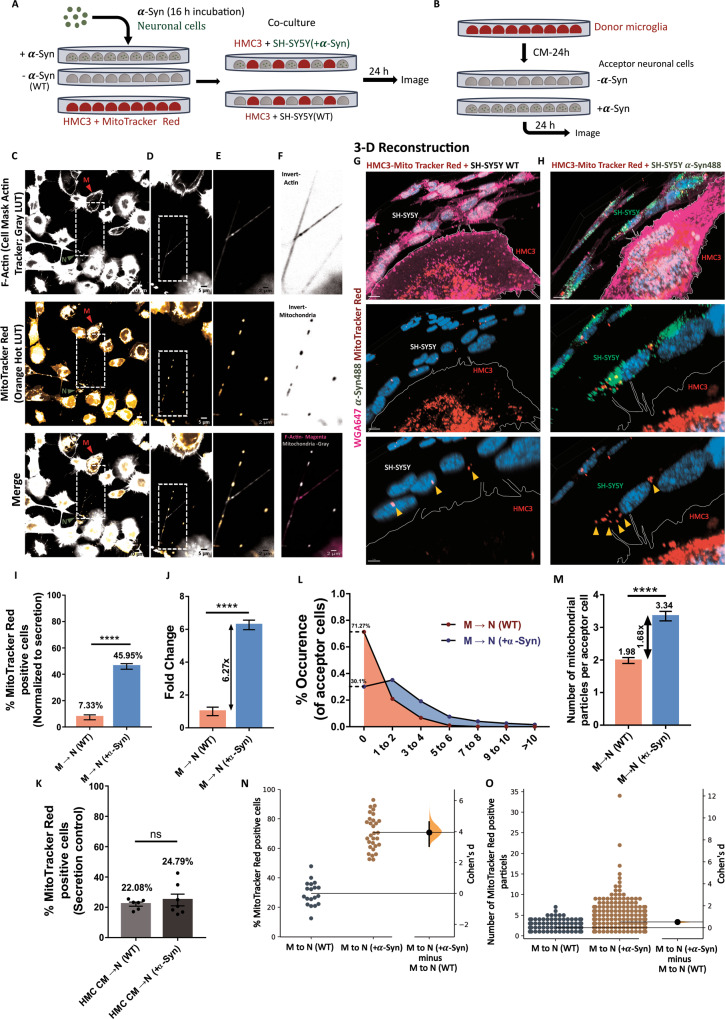
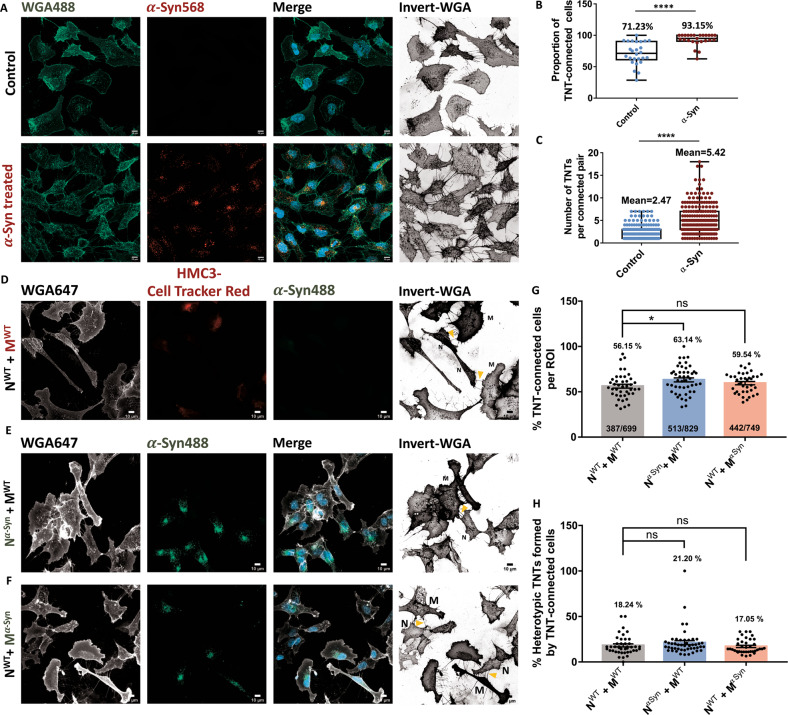
Tunnelling Nanotubes (TNTs) facilitate contact-mediated intercellular communication over long distances. Material transfer via TNTs can range from ions and intracellular organelles to protein aggregates and pathogens. Prion-like toxic protein aggregates accumulating in several neurodegenerative pathologies, such as Alzheimer's, Parkinson's, and Huntington's diseases, have been shown to spread via TNTs not only between neurons, but also between neurons-astrocytes, and neurons-pericytes, indicating the importance of TNTs in mediating neuron-glia interactions. TNT-like structures were also reported between microglia, however, their roles in neuron-microglia interaction remain elusive. In this work, we quantitatively characterise microglial TNTs and their cytoskeletal composition, and demonstrate that TNTs form between human neuronal and microglial cells. We show that α-Synuclein (α-Syn) aggregates increase the global TNT-mediated connectivity between cells, along with the number of TNT connections per cell pair. Homotypic TNTs formed between microglial cells, and heterotypic TNTs between neuronal and microglial cells are furthermore shown to be functional, allowing movement of both α-Syn and mitochondria. Quantitative analysis shows that α-Syn aggregates are transferred predominantly from neuronal to microglial cells, possibly as a mechanism to relieve the burden of accumulated aggregates. By contrast, microglia transfer mitochondria preferably to α-Syn burdened neuronal cells over the healthy ones, likely as a potential rescue mechanism. Besides describing novel TNT-mediated communication between neuronal and microglial cells, this work allows us to better understand the cellular mechanisms of spreading neurodegenerative diseases, shedding light on the role of microglia.


Conflict of interest statement

The authors declare no competing interests.

Figures

Fig. 1
Fig. 1. Tunnelling nanotubes are present between microglia.
A HMC3 microglia stained for membrane with wheat germ agglutinin (WGA, grey) and F-Actin with phalloidin (red). Bottom panel represents the zoomed region depicted with boxes in the upper panel. Yellow arrowheads point towards TNTs. B Proportion of TNT-connected cells under normal growing conditions (N = 3 independent experiments, n = 111 regions of interests). C Lengths of the TNTs observed. D Distribution of TNTs based on their lengths. Structures less than 10 μm were excluded from our analyses. N = 3 independent experiments, n = 200 TNTs for C, D.
Fig. 2
Fig. 2. Cytoskeletal composition of microglial TNTs.
AD Immunostaining for α-Tubulin (green) and subsequent staining for F-Actin with phalloidin rhodamine (red) and membrane with WGA647 (magenta). A TNT containing only F-Actin. B TNT containing both F-Actin and α-Tubulin. C TNT partially containing α-Tubulin. D TNT containing low level of α-Tubulin. Yellow arrowheads in (A-D) point towards the TNT. E Proportion of TNTs with diverse cytoskeletal compositions. N = 3 independent experiments, n = 270 TNTs. F Diameter of TNTs with different cytoskeletal compositions. N = 3 independent experiments, n = 173 TNTs analysed; One-Way ANOVA with Tukey’s post-hoc; ns: non-significant, ***p < 0.001, ****p < 0.0001. Error bars represent mean ± SEM.
Fig. 3
Fig. 3. Functional TNTs are formed between microglia.
A Single, middle stack image of microglial cells stained for F-Actin with cell mask deep red actin tracker (grey pseudo-coloured; left panels) and mitochondria with MitoTracker green(orange pseudo-coloured, middle panels). B Zoomed images from the ROIs boxed in A. C, D Zoomed images from the ROIs boxed in B. Image snapshots were acquired using Nikon Eclipse Ti2 spinning disk microscope. LUTs were created using FIJI.
Fig. 4
Fig. 4. Movement of α-Syn from SH-SY5Y to HMC3 cells via TNTs.
A Schematic representation of co-culture strategy used to assess for transfer. B Schematic representation of secretion control. C In a co-culture system, TNTs connect donor neuronal cells with acceptor microglia (N → M transfer). Lower panels are zoomed images of the ROI boxed in the upper panels. ‘N’ represents SH-SY5Y neuronal cells and ‘M’ represents HMC3 microglia. The yellow arrowhead in the orthogonal projection panel depicts α-Syn puncta inside TNT. D Co-culture of donor microglia with acceptor neuronal cells (M → N transfer) show the presence of TNTs between two cell types (lower panels), but without any α-Syn puncta within them (yellow arrowhead). E Imaris-based 3-D reconstruction of connected cells in C. F Proportion of acceptor cells positive for α-Syn puncta in a co-culture system. N = 3 independent experiments, n = 238 acceptor cells for M → N transfer and n = 225 acceptor cells for N → M transfer; Unpaired Student’s t-test; ****p < 0.0001. G Compiled representation of α-Syn transfers between both cell types, normalised for secretion control; One-Way ANOVA with Tukey’s post-hoc; ****p < 0.0001. H Fold-change difference between the two groups (M → N and N → M transfers) indicate a 5.87-times increase in the movement of α-Syn from neuronal cells to microglia. I Estimation statistics plot corresponding to F. J Distribution pattern of the number of α-Syn puncta transfer in acceptor cells. Higher value for “0” is indicative of more instances of no transfer. K Average number of α-Syn particles per acceptor cell. N = 3 independent experiments, n = 59 SH-SY5Y acceptor cells for M → N transfer and n = 160 HMC3 acceptor cells for N → M transfer; Unpaired Student’s t-test, ****p < 0.0001 L. Estimation statistics plot to correspond to K. Error bars represent mean ± SEM.
Fig. 5
Fig. 5. Movement of mitochondria from HMC3 to SH-SY5Y cells.
A Schematic representation of the co-culture strategy used to assess transfer. B Schematic representation of secretion control. CF Single, middle stack images of neuron-microglia co-culture stained for F-Actin with cell mask deep red actin tracker (grey pseudo-coloured, upper panels) and mitochondria with MitoTracker red (orange pseudo-coloured, middle panels). White, dashed boxes indicate the ROI for zoomed images. Images were acquired using Nikon Eclipse Ti2 spinning disk microscope (also see Fig. S4). LUTs were created using FIJI. ‘N’ represents SH-SY5Y neuronal cell, indicated with green arrowhead, and ‘M’ represents HMC3 microglia, indicated with red arrowhead. G, H Imaris-based 3-D reconstruction of microglia-derived mitochondrial particles in SH-SY5Y acceptor cells with α-Syn aggregates H, or without them G. Yellow arrowheads point towards mitochondrial particles inside SH-SY5Y cells. I Proportion of healthy- M → N (WT) and unhealthy- M → N ( + α-Syn) acceptor cells positive for mitochondrial particles. N = 3 independent experiments, n = 630 healthy (WT) acceptors and n = 638 unhealthy (+α-Syn) acceptors; unpaired Student’s t-test, ****p < 0.0001. J Fold change of difference between the two acceptor populations in receiving mitochondrial particles from microglia depict a 6.27-times increase for unhealthy neuronal acceptor population, Unpaired Student’s t-test ****p < 0.0001. K Proportion of healthy- M → N (WT) and unhealthy- M → N ( + α-Syn) acceptor cells positive for mitochondrial particles in secretion control. N = 3 independent experiments, n = 634 healthy (WT) acceptor cells and n = 605 unhealthy (+α-Syn) acceptor cells; Unpaired Student’s t-test; ns: non-significant. L Distribution pattern of the number of mitochondrial puncta transfer in acceptor cells. Higher value for “0” is indicative of more instances of no transfer. (M) Average number of mitochondrial particles in acceptor neuronal cells. N = 3 independent experiments, n = 181 for healthy (WT) acceptors and n = 446 for unhealthy (+α-Syn) acceptors. N, O Estimation statistics plots corresponding to un-normalised transfer in I and M respectively. Error bars represent mean ± SEM.
Fig. 6
Fig. 6. α-Syn exposure increases homotypic TNTs between HMC3 microglia, but not heterotypic TNTs between SH-SY5Y neuronal cells and HMC3 microglia.
A Microglia stained for membrane (WGA, green) depicts increased global connectivity between cells in the presence of α-Syn (lower panels), as compared to the control group (upper panels). B Proportion of TNT-connected cells. N = 3 independent experiments, n = 252 cells for control group, n = 345 cells for α-Syn group; Unpaired Student’s t-test; ****p < 0.0001. C The average number of TNTs between connected pairs; N = 3 independent experiments, n = 172 connected pairs for control group, n = 200 connected pairs for α-Syn group; Unpaired Student’s t-test; ****p < 0.0001. D Co-culture of WT SH-SY5Y neuronal cells (N) with HMC3 microglia loaded with cell tracker red (M). Yellow arrowheads point towards heterotypic TNTs connecting the two cell types. E Co-culture of SH-SY5Y cells loaded with α-Syn (N) and WT HMC3 microglia (M). Yellow arrowheads point towards heterotypic TNTs. F Co-culture of WT SH-SY5Y cells N and HMC3 microglia loaded with α-Syn (M). Yellow arrowheads point towards heterotypic TNTs. G The proportion of TNT-connected cells in the field of view. N = 3 independent experiments, numbers of cells analysed per group mentioned within the respective bar graphs; One-Way ANOVA with Tukey’s post-hoc, ns: non-significant, *p < 0.05. H Proportion of TNTs in G that are heterotypic. N = 3 independent experiments, n = same as G; One-Way ANOVA with Tukey’s post-hoc, ns: non-significant. Error bars represent mean ± SEM.

Similar articles

Cited by

References

    1. Ross CA, Poirier MA. Protein aggregation and neurodegenerative disease. Nat Med. 2004;10:S10–7. doi: 10.1038/nm1066. - DOI - PubMed
    1. Menzies FM, Fleming A, Caricasole A, Bento CF, Andrews SP, Ashkenazi A, et al. Autophagy and neurodegeneration: pathogenic mechanisms and therapeutic opportunities. Neuron. 2017;93:1015–34. doi: 10.1016/j.neuron.2017.01.022. - DOI - PubMed
    1. Tanaka K, Matsuda N. Proteostasis and neurodegeneration: the roles of proteasomal degradation and autophagy. Biochimica et Biophysica Acta. 2014;1843:197–204. doi: 10.1016/j.bbamcr.2013.03.012. - DOI - PubMed
    1. Wyss-Coray T, Mucke L. Inflammation in neurodegenerative disease—a double-edged sword. Neuron. 2002;35:419–32. doi: 10.1016/S0896-6273(02)00794-8. - DOI - PubMed
    1. Kempuraj D, Thangavel R, Natteru P, Selvakumar G, Saeed D, Zahoor H, et al. Neuroinflammation induces neurodegeneration. J Neurol Neurosurg Spine. 2016;1:1003. - PMC - PubMed

Publication types