. 2023 May 18;14(1):2836.
doi: 10.1038/s41467-023-37833-x.

Identification of age-specific gene regulators of La Crosse virus neuroinvasion and pathogenesis

Affiliations

Identification of age-specific gene regulators of La Crosse virus neuroinvasion and pathogenesis

Rahul Basu et al. Nat Commun. .

Abstract

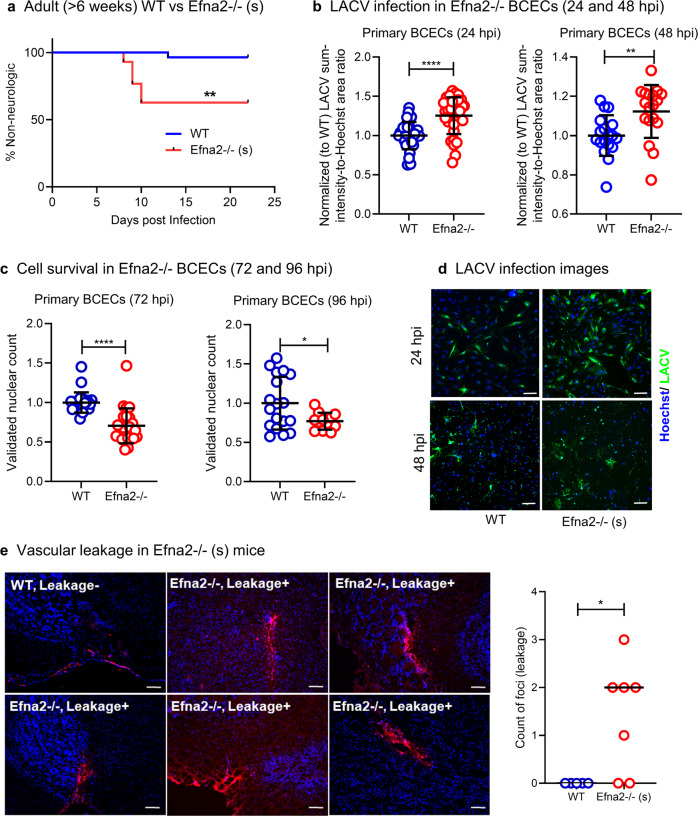
One of the key events in viral encephalitis is the ability of virus to enter the central nervous system (CNS). Several encephalitic viruses, including La Crosse Virus (LACV), primarily induce encephalitis in children, but not adults. This phenomenon is also observed in LACV mouse models, where the virus gains access to the CNS of weanling animals through vascular leakage of brain microvessels, likely through brain capillary endothelial cells (BCECs). To examine age and region-specific regulatory factors of vascular leakage, we used genome-wide transcriptomics and targeted siRNA screening to identify genes whose suppression affected viral pathogenesis in BCECs. Further analysis of two of these gene products, Connexin43 (Cx43/Gja1) and EphrinA2 (Efna2), showed a substantial effect on LACV pathogenesis. Induction of Cx43 by 4-phenylbutyric acid (4-PBA) inhibited neurological disease in weanling mice, while Efna2 deficiency increased disease in adult mice. Thus, we show that Efna2 and Cx43 expressed by BCECs are key mediators of LACV-induced neuroinvasion and neurological disease.


Conflict of interest statement

The authors declare no competing interests.

Figures

Fig. 1
Fig. 1. RNA-seq analyses and validation of target genes ex vivo.
a Sequential approach to select target genes from RNA-seq analyses on vehicle (V) or Poly I:C (PI)-treated weanling (W) or adult (A) mice (WV, WPI, AV, and API). b Identification of target genes from RNA-seq analyses of microvessel fragments from olfactory bulb (OB) and cortex (CT) regions of weanling LACV infected (LOB and LCT) and mock inoculated mice (MOB and MCT) (N = 3 for all RNA-seq samples). The default DESeq function with betaPrior = FALSE was applied, wherein a negative binomial generalized model with Wald test for significance was performed. The two-sided p-values were corrected for multiple testing using the Benjamini Hochberg method. ce Differential expression of representative genes, as validated by real-time PCR analyses on ex vivo isolated microvessel fragments from weanling mock (WM), weanling LACV (WL), adult mock (AM) and adult LACV (AL) infected mice. Gene categories: (c) intrinsic adult-specific (for Efna2 and H2q6 WM vs AM P = 0.0032 and P = 0.0001 and WL vs AL P = 0.0002 and P = 0.0356), d intrinsic weanling-specific (for Bst1 and Mmp25 WM vs AM P < 0.0001 and P = 0.1010 and WL vs AL P < 0.0001 and P = 0.4684) or (e) LACV-infection induced, adult enhanced genes (for Clec4e and Cldn1 WM vs AM P = 0.0453 and P = 0.0894 and WL vs AL 0.6490 and P = 0.5686). f Differential expression of representative genes from OB and CT microvessel fragments obtained from LACV-infected adults (AOB and ACT) and weanlings (WOB and WCT). P = 0.0043 and P = 0.0068 for Aqp1 and Ttr for WOB vs WCT comparison and P = 0.0417 and P < < 0.0001 for Aqp1 and Ttr for AOB vs ACT comparison. The data in (cf) were transformed to log2 scale for a more normal distribution and the datapoints were statistically analyzed or plotted post-transformation. Significance values were measured by one-way ANOVA followed by Tukey’s multiple comparison (ce) or two-tailed, multiple unpaired t-tests (f) (N = 5–6 for all mouse experiments, from Panel cf and individual datapoints are shown). (*P < 0.05, **P < 0.01, ***P < 0.001 and ****P < 0.0001).
Fig. 2
Fig. 2. Identification of putative host restriction and susceptibility factors in LACV infection through targeted siRNA screening.
bEnd.3 cells were transfected with 50 nM siRNA against the indicated target genes (for 72 h), along with viral upregulation control (i.e., si-Ifnar1 and Ifnar2, abbreviated as si-Upreg. Control), downregulation control (i.e., si-Cltc and Rab5a, abbreviated as si-Downreg. Control), non-targeting (si-NT, dotted line) and cell death (si-Lethal) controls where indicated. a, b Analyses of degree of infection (10 MOI of LACV) normalized to si-NT (LACV sum-intensity-to-Hoechst area ratio) at 6 (a) and 24 hpi (b). c Analyses of cell survival (nuclear count) at 72 hpi. The first bar represents the average of 2 independent gene-specific siRNA, whereas the next two bars represent siRNA#1 and #2 for each gene (mean ± SD, N = 3 each individual siRNA). Putative hit genes are color-matched across the different graphs.
Fig. 3
Fig. 3. Validation of gene hits in primary culture and analyses of their effect on viral life cycle.
a, b Adult (a) and weanling (b) primary BCECs were transfected with 50 nM siRNA for 72 h against the indicated Group1 hit genes (mainly restriction factors) and LACV infection (LACV sum-intensity-to-Hoechst area ratio) was assessed (N = 6 and individual datapoints are shown) Here, P = 0.0162, 0.0085, 0.0153, 0.0830, 0.0394, 0.0636, 0.0231 and 0.0271 in (a) and P = 0.6571, 0.9010, 0.0960, 0.1548, 0.9290, 0.0354, 0.0649 and <0.0001 in (b) for si-Bst1, si-Efna2, si-H2q6, si-Clec4e, si-Gja1, si-Ifitm3, si-Ly6c2 and si-Upreg. control vs si-NT, respectively. c LACV attachment/ entry assay in bEnd.3 cells transfected with 50 nM of the indicated gene specific and control siRNAs for 72 h and infected with 10 MOI of LACV for 24 h. d Representative images of LACV attachment/entry in Ifitm3 and Lyc2 siRNA perturbed bEnd.3 cells (green: LACV and blue: Hoechst) (N = 3 for c, d). Here, P = 0.0682, 0.0752, 0.9479, 0.3786, 0.3018, 0.0009, 0.0020 and 0.9574 in (c, left) and P = 0.0980, 0.9622, 0.6042, 0.4154, 0.9939, 0.0132, 0.0011 and 0.0294 in (c, right) for si-Bst1, si-Efna2, si-H2q6, si-Clec4e, si-Gja1, si-Ifitm3, si-Ly6c2 and si-Upreg. control vs si-NT, respectively. e Plaque assays (each dot = 1 sample) performed at 24 hpi in LACV-infected bEnd.3 cells transfected for 72 h with 50 nM of the indicated gene-specific siRNA. Here, P = 0.5075, 0.0030, 0.7566, 0.1347, 0.0120, 0.7941 and 0.0156 for si-Bst1, si-Efna2, si-H2q6, si-Clec4e, si-Gja1, si-Ifitm3 and si-Ly6c2 vs si-NT, respectively. f bEnd.3 cells were transfected with 50 nM of the indicated siRNA for 72 h, infected with 10 MOI LACV and confocal microscopy was used to image LACV infection (green), actin (red: phalloidin) and nuclei (blue: Hoechst). a, b Multiple, two-tailed paired t-tests and ce multiple, two-tailed unpaired t-tests between si-NT and the targeted genes were performed (*P < 0.05, **P < 0.01, ***P < 0.001 and ****P < 0.0001) and mean ± SD (3–6 samples per condition) are shown. d, f Images are representative of 25–75 independent fields. Scale bar = 100 um (white, for regular images), scale bar = 10 um (yellow, for zoomed in images).
Fig. 4
Fig. 4. Role of adult-specific higher expression of Efna2 in protecting BCEC from LACV infection.
a Effect of recombinant EFNA2 (2 ug/ml to 20 ug/ml) on LACV infection levels in weanling and adult BCECs at 24 and 72 hpi (N = 4–12 individual samples, data collected based on 25 images for each sample, P = 0.1654 and 0.0475 for 2 ug/ml and 20 ug/ml, compared to control, in weanling BCECs and P = 0.1068 and 0.0846 for 2 ug/ml and 20 ug/ml, compared to control, in adult BCECs). b Adult Efna2−/− (m), Efna2+/− (m) and WT mice were infected with 105 PFU LACV (IP) and the percentage of neurologic mice are shown. See Suppl. Table 3 for mixed Efna3/5 genotypes of Efna2−/− (m) and Efna2+/− (m) mice (N = 22 WT or Efna2+/− (m) mice and N = 18 Efna2−/− (m) mice, P = 0.0105). c LACV RNA levels in the brains of infected mice at 8–22 dpi (NC: nonclinical mice and C: clinical mice where N = 18 WT or Efna2+/− (m) NC mice, N = 2 WT or Efna2+/− (m) C mice, N = 10 Efna2−/− (m) NC mice and N = 8 Efna2−/− (m) C mice). Here, P = 0.0008 for both WT/ Efna2+/− (m) C and Efna2−/− (m) C, compared to WT/ Efna2+/− (m) NC control. d Vascular leakage as assessed by the measurement of viral RNA in LACV-infected Efna2−/− (m) and WT mice brains at 3 dpi (N = 8 mice brains regarding each condition analyzed). e Imaging to detect vascular leakage in brain slices from LACV-infected WT and Efna2−/− (m) mice at 3 dpi (arrow, FluoSphere beads: red, Hoechst: blue). Thick arrows represent localization of FluoSphere beads at CNS periphery in WT mice whereas the thin arrows represent leakage of FluoSphere beads into the brain parenchyma in Efna2−/− (m) mouse (1 out of 4 mice showed leakage, which is represented here). (a, one way ANOVA followed by post-hoc Dunnett’s test, b, Mantel-Cox log rank test and c, d multiple unpaired, two-tailed t-tests, *P < 0.05, **P < 0.01 and ***P < 0.001).Scale bar = 100 um.
Fig. 5
Fig. 5. Loss of Efna2 confers susceptibility in adult LACV-resistant mice.
a Comparison of LACV-induced (105 PFU/mouse dose (IP)) neurologic disease in adult WT and Efna2−/− mice. (*P < 0.05, ****P < 0.0001, Mantel-Cox log rank test, N = 28 WT mice and N = 43 Efna2−/− mice, P = 0.0013). b Comparative infection of BCECs after LACV infection (10 MOI) at 24 and 48 hpi on WT and Efna2−/− primary BCECs (N = 33 and N = 18 for WT and Efna2−/− BCECs, mean ± SD is shown, P < 0.0001 and P = 0.0041 for 24 and 48 hpi, respectively). c Comparative cell viability (validated nuclear count) of BCECs after LACV infection (10 MOI) at 72 and 96 hpi on WT and Efna2−/− primary BCECs (N = 24 and = 12-18 for WT and Efna2−/− BCECs, mean ± SD is shown, P < 0.0001 and P = 0.0304 for 72 and 96 hpi, respectively). All individual datapoints are shown and statistical significance analyzed by multiple, two-tailed unpaired t-tests, *P < 0.05, **P < 0.01, and ****P < 0.0001). d Representative images at 24 and 48 hpi comparing WT and Efna2−/− BCECs (Hoechst: Blue and LACV: green). Scale bar = 100 um (images are representative of 25 individual images/ sample). e One representative WT brain section (without any vascular leakage) is shown along with 5 Efna2−/− brain sections demonstrating vascular leakage (Hoechst: blue and FluoSphere beads: red and scale bar = 100 um) (N = 5 WT brains and N = 7 Efna2−/− brains, of which 5 brains showed probable foci of vascular leakage). The number of foci/ brains was compared using an unpaired t-test (P = 0.0195).
Fig. 6
Fig. 6. 4-PBA induced alteration of Cx43 (expressed by Gja1 mRNA) alters LACV induced vascular leakage and viral entry into weanling mice brain.
a, b LACV-infected (10 MOI) bEnd.3 cells, were treated with 4-PBA (0–10 mM) and at different hpi, imaged to measure (a) viral intensity or virus-induced cell depletion (N = 4 samples, data collected based on 25 images obtained from each sample and mean with SD is shown) or (b) localization of Cx43 (red), LACV (green) and Hoechst (blue) (representative of ~12–25 images obtained each condition, P = 0.1142, < 0.0001 and 0.0097 from PBA 2.5, 5and 10 mM, compared to PBA 0 mM). White arrows represent punctate staining of Cx43. c Western blot and densitometric analyses of Cx43 protein levels in 4-PBA treated bEnd.3 cells. Gapdh is a loading control and normalization factor for quantitation (N = 3 each condition and mean with SD is shown, P = 0.7647, 0.0043 and 0.4589 for PBA 2.5, 5 and 10 mM those are compared to PBA 0 mM). d Weanling mice, infected with 2000 PFU of LACV, were treated with vehicle (LV) or 500 mg/kg-day 4-PBA (LP) until 5 dpi and assessed for neurologic endpoint (N = 9 mice for each condition, P = 0.0074). e Effect of 4-PBA treatment on the correlation between LACV and Gja1 expression in mouse brains at 3 dpi (N = 9 LV and N = 11 LP brain RNA samples obtained from mice, P = 0.0311 and 0.0147 for LACV and Gja1 comparison). f Effect of 4-PBA on entry and localization of LACV as assessed by confocal imaging of mouse brain slices at 4 dpi (red: ZO1, green: LACV, blue: Hoechst/nuclei). (a) two-way ANOVA followed by Dunnett’s test and all groups were compared with vehicle for same time pi, (b) one-way ANOVA followed by Dunnett’s test, individual points represent separate imaging fields, (c) multiple, two-tailed unpaired t-tests, d Mantel-Cox log rank test and e, two-tailed unpaired t-test where *P < 0.05, **P < 0.01, ***P < 0.001 and ****P < 0.0001 and N = 3–4 for each experiment. Scale bar = 100 um (white, for regular images), scale bar = 10 um (yellow, for zoomed in images).

Similar articles

Cited by

References

    1. Bennett RS, et al. La Crosse virus infectivity, pathogenesis, and immunogenicity in mice and monkeys. Virol. J. 2008;5:25. doi: 10.1186/1743-422X-5-25. - DOI - PMC - PubMed
    1. McJunkin JE, et al. La Crosse encephalitis in children. N. Engl. J. Med. 2001;344:801–807. doi: 10.1056/NEJM200103153441103. - DOI - PubMed
    1. Taylor KG, et al. Age-dependent myeloid dendritic cell responses mediate resistance to la crosse virus-induced neurological disease. J. Virol. 2014;88:11070–11079. doi: 10.1128/JVI.01866-14. - DOI - PMC - PubMed
    1. Dando SJ, et al. Pathogens penetrating the central nervous system: Infection pathways and the cellular and molecular mechanisms of invasion. Clin. Microbiol. Rev. 2014;27:691–726. doi: 10.1128/CMR.00118-13. - DOI - PMC - PubMed
    1. Franke WW. Discovering the molecular components of intercellular junctions-a historical view. Cold Spring Harb. Perspect. Biol. 2009;1:a003061. doi: 10.1101/cshperspect.a003061. - DOI - PMC - PubMed

Publication types