. 2023 May 18;14(1):2852.
doi: 10.1038/s41467-023-38247-5.

Demonstrating multi-round subsystem quantum error correction using matching and maximum likelihood decoders

Affiliations

Demonstrating multi-round subsystem quantum error correction using matching and maximum likelihood decoders

Neereja Sundaresan et al. Nat Commun. .

Abstract

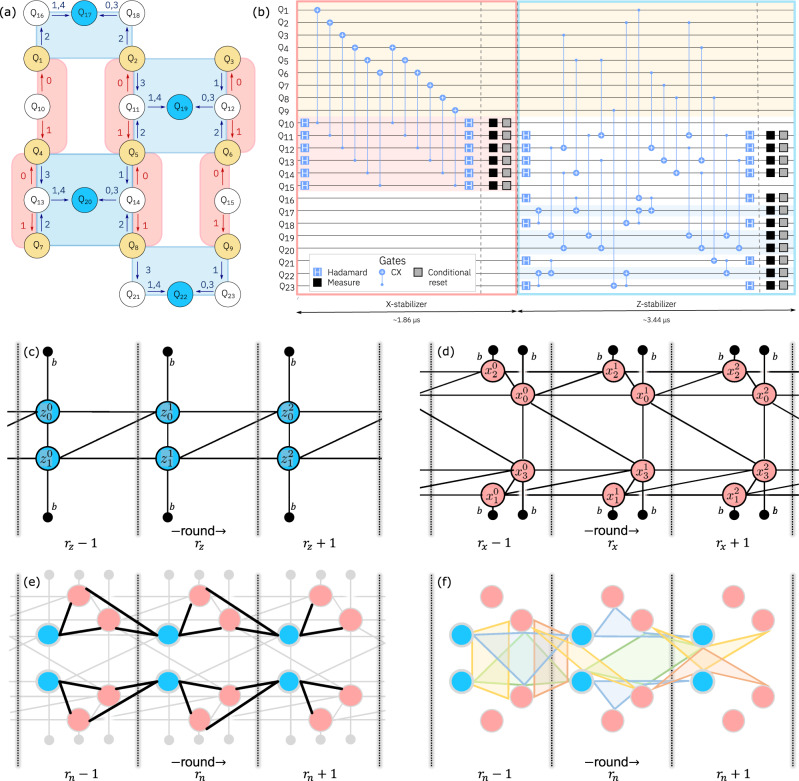
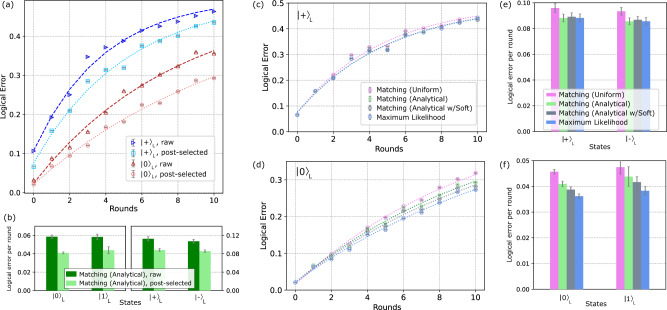
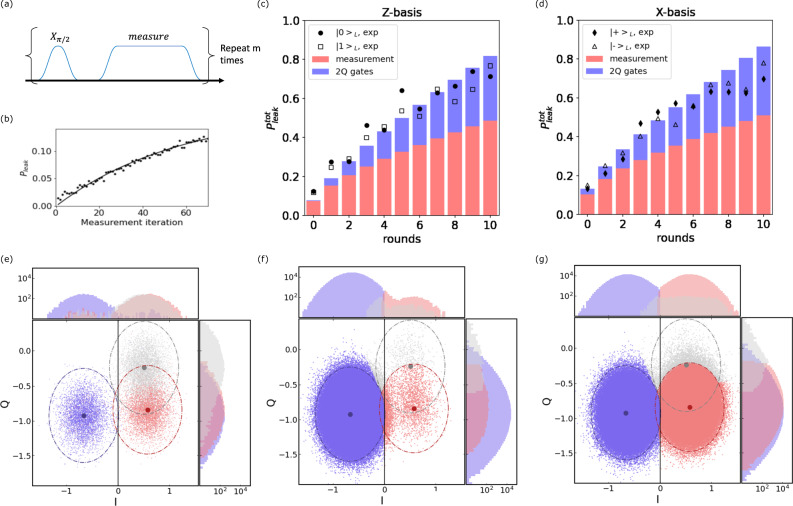
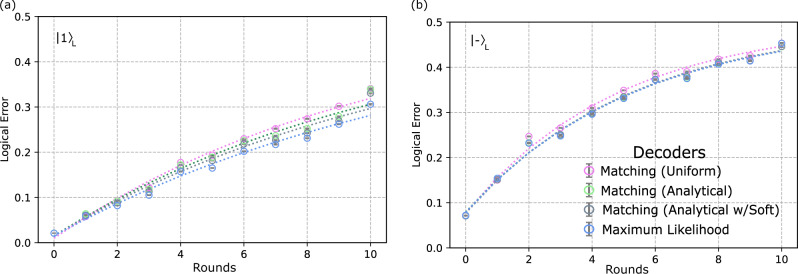
Quantum error correction offers a promising path for performing high fidelity quantum computations. Although fully fault-tolerant executions of algorithms remain unrealized, recent improvements in control electronics and quantum hardware enable increasingly advanced demonstrations of the necessary operations for error correction. Here, we perform quantum error correction on superconducting qubits connected in a heavy-hexagon lattice. We encode a logical qubit with distance three and perform several rounds of fault-tolerant syndrome measurements that allow for the correction of any single fault in the circuitry. Using real-time feedback, we reset syndrome and flag qubits conditionally after each syndrome extraction cycle. We report decoder dependent logical error, with average logical error per syndrome measurement in Z(X)-basis of ~0.040 (~0.088) and ~0.037 (~0.087) for matching and maximum likelihood decoders, respectively, on leakage post-selected data.


Conflict of interest statement

The authors declare no competing interests.

Figures

Fig. 1
Fig. 1. Heavy-hexagon code.
a Z (blue) and X (red) gauge operators (eqs. (1) and (2)) mapped onto the 23 qubits required with the distance-3 heavy-hexagon code. Code qubits (Q1 − Q9) are shown in yellow, syndrome qubits (Q17, Q19, Q20, Q22) used for Z stabilizers in blue, and flag qubits and syndromes used in X stabilizers in white. The order and direction that CX gates are applied within each sub-section (0 to 4) are denoted by the numbered arrows. b Circuit diagram of one syndrome measurement round, including both X and Z stabilizers. The circuit diagram illustrates permitted parallelization of gate operations: those within the bounds set by scheduling barriers (vertical dashed gray lines). As each two-qubit gate duration differs, the final gate scheduling is determined with a standard as-late-as-possible circuit transpilation pass; after which dynamical decoupling is added to data qubits where time permits. Measurement and reset operations are isolated from other gate operations by barriers to allow for uniform dynamical decoupling to be added to idling data qubits. Decoding graphs for three rounds of (c) Z and (d) X stabilizer measurements with circuit-level noise allow correction of X and Z errors, respectively. The blue and red nodes in the graphs correspond to difference syndromes, while the black nodes are the boundary. Edges encode various ways errors can occur in the circuit as described in the text. Nodes are labeled by the type of stabilizer measurement (Z or X), along with a subscripts indexing the stabilizer, and superscripts denoting the round. e Black edges, arising from Pauli Y errors on code qubits (and so are just size-2), connect the two graphs in c and d, but are not used in the matching decoder. f The size-4 hyperedges, which are not used by matching, but are used in the maximum likelihood decoder. Colors are just for clarity. Translating each in time by one round also gives a valid hyperedge (with some variation at the time boundaries). Also not shown are any of the size-3 hyperedges.
Fig. 2
Fig. 2. Logical error results.
a Logical error versus number of syndrome measurement rounds r, where one round includes both a Z and an X stabilizer measurement. Blue right-pointing triangles (red triangles) mark logical errors obtained from using matching analytical decoding on raw experimental data for +L (0L) states. Light blue squares (light red circles) mark those for +L (0L) with the same decoding method but using leakage-post-selected experimental data. Error bars denote sampling error of each run (500,000 shots for raw data, variable number of shots for post-selected). Dashed line fits of error yield error per round plotted in b. b Applying the same decoding method on leakage-post-selected data, shows substantial reduction in overall error for all four logical states. See Methods “Post-selection method” for details on post-selection. Fitted rejection rate per round for 0L, 1L, +L, L are 4.91%, 4.64%, 4.37%, and 4.89%, respectively. Error bars denote one standard deviation on the fitted rate. c, d Using post-selected data, we compare logical error obtained with the four decoders: matching uniform (pink circles), matching analytical (green circles), matching analytical with soft information (gray circles), and maximum likelihood (blue circles). (See Fig. 6 for L and 1L). Dashed fitted rates presented in e, f. Error bars denote sampling error. e, f Comparison of fitted error per round for all four logical states using matching uniform (pink), matching analytical (green), matching analytical with soft information (gray), and maximum likelihood (blue) decoders on leakage-post-selected data. Error bars represent one standard deviation on the fitted rate.
Fig. 3
Fig. 3. Example Pauli propagation.
Two examples of Pauli propagation through the flagged measurement circuit for a Z-gauge operator. Pauli Z corrections due to deflagging are shown in dotted boxes and depend on the flag qubit measurement results. In the lower half of the figure in blue, a cx gate is followed by a XY error (blue) with probability pcx/15. The subsequent cx gate propagates the X error to the syndrome qubit Q19, flipping the measurement m, and meanwhile the Y error on Q2 propagates without change (it will have an effect on future measurement rounds). The propagated errors are in dotted circles. Note the flag measurement b is not flipped, as the Hadamard gate takes the X error to a harmless Z error. In the top half of the figure, a Pauli Z error occurs on a flag qubit (red) with probability pcx/15, and propagates to a Z error on Q6 and an X error before the measurement a (dashed circles). Deflagging applies Z to Q6, canceling the error there, so that the final propagated error is just the flip of measurement a.
Fig. 4
Fig. 4. Experiment details.
a Translation of Fig. 1a qubit numbering (QN) to standard IBM-Falcon numbering(QFN). b Static ZZ between all connected qubits pairs versus detuning between qubits. Median qubit anharmonicity, see Table 2 for breakdown, is -345 MHz.
Fig. 5
Fig. 5. Leakage analysis.
a Repeated measurement sequence for extracting leakage error during the measurement. The Xπ/2 pulse allows us to randomly sample leakage events from 0 or 1 states. b The leakage probability (pleakmeas) to the 2 state measured at QF14. The leakage and seepage rate is obtained by fitting the data with Eq. (15). c, d Qubit leakage in the system as a function of syndrome measurement rounds for Z − and X − basis logical states. Bar plots show the pleaktot as computed from the gate and measurement leakage rates, obtained from randomized benchmarking (2Q gates) and from the sequence shown in a, respectively. Experimental results, pleakexp=1paccept, where paccept is the acceptance probability calculated from the method outlined in Methods “Post-selection method”, are shown as black symbols for comparison. The experimental results plotted here do not include initialization leakage. e Readout calibration data for QF12 (see Fig. 4a). The qubit is prepared in its 0, 1, and 2 states and measured. The collected statistics can be seen in as blue (0), red (1), and grey (2) where the dot-dashed lines represent 3-σ for each distribution. f 3-state classification results for QF12 after qubit initialization, and g after the first X − syndrome measurement.
Fig. 6
Fig. 6. Logical error for 1L and +L Comparison of logical error vs.
round number for 1L and L states (0L and +L in Fig. 2c, d) using four different decoding methods: matching uniform (pink), matching analytical (green), matching analytical with soft-decoding (gray), and maximum likelihood (blue). All decoders here are using leakage post-selected experimental data. Logical error per round extracted fits are shown in Fig. 2e, f.

References

    1. Chamberland C, Zhu G, Yoder TJ, Hertzberg JB, Cross AW. Topological and subsystem codes on low-degree graphs with flag qubits. Phys. Rev. X. 2020;10:011022.
    1. Hertzberg JB, et al. Laser-annealing josephson junctions for yielding scaled-up superconducting quantum processors. npj Quantum Inf. 2021;7:1. doi: 10.1038/s41534-021-00464-5. - DOI
    1. Poulin D. Stabilizer formalism for operator quantum error correction. Phys. Rev. Lett. 2005;95:230504. doi: 10.1103/PhysRevLett.95.230504. - DOI - PubMed
    1. Dennis E, Kitaev AY, Landahl AJ, Preskill J. Topological quantum memory. J. Math. Phys. 2002;43:4452. doi: 10.1063/1.1499754. - DOI
    1. Bombin H, Martin-Delgado MA. Topological quantum distillation. Phys. Rev. Lett. 2006;97:180501. doi: 10.1103/PhysRevLett.97.180501. - DOI - PubMed