. 2023 May 18;6(1):543.
doi: 10.1038/s42003-023-04788-0.

Debiased ambient vibrations optical coherence elastography to profile cell, organoid and tissue mechanical properties

Affiliations

Debiased ambient vibrations optical coherence elastography to profile cell, organoid and tissue mechanical properties

Jonathan H Mason et al. Commun Biol. .

Abstract

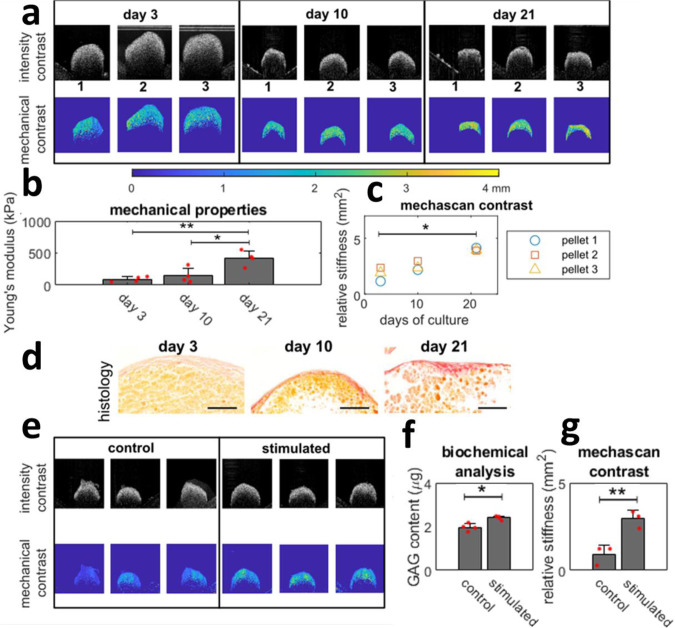
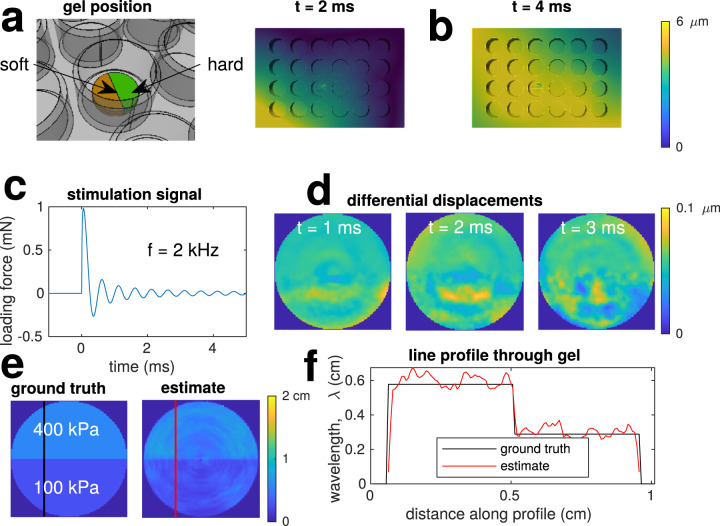
The role of the mechanical environment in defining tissue function, development and growth has been shown to be fundamental. Assessment of the changes in stiffness of tissue matrices at multiple scales has relied mostly on invasive and often specialist equipment such as AFM or mechanical testing devices poorly suited to the cell culture workflow.In this paper, we have developed a unbiased passive optical coherence elastography method, exploiting ambient vibrations in the sample that enables real-time noninvasive quantitative profiling of cells and tissues. We demonstrate a robust method that decouples optical scattering and mechanical properties by actively compensating for scattering associated noise bias and reducing variance. The efficiency for the method to retrieve ground truth is validated in silico and in vitro, and exemplified for key applications such as time course mechanical profiling of bone and cartilage spheroids, tissue engineering cancer models, tissue repair models and single cell. Our method is readily implementable with any commercial optical coherence tomography system without any hardware modifications, and thus offers a breakthrough in on-line tissue mechanical assessment of spatial mechanical properties for organoids, soft tissues and tissue engineering.


Conflict of interest statement

The authors declare no competing interests.

Figures

Fig. 1
Fig. 1. Wavelength estimation from simulation.
a Shows the ground truth with waves travelling laterally in a biphasic material at wavelength λ1 = 2 mm and λ2 = 4 mm, the biased estimation from passive elastography as per Eq. (6), the high variance debiased estimate from Eq. (8) and the proposed debiased filtered estimate from Eq. (9), which forms the mechanical contrast. Wavelengths are colour coded in the figure as per colour bar. b Shows the simulated time-lapse phase measurement induced by the displacement field calculated from ground truth with the addition of a noisy background. c Shows the line profiles through the coloured regions in a. Panel d is the wavelength bias estimated for passive elastography (all red lines) and debiased ambient vibration OCE (blue lines) at increasing noise levels.
Fig. 2
Fig. 2. Mechanical contrast and validation with differing concentration agarose gels with 1% w/v milk powder for optical contrast.
a Shows examples of intensity and mechanical contrast. All pictures are 3×3 mm in size. Panel b is an edge line profile and spatial resolution as calculated as the FWHM of fitted sigmoid derivative as in Eq. (13); the corresponding axial edge spatial resolution was found to be 38.1 μm. c Mechanical calibration performed as a linear fit between squared wavelength and Young’s modulus from Bose ElectroForce (n = 3), assuming the elastic model in Eq. (3); error bars show the standard deviation. OCT intensity images are displayed as the logarithm of the mean intensity.
Fig. 3
Fig. 3. On line monitoring mechanical properties of engineered bones and cartilage tissues.
Panel a is examples of intensity and mechanical contrast of engineered bone tissues (in triplicate) on days 3, 10 and 21. All presented pictures are 1×1 mm. b Shows the Young’s modulus of the tissue, tested by a customised compression rig (n = 4). Panel c is relative stiffness for for each sample throughout culture (n = 3). d Histology with picrosirius red staining for collagen content in osteogenic pellets at days 3, 10 and 21. Orange staining indicates cytoplasm and red staining indicates new synthesised collagen fibrils; scale bar: 100 μm. e Shows intensity and mechanical contrast of engineered cartilage tissues stimulated by hydrostatic pressure for 21 days. Panel f is glycosaminoglycans (GAG) content of samples (n = 4), and g shows relative stiffness from debiased ambient vibration OCE analysis (n = 3). * denotes a significant difference with a p < 0.05 and ** of p < 0.01 as calculated with 1-way Anova test followed by a Tukey–Kramer comparison of means. Error bars represent the standard deviation.
Fig. 4
Fig. 4. On line mechanical measurement of a tissue engineered cancer model.
a Shows the intensity and mechanical contrast of fibroblast seeded collagen gels over 11 day culture. All presented pictures are 6×3 mm. b Shows their corresponding stiffness over time. c Shows the intensity and mechanical contrast of collagen gels with and without cancer cell cultured on top for 7 days. d Mechanical properties measured along the red line displayed in c. e, f Histology images for c stained with haematoxylin and eosin. Scale bar: 1 mm.
Fig. 5
Fig. 5. debiased ambient vibration OCE applications to tissue samples.
a Shows the intensity and mechanical contrast of porcine corneas intact and after implanting two different concentrations of hydrogel; the white arrows indicate areas of uncured gel, which show high mechanical contrast but not in intensity. b Shows storage modulus from rheology from samples of hydrogel (n = 3). c Shows relative stiffness from OCT scans (n = 3). d Shows a study on the mechanical properties of mouse oocytes: comparing zona intact and zona-free wild-type oocytes and intact histone H3.3 knockout oocytes; the zona intact wild type oocytes exhibit greater stiffness heterogenity markedly different from zona-free and less developmentally competent zona-intact H3.3 knockout.Oocytes pictures have been cropped to 100 × 300 micrometres (xz). * denotes a significant difference with a p < 0.05 and ** of p < 0.01 as calculated with 1-way Anova test followed by a Tukey–Kramer comparison of means. Error bars represent the standard deviation.
Fig. 6
Fig. 6. FEM simulation of vibrating multi-well plate with heterogeneous gel.
a Shows the gel seated on the base on a well. b Shows the displacement magnitudes of the plate at t = 2 ms and t = 4 ms. c Shows the excitation force applied to a corner of the plate: a 2 kHz sinusoid with exponentially decaying amplitude. d Shows exampled of the differential displacements in the axial direction at the centre of the gel. e Shows the estimated wavelength over the gel surface and the ground truth assuming shear waves of 2 kHz. Panel f are profile plots are the lines indicated in e.

References

    1. Guimarães CF, Gasperini L, Marques AP, Reis RL. The stiffness of living tissues and its implications for tissue engineering. Nat. Rev. Mater. 2020;5:351–370. doi: 10.1038/s41578-019-0169-1. - DOI
    1. Wall M, et al. Key developments that impacted the field of mechanobiology and mechanotransduction. J. Orthop. Res. 2018;36:605–619. - PubMed
    1. Mullender M, et al. Mechanotransduction of bone cellsin vitro: mechanobiology of bone tissue. Med. Biol. Eng. Comput. 2004;42:14–21. doi: 10.1007/BF02351006. - DOI - PubMed
    1. Klein TJ, Malda J, Sah RL, Hutmacher DW. Tissue engineering of articular cartilage with biomimetic zones. Tissue Eng. B Rev. 2009;15:143–157. doi: 10.1089/ten.teb.2008.0563. - DOI - PMC - PubMed
    1. Khoshgoftar M, Wilson W, Ito K, van Donkelaar CC. The effect of tissue-engineered cartilage biomechanical and biochemical properties on its post-implantation mechanical behavior. Biomechan. Model. Mechanobiol. 2013;12:43–54. doi: 10.1007/s10237-012-0380-0. - DOI - PubMed

Publication types