. 2023 May 18;12(1):124.
doi: 10.1038/s41377-023-01151-0.

Polarization-sensitive intensity diffraction tomography

Affiliations

Polarization-sensitive intensity diffraction tomography

Seungri Song et al. Light Sci Appl. .

Abstract

Optical anisotropy, which is an intrinsic property of many materials, originates from the structural arrangement of molecular structures, and to date, various polarization-sensitive imaging (PSI) methods have been developed to investigate the nature of anisotropic materials. In particular, the recently developed tomographic PSI technologies enable the investigation of anisotropic materials through volumetric mappings of the anisotropy distribution of these materials. However, these reported methods mostly operate on a single scattering model, and are thus not suitable for three-dimensional (3D) PSI imaging of multiple scattering samples. Here, we present a novel reference-free 3D polarization-sensitive computational imaging technique-polarization-sensitive intensity diffraction tomography (PS-IDT)-that enables the reconstruction of 3D anisotropy distribution of both weakly and multiple scattering specimens from multiple intensity-only measurements. A 3D anisotropic object is illuminated by circularly polarized plane waves at various illumination angles to encode the isotropic and anisotropic structural information into 2D intensity information. These information are then recorded separately through two orthogonal analyzer states, and a 3D Jones matrix is iteratively reconstructed based on the vectorial multi-slice beam propagation model and gradient descent method. We demonstrate the 3D anisotropy imaging capabilities of PS-IDT by presenting 3D anisotropy maps of various samples, including potato starch granules and tardigrade.


Conflict of interest statement

The authors declare no competing interests.

Figures
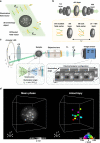
Fig. 1
Fig. 1. PS-IDT operation principle and experimental setup.
a A 3D anisotropy object is illuminated by polarized plane waves at various illumination angles, and the resultant diffracted field vector, Em,N, through the object is recorded and processed to obtain 3D Jones matrix of the object. b In vectorial MSBP, a 3D anisotropy object is considered as a series of N anisotropic thin layers, and the interaction of light with each layer is modeled by considering the propagation of the light through a distance Δz after multiplying the incident field vector by the Jones matrix of the layer. c Schematic and measurement processes of PS-IDT. A ring LED array illuminates the object, and a conventional 4-f imaging system collects the diffracted field and forms an image at the sensor plane. The input and output polarization states are modulated by the circular (CP) and linear (LP) polarizers, respectively. TL: tube lens. d Exemplary PS-IDT imaging results for a digital phantom. Left and right present the 3D isotropy (mean phase delay ϕ~) and anisotropy (retardance δ and in-plane (xy-plane) optic-axis orientation φ) distributions. Definition of mean phase delay is provided in “Methods”
Fig. 2
Fig. 2. PS-IDT numerical simulation for a 3D multiple-scattering anisotropy phantom.
a13, c13 Lateral and axial cross-sectional information of mean phase and anisotropy of a digital phantom. b13, d13 Corresponding the mean phase and anisotropy images reconstructed by PS-IDT. The first row presents lateral (xy-plane) cross-sectional maps at the center of the 3D phantom, and the second and third rows are the information in the yz and xz sections through the red and orange dashed lines in (a1), respectively. e, f 3D perspectives of the PS-IDT-reconstructed mean phase and anisotropy tomograms
Fig. 3
Fig. 3. Experimental reconstruction of the 3D anisotropy maps of aggregated potato starch granules.
af Amplitude and phase maps of the reconstructed Jones matrix element Oxy of potato starch granules at different depths. gi Anisotropy maps extracted from the reconstructed 3D Jones matrix of potato starches. j 3D anisotropy map of potato starch granules over a volume of 50 μm × 50 μm × 40 μm
Fig. 4
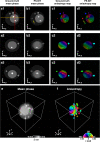
Fig. 4. Experimental reconstruction of the 3D anisotropy map of a tardigrade.
a1c1 Representative PS-IDT images of a tardigrade at three different ROIs. a2–c2 Fourier magnitudes of the measurement results in (a1c1). Information outside the pupil (white arrows) in Fourier magnitude is an evidence of the multiple-scattering characteristic of the tardigrade. df Mean phase (ϕ~) images extracted from the reconstructed 3D Jones matrix of whole tardigrade at different depths of −10, −3, and 4 μm, respectively. e1–2 and f1–2 show the magnified mean phase and anisotropy images indicated by the orange and green square boxes in (e) and (f). g, h 3D rendering of the mean phase and anisotropy maps of the whole tardigrade over a volume of 150 μm × 80 μm × 60 μm. Scale bars: 10 μm

References

    1. McLeod E, Ozcan A. Unconventional methods of imaging: computational microscopy and compact implementations. Rep. Prog. Phys. 2016;79:076001. doi: 10.1088/0034-4885/79/7/076001. - DOI - PubMed
    1. Tian L, Waller L. Quantitative differential phase contrast imaging in an LED array microscope. Opt. Express. 2015;23:11394–11403. doi: 10.1364/OE.23.011394. - DOI - PubMed
    1. Zheng GA, Horstmeyer R, Yang C. Wide-field, high-resolution Fourier ptychographic microscopy. Nat. Photonics. 2013;7:739–745. doi: 10.1038/nphoton.2013.187. - DOI - PMC - PubMed
    1. Ou XZ, et al. Quantitative phase imaging via Fourier ptychographic microscopy. Opt. Lett. 2013;38:4845–4848. doi: 10.1364/OL.38.004845. - DOI - PMC - PubMed
    1. Wu YC, Ozcan A. Lensless digital holographic microscopy and its applications in biomedicine and environmental monitoring. Methods. 2018;136:4–16. doi: 10.1016/j.ymeth.2017.08.013. - DOI - PubMed