. 2023 May 18;6(1):534.
doi: 10.1038/s42003-023-04898-9.

Nanoparticle-based targeting of microglia improves the neural regeneration enhancing effects of immunosuppression in the zebrafish retina

Affiliations

Nanoparticle-based targeting of microglia improves the neural regeneration enhancing effects of immunosuppression in the zebrafish retina

Kevin Emmerich et al. Commun Biol. .

Abstract

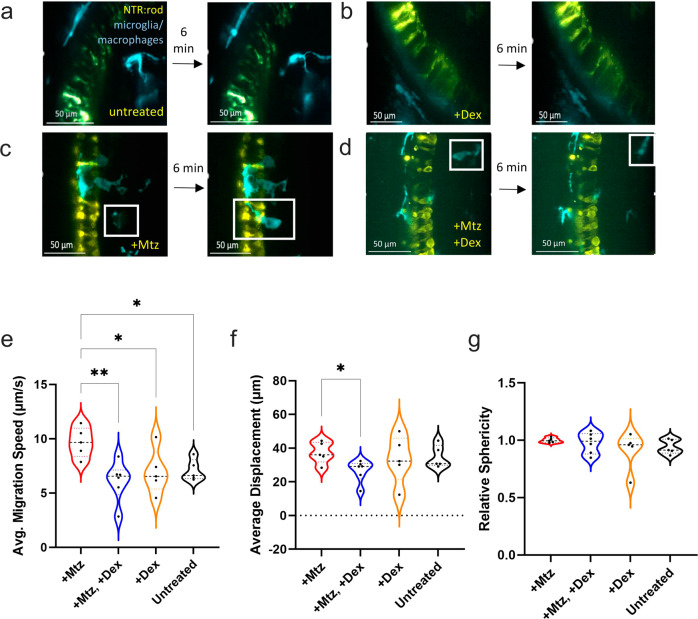
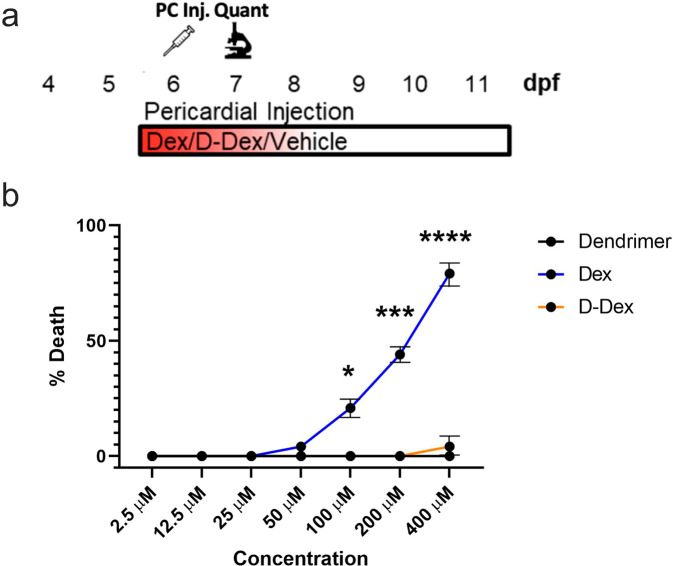
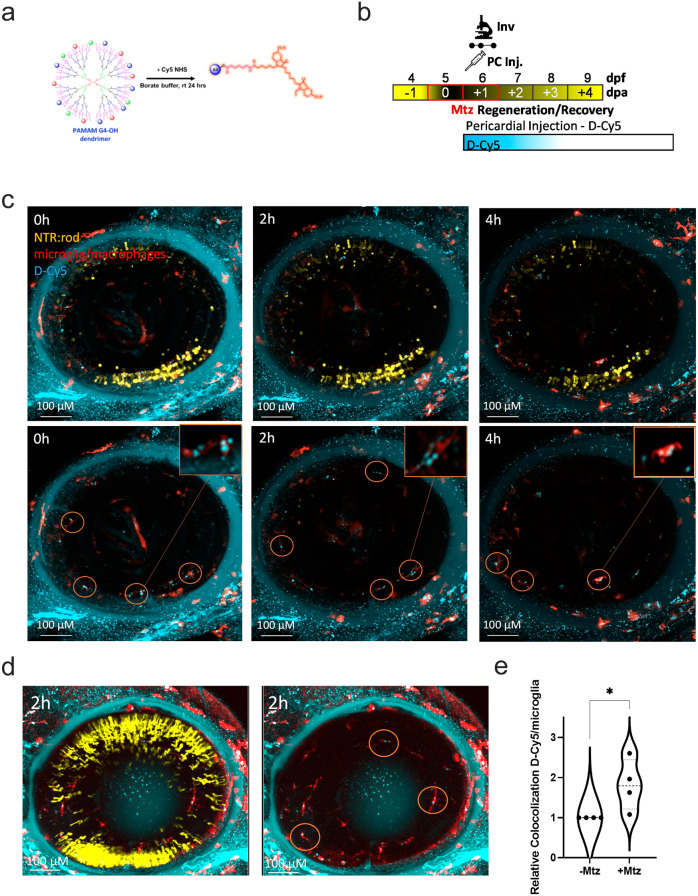
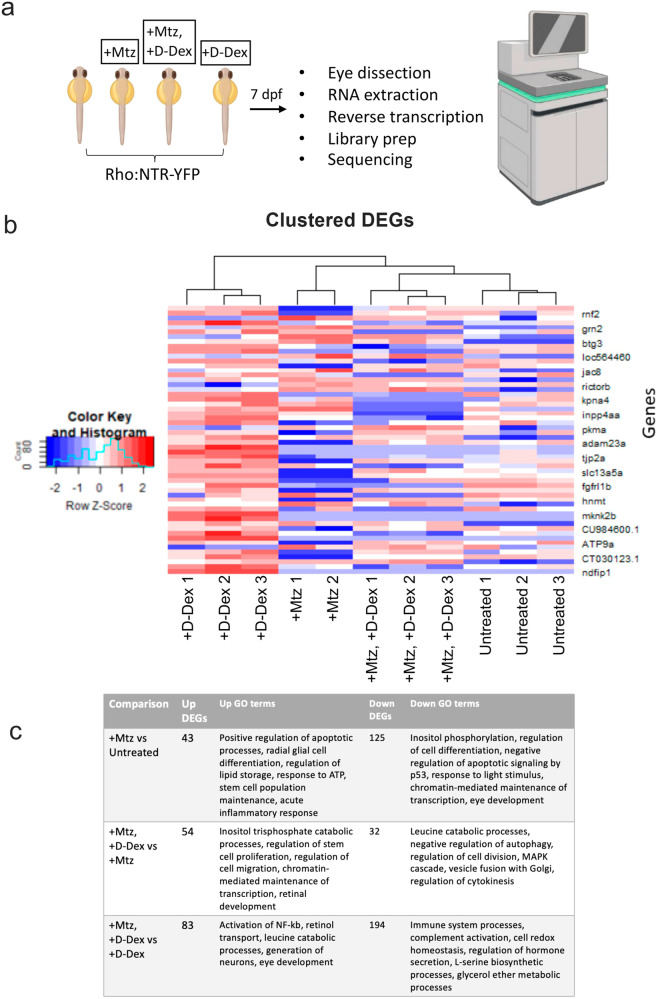
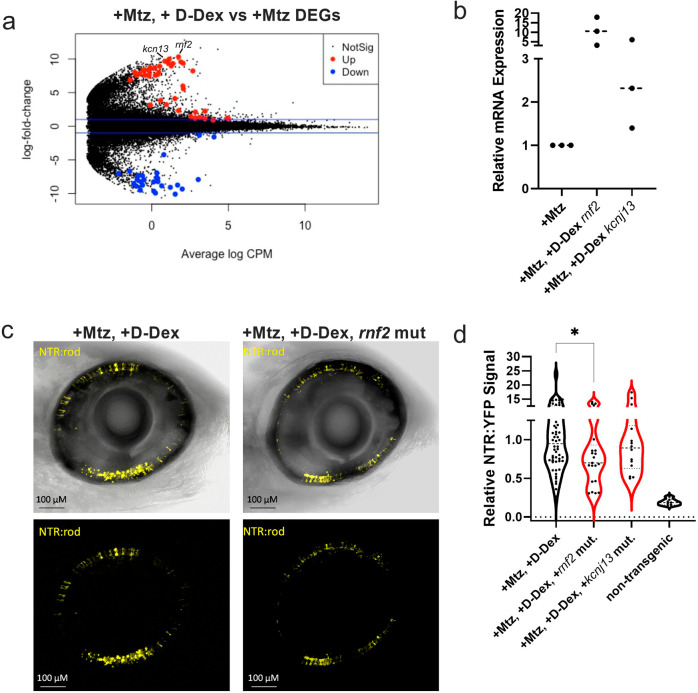
Retinal Müller glia function as injury-induced stem-like cells in zebrafish but not mammals. However, insights gleaned from zebrafish have been applied to stimulate nascent regenerative responses in the mammalian retina. For instance, microglia/macrophages regulate Müller glia stem cell activity in the chick, zebrafish, and mouse. We previously showed that post-injury immunosuppression by the glucocorticoid dexamethasone accelerated retinal regeneration kinetics in zebrafish. Similarly, microglia ablation enhances regenerative outcomes in the mouse retina. Targeted immunomodulation of microglia reactivity may therefore enhance the regenerative potential of Müller glia for therapeutic purposes. Here, we investigated potential mechanisms by which post-injury dexamethasone accelerates retinal regeneration kinetics, and the effects of dendrimer-based targeting of dexamethasone to reactive microglia. Intravital time-lapse imaging revealed that post-injury dexamethasone inhibited microglia reactivity. The dendrimer-conjugated formulation: (1) decreased dexamethasone-associated systemic toxicity, (2) targeted dexamethasone to reactive microglia, and (3) improved the regeneration enhancing effects of immunosuppression by increasing stem/progenitor proliferation rates. Lastly, we show that the gene rnf2 is required for the enhanced regeneration effect of D-Dex. These data support the use of dendrimer-based targeting of reactive immune cells to reduce toxicity and enhance the regeneration promoting effects of immunosuppressants in the retina.


Conflict of interest statement

J.S.M. holds patents for the NTR inducible cell ablation system (US #7,514,595) and uses thereof (US #8,071,838 and US#8431768). R.M.K. and S.P.K. have been awarded pending patents relating to the hydroxyl dendrimer platform for ocular therapies. RMK and his wife (Sujatha Kannan) are co-founders/board members and have financial interests in Ashvattha Therapeutics Inc., a start-up focusing on clinical translation of the dendrimer platform. The remaining authors declare no competing interests.

Figures

Fig. 1
Fig. 1. Microglia reactivity is altered in response to post-ablation Dex treatment.
ad Image stills 6 min apart from AO-LLSM imaging of 5 or 6 dpf transgenic lines labeling NTR-expressing rods (yellow) and microglia/macrophages (cyan). Four conditions were imaged: non-ablated “untreated” control (A), non-ablated, “+Dex” (B), rod cell ablated, “+Mtz” (C), and rod cells ablated with Dex treatment, “+Mtz, +Dex” (D). In all images, the inner nuclear layer is to the right of the NTR-YFP rod cells. eg Imaris quantification of average migration speed (μm/second), average displacement (μm), and relative sphericity of microglia in each larva, sample sizes for each plot from left to right: 5, 6, 5, 6 with a total of 66 microglia analyzed. See Supplementary Movies 1-4 corresponding to stills A-D, respectively. Asterisks indicate statistically significant differences between the indicated groups (*p ≤ 0.05, **p ≤ 0.01), all other comparisons were not statistically significant. Lines within the violin data for each condition for all plots indicate lower quartile (bottom), median (middle line), and upper quartile (top).
Fig. 2
Fig. 2. Dendrimer conjugation eliminates Dex-mediated toxicity in larval zebrafish.
a Schematic of injection assay to test dendrimer, Dex and D-Dex toxicity. At 6 dpf, dendrimer, “free” Dex, or D-Dex were injected into the pericardium of zebrafish larvae (~10 nL injected volume, 2.5-400 µM for Dex and D-Dex). At 7 dpf, toxicity was quantified based on percent survival across 24 fish per condition over two trials. b Line graph indicating average toxicity at 7 dpf for dendrimer (black line), Dex (blue line), and D-Dex (orange line). Comparisons between Dex or D-Dex and dendrimer alone controls showed statistically significant increases in toxicity for Dex-injected larvae only (100-400 μM, *p ≤ 0.05, ***p ≤ 0.001, ****p ≤ 0.0001, respectively).
Fig. 3
Fig. 3. Dendrimers localize to reactive microglia following rod cell ablation.
a Process for conjugating Cy5 to PAMAM G4-OH dendrimers (D-Cy5) using Cy5 NHS and borate buffer. b Assay schematic: transgenic zebrafish expressing NTR:rod (yellow) and microglia/macrophages (red) were treated with 2.5 mM Mtz from 5–7 dpf to induce rod cell loss. At 6 dpf, fish were given PC injections of D- Cy-5 (cyan, 2 ng/ul) and imaged using in vivo confocal time series microscopy. c Image stills from representative larva at 0, 2, and 4 hpi with all three channels (top panels) or with the yellow channel removed (bottom panels); insets and orange circles highlight interactions between dendrimers (cyan) and microglia (red). See Supplementary Movie 6 for the time-lapse sequence. d Three (left) and two-channel (right) images still from control non-ablated larva at 2 hpi of D-Cy5; orange circles highlight interactions between dendrimers (cyan) and microglia (red). e Imaris-based quantification of normalized colocalization between microglia (red) and D-Cy5 (cyan) signals in retinas treated ±Mtz (n = 4 larvae per condition), +Mtz values were normalized to paired sibling (−Mtz) control fish imaged on the same day (*p ≤ 0.05).
Fig. 4
Fig. 4. D-Dex further enhances the regeneration-promoting effects of Dex and induces proliferation.
a Assay schematic for data in (b): 5 dpf NTR-rod larvae were exposed to 10 mM Mtz for 24 h and then separated into 5 groups, (1) “+Mtz”; (2) exposed to 2.5 μM free Dex from 6–9 dpf, “+Mtz, +Dex (soak)”; or injected at 6 dpf with either (3) 5 μM free Dex, “+Mtz, +Dex (inj)”; (4) 5 μM D-Dex, “+Mtz, +D-Dex (inj)”, or (5) dendrimers alone, “+Mtz, +Dendrimer (inj)”. At 9 dpf (4 dpa) NTR-YFP rod signal was quantified by plate reader assay. b Quantification of NTR-YFP signals at 9 dpf (4 dpa) to assess rod cell regeneration kinetics, n = 77, 58, 60, 44, and 28 larvae from left to right (*p ≤ 0.05, **p ≤ 0.01, ****p ≤ 0.0001). c Representative sections from 8 dpf larvae treated with either 10 mM Mtz only from 5–6 dpf, D-Dex injection only at 6 dpf, or Mtz (5–6 dpf) followed by D-Dex injection at 6 dpf. Images show NTR:rod cells (yellow), DAPI (blue, nuclei), and immunostaining for PCNA (red, proliferating cells). d Quantification of PCNA+ cells (not counting the CMZ region), n = 8, 9, and 10 from left to right. e Representative sections from 10 dpf larvae treated with either 10 mM Mtz only from 5–6 dpf or Mtz followed by D-Dex injection at 6 dpf. Images show NTR:rod cells (yellow), DAPI (blue, nuclei) and immunostaining for BrdU (red, proliferating cells). f Quantification of NTR-YFP-expressing rod cells, n = 14 for each group. g Quantification of BrdU+ cells, n = 14 for each group (*p ≤ 0.05, **p ≤ 0.01, ****p ≤ 0.0001, all others showed non-statistically significant differences).
Fig. 5
Fig. 5. RNA-seq identifies differentially expressed genes following D-Dex treatments.
a Assay schematic for RNA-seq assays. Eyes from NTR:rod larvae across four conditions (untreated, Mtz only, +Mtz, +D-Dex, or D-Dex only) were collected at 7 dpf, 24 h following D-Dex injections (where applicable) and processed for RNA sequencing. b Subset of most statistically significant DEGs across conditions (red indicates upregulation, blue indicates downregulation). c Number of up and downregulated DEGs associated with select GO terms. Fish icons in panel (a) were produced with permission from Biorender.
Fig. 6
Fig. 6. The E3 ubiquitin ligase rnf2 is required for D-Dex enhanced regeneration.
a Volcano plot of DEGs between Mtz only and +Mtz, +D-Dex treated eyes. Red indicates statistically significant upregulation and blue indicates statistically significant downregulation. b qRT-PCR assessment of rnf2 and kcnj13 upregulation in the +Mtz, +D-Dex condition. c Quantification of NTR-YFP-expressing rod cells at 9 dpf to assess changes in regeneration kinetics in +Mtz, +D-Dex larvae following knockdown of rnf2 and kcnj13, n = 54, 22, 24, and 7 from left to right (*p ≤ 0.05). d Representative in vivo confocal images of NTR-rod larval retinas at 9 dpf following +Mtz, +D-Dex treatments in either wildtype control (left) or rnf2 knockdown “crispant” backgrounds. Sample sizes from left to right: 54, 21, 14, and 7.

References

    1. Fausett, B. V. & Goldman, D. A role for alpha1 tubulin-expressing Müller glia in regeneration of the injured zebrafish retina. J. Neurosci.10.1523/JNEUROSCI.0332-06.2006 (2006). - PMC - PubMed
    1. Lenkowski JR, Raymond PA. Müller glia: Stem cells for generation and regeneration of retinal neurons in teleost fish. Prog. Retin. Eye Res. 2014;0:94–123. doi: 10.1016/j.preteyeres.2013.12.007. - DOI - PMC - PubMed
    1. Yurco, P. & Cameron, D. A. Responses of Müller glia to retinal injury in adult zebrafish. Vis. Res. 10.1016/j.visres.2004.10.022 (2005). - PubMed
    1. García-García D, Locker M, Perron M. Update on Müller glia regenerative potential for retinal repair. Curr. Opin. Genet. Dev. 2020;64:52–59. doi: 10.1016/j.gde.2020.05.025. - DOI - PubMed
    1. Lahne, M., Nagashima, M., Hyde, D. R. & Hitchcock, P. F. Reprogramming Müller glia to regenerate retinal neurons. Annu. Rev. Vis. Sci. 10.1146/annurev-vision-121219-081808 (2020). - PMC - PubMed

Publication types