Review
. 2023 May 18;7(1):44.
doi: 10.1038/s41698-023-00386-9.

Refined high-content imaging-based phenotypic drug screening in zebrafish xenografts

Affiliations
Review

Refined high-content imaging-based phenotypic drug screening in zebrafish xenografts

C Sturtzel et al. NPJ Precis Oncol. .

Abstract

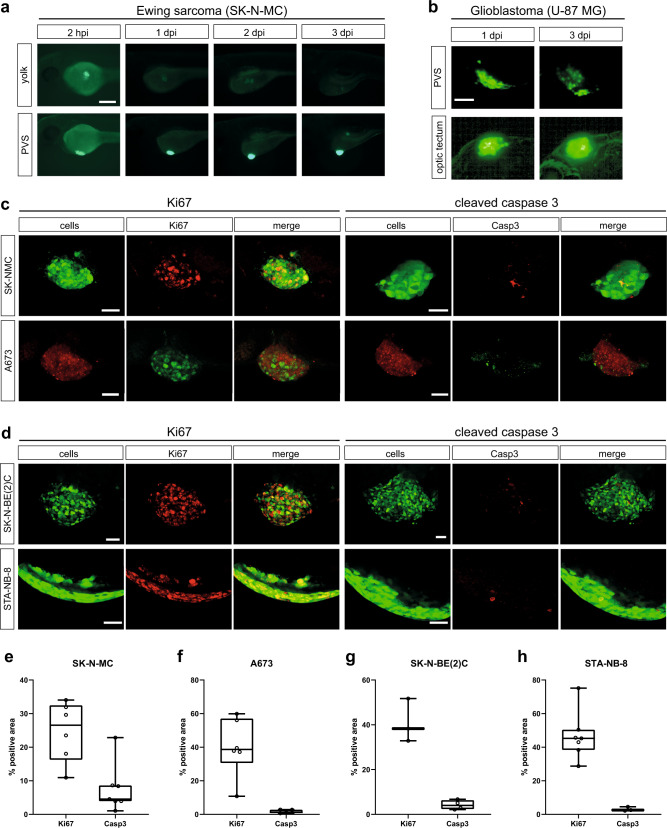
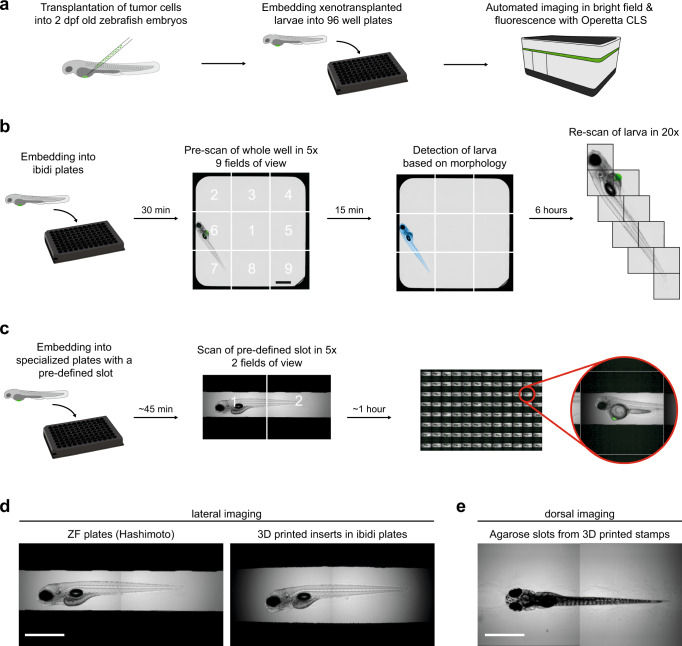
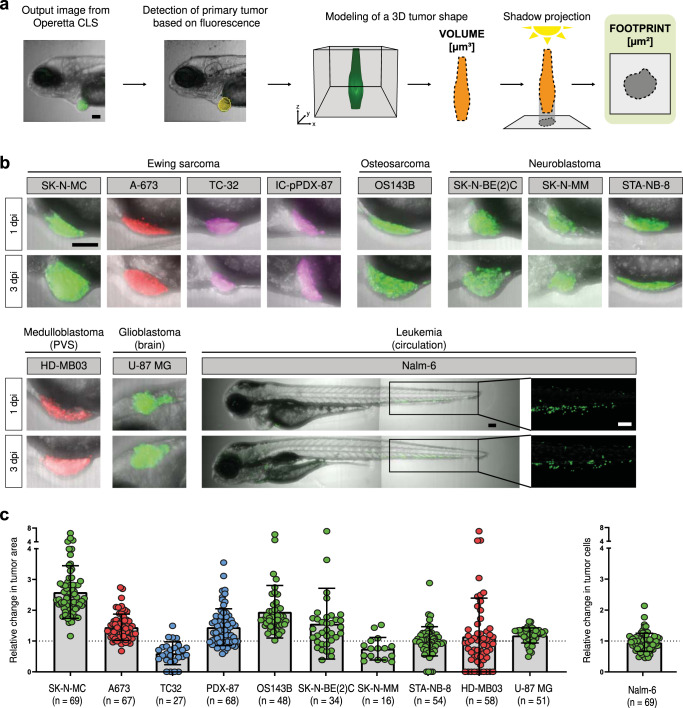
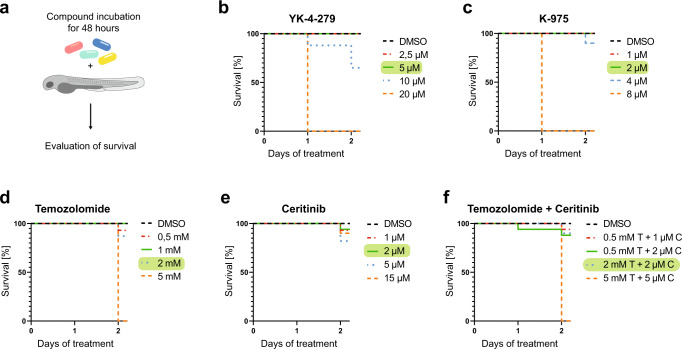
Zebrafish xenotransplantation models are increasingly applied for phenotypic drug screening to identify small compounds for precision oncology. Larval zebrafish xenografts offer the opportunity to perform drug screens at high-throughput in a complex in vivo environment. However, the full potential of the larval zebrafish xenograft model has not yet been realized and several steps of the drug screening workflow still await automation to increase throughput. Here, we present a robust workflow for drug screening in zebrafish xenografts using high-content imaging. We established embedding methods for high-content imaging of xenografts in 96-well format over consecutive days. In addition, we provide strategies for automated imaging and analysis of zebrafish xenografts including automated tumor cell detection and tumor size analysis over time. We also compared commonly used injection sites and cell labeling dyes and show specific site requirements for tumor cells from different entities. We demonstrate that our setup allows us to investigate proliferation and response to small compounds in several zebrafish xenografts ranging from pediatric sarcomas and neuroblastoma to glioblastoma and leukemia. This fast and cost-efficient assay enables the quantification of anti-tumor efficacy of small compounds in large cohorts of a vertebrate model system in vivo. Our assay may aid in prioritizing compounds or compound combinations for further preclinical and clinical investigations.


Conflict of interest statement

The authors declare no competing interests.

Figures

Fig. 1
Fig. 1. Characterization of pediatric solid tumor xenografts.
a GFP-labeled SK-N-MC Ewing sarcoma cells (shSK-E17T) were transplanted into 2 dpf old zebrafish embryos. Injection was performed into the yolk (n = 9) vs. the PVS (n = 5) and embryos were monitored with a fluorescence miscroscope (Axio Zoom.V16, Zeiss) daily until 3 dpi. Scale bar is 250 µm. b GFP-labeled U-87 MG glioblastoma cells were transplanted into the PVS vs. the optic tectum (orthotopic) and imaged at 1 dpi and 3 dpi using the Operetta CLS. Scale bar is 100 µm. c Embryos transplanted with SK-N-MC or A673 Ewing sarcoma cells were fixed at 3 dpi and immunostained for Ki67 (SK-N-MC n = 6, A673 n = 6) and cleaved caspase 3 (SK-N-MC n = 7, A673 n = 5). Scale bars are 50 µm. d Embryos transplanted with SK-N-BE(2)C and STA-NB-8 neuroblastoma cells were fixed at 3 dpi and immunostained for Ki67 (SK-N-BE(2)C n = 3, STA-NB-8 n = 7) and cleaved caspase 3 (SK-N-BE(2)C n = 4, STA-NB-8 n = 3). Immunostained larvae were imaged with a confocal microscope (Leica SP8). Scale bars are 50 µm. eh Quantification of percentages of Ki67-/cleaved Caspase 3-positive areas of immunostained xenografted tumors (SK-N-MC, A673, SK-N-BE(2)C, and STA-NB-8) was performed with ImageJ and plotted with Tukeys box plots. Line represents the median value, box spans 25th to 75th percentile, and whiskers span 5th to 95th percentile.
Fig. 2
Fig. 2. Embedding & automated imaging of xenotransplanted zebrafish larvae.
a Workflow: Zebrafish larvae are xenotransplanted with tumor cells and embedded into 96-well plates and automatically imaged with the Operetta CLS high-content imaging system. b Embedding of xenotransplanted larvae into ibidi view plates and imaging with prescan & rescan function of the Operetta CLS: First the whole well is imaged in 9 fields of view with a 5x air objective, then the xenotransplanted larva is detected (blue). Finally the area of interest is rescanned at higher magnification with a 20x water objective. c Embedding of xenotransplanted larvae into 96-well plates with a pre-defined slot for zebrafish. Imaging of 2 fields of view with a 5x air objective. d For lateral imaging larvae can be embedded into ZF plates (left) or ibidi plates with 3D-printed inserts (right). Scale bar is 1 mm. e For dorsal imaging agarose stamps (adapted from Wittbrodt et al.) were produced that create slots for zebrafish larvae. Scale bar is 1 mm.
Fig. 3
Fig. 3. Automated quantification of tumor size.
a Workflow: Initially, the Harmony software detects the large tumor cell mass based on fluorescence. Then images from the z-stacks are modeled into a 3D tumor shape ( = tumor volume in µm³). This 3D shape is then projected back onto a 2D plane creating a footprint of the tumor (tumor footprint in µm²). b Representative images for transplanted tumor entities (SK-N-MC (SKshctrl), A-673, TC-32, IC-pPDX-87, OS143B, SK-N-BE(2)C, SK-N-MM, STA-NB-8, HD-MB03, U-87 MG, Nalm-6) at 1 dpi and 3 dpi. c Dot plots show relative change in tumor area (3 dpi/1 dpi) for transplanted tumor entities (SK-N-MC, A-673, TC32, IC-pPDX-87, OS143B, SK-N-BE(2)C, SK-N-MM, STA-NB-8, HD-MB03, U-87 MG) and relative change in tumor cells (Nalm-6). Error bars represent SD. Scale bars are 100 µm.
Fig. 4
Fig. 4. Comparison of CellTrackerTM CM-DiI and CellTraceTM Violet as cell dyes for xenotransplantation.
a Overview: GFP-labeled SK-N-MC cells (SKshctrl) were counter-labeled either with CellTrackerTM CM-DiI or CellTraceTM Violet. b Dot plot shows relative change in tumor size in larvae transplanted with unstained cells (n = 17) or cells labeled with DiI (n = 20) or CellTraceTM Violet (n = 20). c Comparison of tumor detection based on either GFP- or CellTraceTM Violet-signal. Dot plots show detected tumor areas at 1 dpi and 3 dpi. d Comparison of tumor detection based on either GFP- or DiI-signal. Dot plots show detected tumor areas at 1 dpi and 3 dpi. e, f The number of disseminated tumor cells at 3 dpi was determined with a spot count algorithm. Statistical analysis was performed with a Kruskal–Wallis test in (b) and Mann–Whitney tests in (ce) (ns: not significant, ****p < 0.0001). Error bars represent SD. Scale bars are 100 µm.
Fig. 5
Fig. 5. No observed effect concentration (NOEC) determination.
NOEC was determined as shown in a for YK-4-279 (b), K-975 (c), Temozolomide (d), Ceritinib (e), and for the combination of Temozolomide + Ceritinib (f). Larvae were incubated with different concentrations of compounds or DMSO (YK-4-279: DMSO (n = 29), 2,5 µM (n = 34), 5 µM (n = 41), 10 µM (n = 34), and 20 µM (n = 28); K-975: DMSO (n = 11), 1 µM (n = 13), 2 µM (n = 11), 4 µM (n = 11) and 8 µM (n = 10); Temozolomide: DMSO (n = 9), 0,5 mM (n = 16), 1 mM (n = 14), 2 mM (n = 16) and 5 mM (n = 15); Ceritinib: DMSO (n = 9), 1 µM (n = 15), 2 µM (n = 16), 5 µM (n = 17) and 15 µM (n = 10); Ceritinib + Temozolomide: DMSO (n = 9), 1 µM C + 0.5 mM T (n = 17), 2 µM C + 0.5 mM T (n = 17), 2 µM C + 2 mM T (n = 10) and 5 µM C + 5 mM T (n = 20)) and survival was evaluated after 48 h. Determined NOECs were 5 µM for YK-4-279, 2 µM for K-975, 2 mM for Temozolomide, 2 µM for Ceritinib, and 2 mM Temozolomide + 2 µM Ceritinib for the combination (highlighted in green).
Fig. 6
Fig. 6. Treatment of xenografted zebrafish larvae with targeted compounds.
a) Workflow: Larvae are xenotransplanted at 2 dpf. After 24 h (1 dpi) they are anesthetized, embedded and automatically imaged in the Operetta CLS. Larvae are then incubated with compounds at NOEC concentration or DMSO as a control for 48 h. Larvae are imaged again on the Operetta CLS (3 dpi) and tumor sizes are quantified and analyzed. b) Treatment of larvae xenotransplanted with GFP-labeled SK-N-MC cells (shSK-E17T) with 5 µM YK-4-279 (n = 73) or DMSO (n = 78) (left panel) and treatment of GFP-labeled SK-N-MC cells (SKshctrl) with 2 µM K-975 (n = 54) or DMSO (n = 70) (right panel). c) Treatment of larvae xenotransplanted with GFP-labeled OS143B cells with 2 µM K-975 (n = 39) or DMSO (n = 52). d) Treatment of larvae xenotransplanted with GFP-labeled U-87 MG cells with 10 µM A-1331852 (n = 13) or DMSO (n = 38). e) Treatment of larvae xenotransplanted with GFP-labeled STA-NB-8 patient-derived cells with 2 mM Temozolomide (n = 24), 2 µM Ceritinib (n = 22), 2 mM Temozolomide + 2 µM Ceritinib (n = 23) or DMSO (n = 54). Scale bars are 100 µm. Dot plots show relative change in tumor size (3 dpi/1 dpi). Statistical analyses were performed with a Mann–Whitney test in (bd) and with a Kruskal–Wallis test in (e) (****p < 0.0001, **p < 0.005). Error bars represent SD.
Fig. 7
Fig. 7. Treatment of SK-N-MC xenografted zebrafish larvae with Hsp90 inhibitors.
a Schematic representation of different mechanisms of Hsp90 inhibition. b Treatment of larvae xenotransplanted with GFP-labeled SK-N-MC cells (SKshctrl) with 30 µM 17-DMAG (n = 65), 30 µM TSF-15 (n = 68) or DMSO (n = 65). Scale bar is 100 µm. Dot plots show relative change in tumor size (3 dpi/1 dpi). Statistical analysis was performed with a Kruskal–Wallis test (***p < 0.001, **p < 0.01). Error bars represent SD.

References

    1. WHO, “Cancer”, https://www.who.int/news-room/fact-sheets/detail/cancer (2022).
    1. Xu C, Li X, Liu P, Li M, Luo F. Patient-derived xenograft mouse models: a high fidelity tool for individualized medicine. Oncol Lett. 2019;17:3–10. - PMC - PubMed
    1. Costa, B., Estrada, M. F., Mendes, R. V. & Fior, R. Zebrafish avatars towards personalized medicine—a comparative review between avatar models. Cells9, 10.3390/cells9020293 (2020). - PMC - PubMed
    1. Fior R, et al. Single-cell functional and chemosensitive profiling of combinatorial colorectal therapy in zebrafish xenografts. Proc. Natl Acad. Sci. USA. 2017;114:E8234–E8243. doi: 10.1073/pnas.1618389114. - DOI - PMC - PubMed
    1. Lee LM, Seftor EA, Bonde G, Cornell RA, Hendrix MJ. The fate of human malignant melanoma cells transplanted into zebrafish embryos: assessment of migration and cell division in the absence of tumor formation. Dev. Dyn. 2005;233:1560–1570. doi: 10.1002/dvdy.20471. - DOI - PubMed