. 2023 Aug;30(8):1207-1215.
doi: 10.1038/s41594-023-00997-7. Epub 2023 May 18.

RNA stability controlled by m6A methylation contributes to X-to-autosome dosage compensation in mammals

Affiliations

RNA stability controlled by m6A methylation contributes to X-to-autosome dosage compensation in mammals

Cornelia Rücklé et al. Nat Struct Mol Biol. 2023 Aug.

Erratum in

Abstract

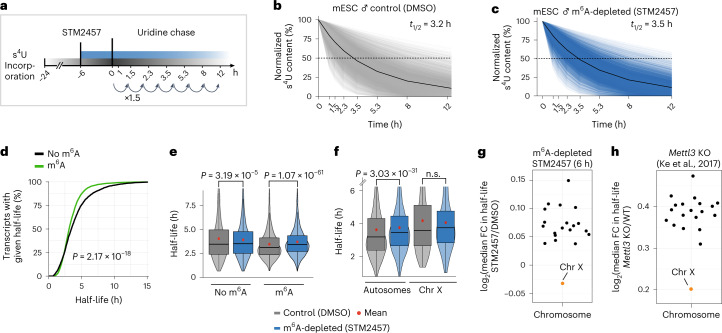
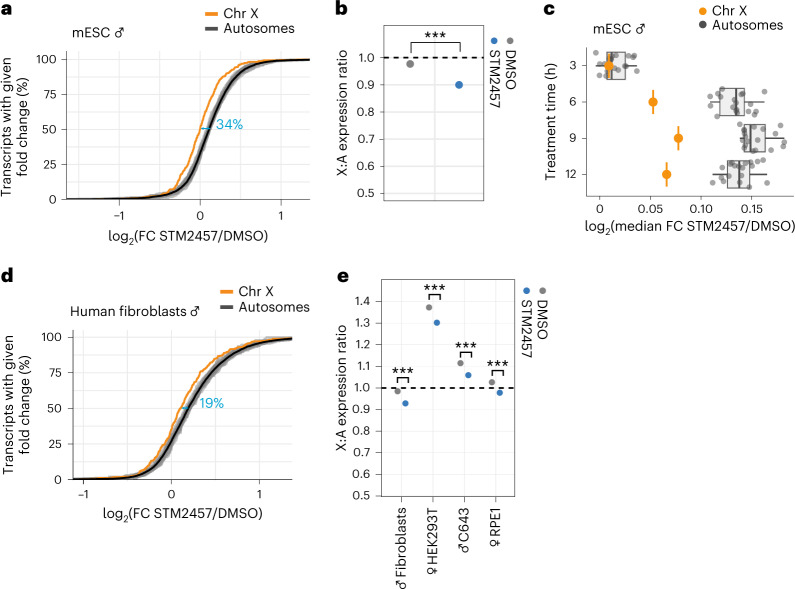
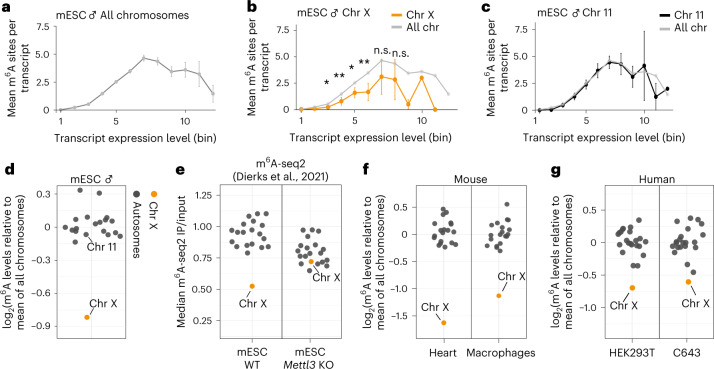
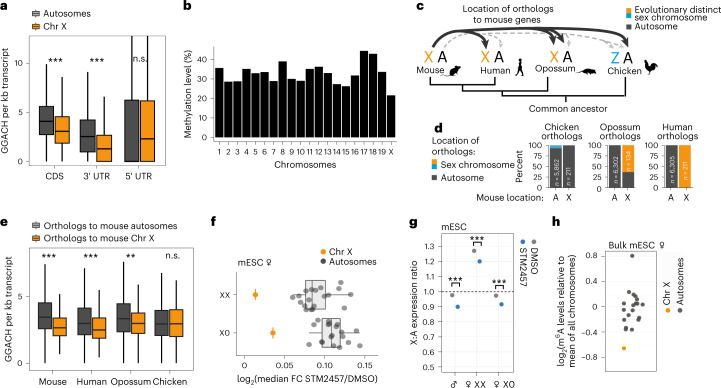
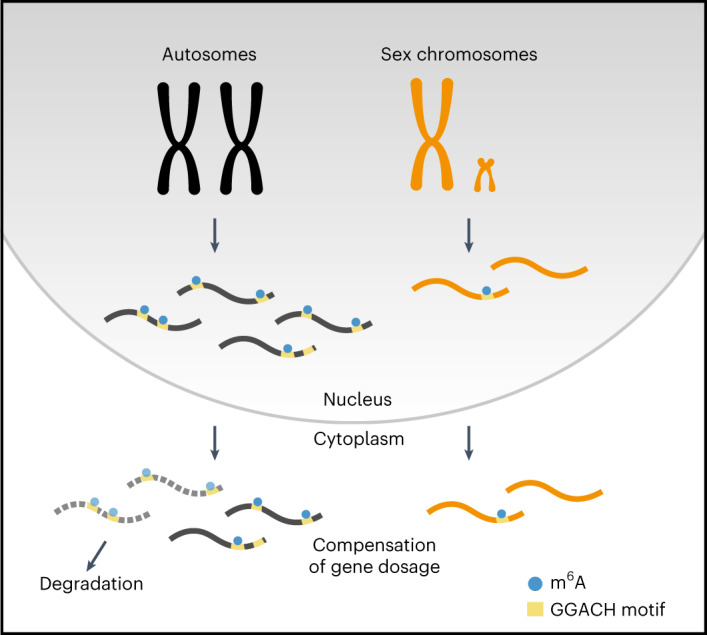
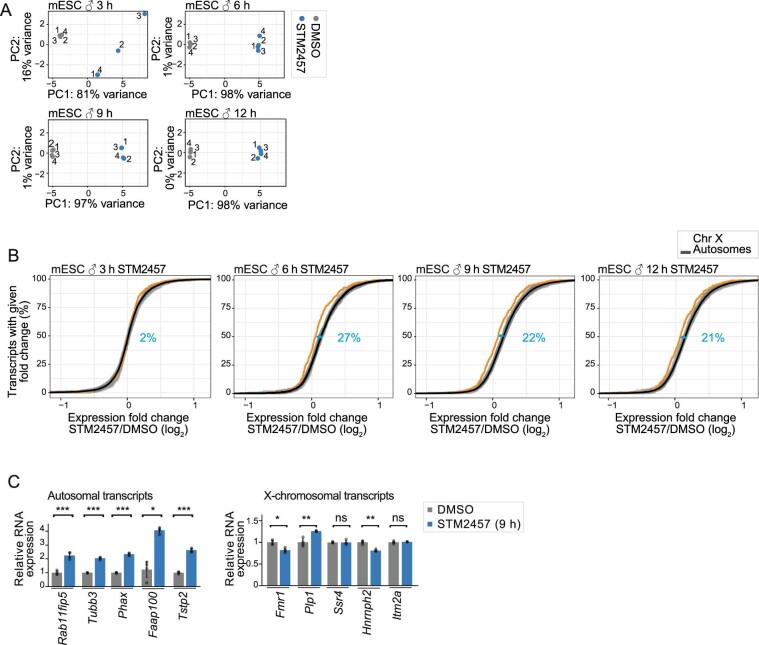
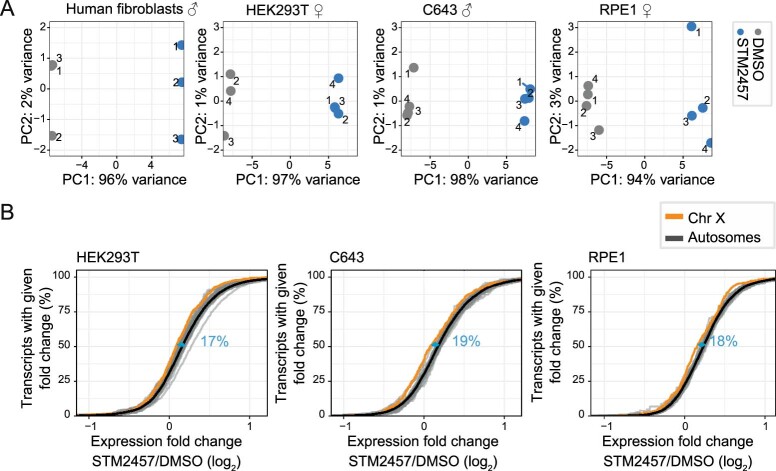
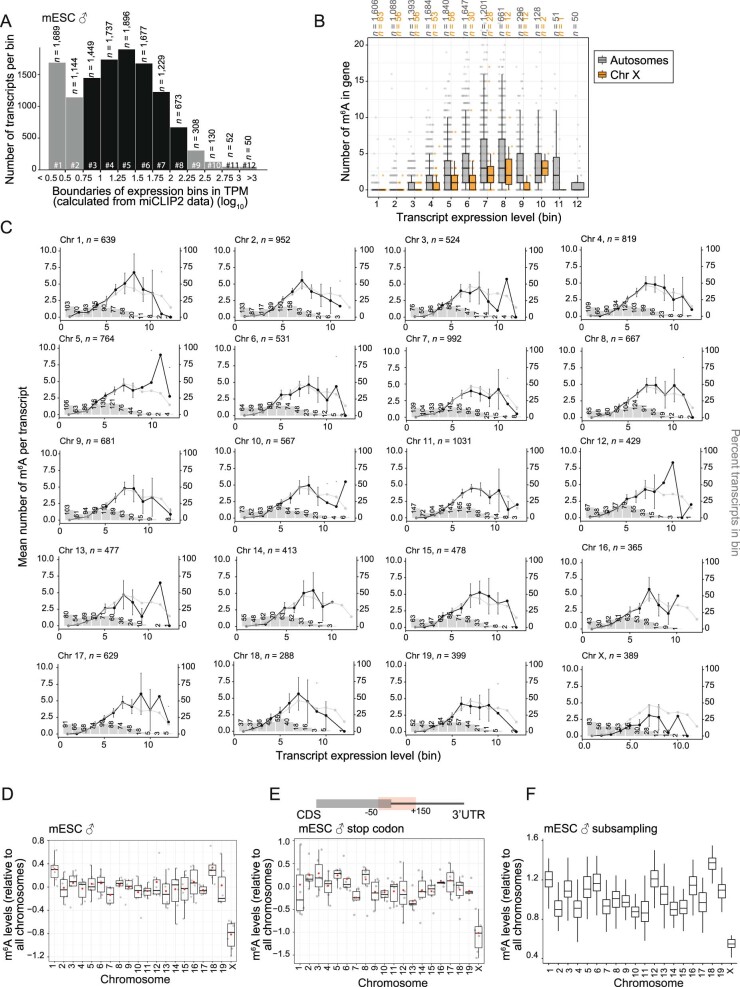
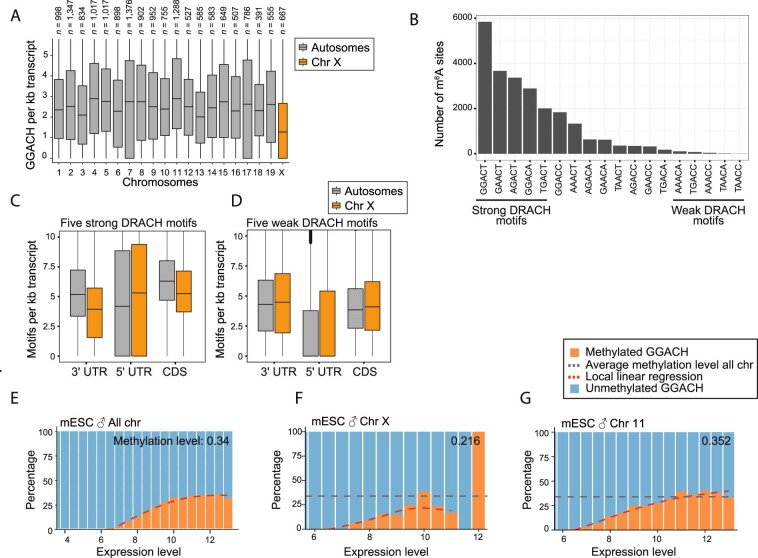
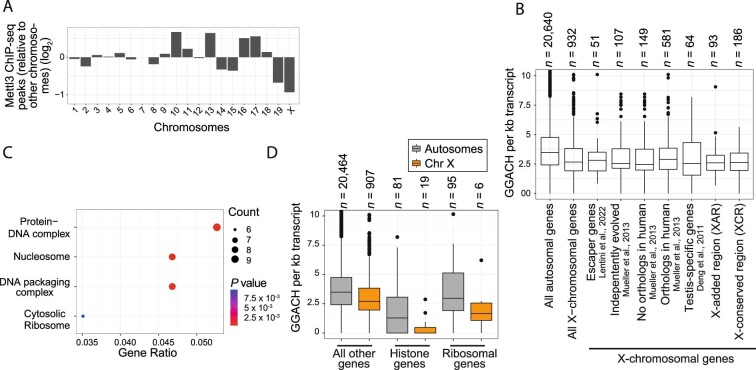
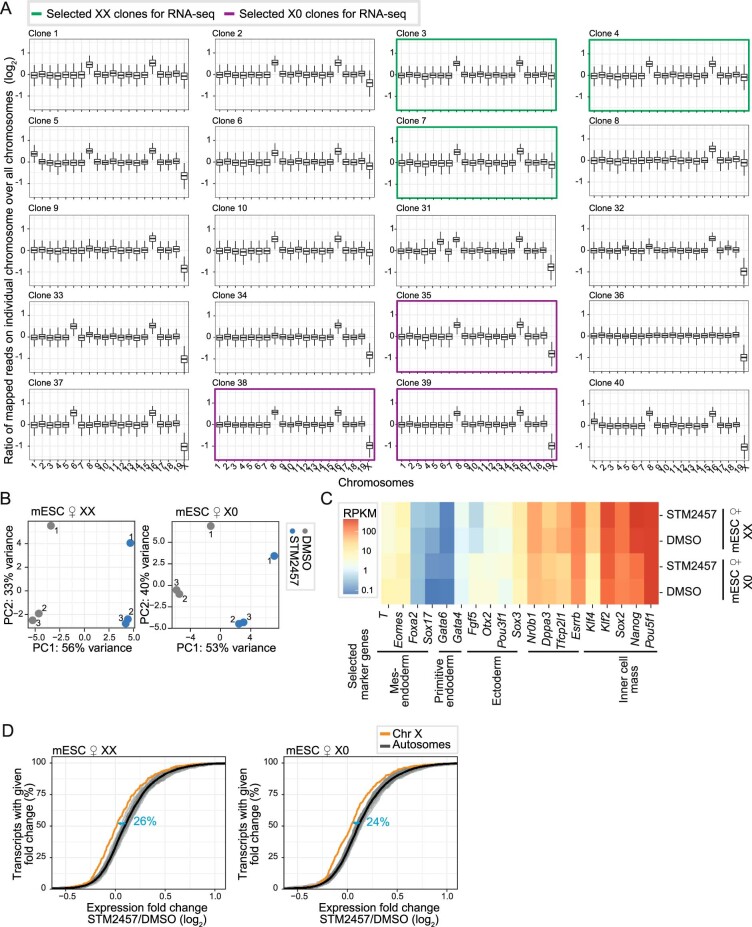
In mammals, X-chromosomal genes are expressed from a single copy since males (XY) possess a single X chromosome, while females (XX) undergo X inactivation. To compensate for this reduction in dosage compared with two active copies of autosomes, it has been proposed that genes from the active X chromosome exhibit dosage compensation. However, the existence and mechanisms of X-to-autosome dosage compensation are still under debate. Here we show that X-chromosomal transcripts have fewer m6A modifications and are more stable than their autosomal counterparts. Acute depletion of m6A selectively stabilizes autosomal transcripts, resulting in perturbed dosage compensation in mouse embryonic stem cells. We propose that higher stability of X-chromosomal transcripts is directed by lower levels of m6A, indicating that mammalian dosage compensation is partly regulated by epitranscriptomic RNA modifications.


Conflict of interest statement

O.R. is an employee of STORM Therapeutics Ltd. The other authors declare that they have no competing interests.

Figures

Fig. 1
Fig. 1. X-chromosomal transcripts are more stable upon m6A depletion.
a, Experimental setup for the SLAM-seq experiment. b,c, Transcripts (n = 7,310) in control (b) and m6A-depleted conditions (c) show a median half-life (t1/2) of 3.2 h and 3.5 h, respectively (P value = 5.25 × 10⁻²⁹, two-tailed Wilcoxon signed-rank test). Median s4U content for all transcripts is shown in black. d, Transcripts with m6A sites have significantly shorter half-lives (P value = 2.17 × 10⁻¹⁸, two-tailed Wilcoxon rank-sum test). Cumulative fractions of transcripts with given half-lives for transcripts with (n = 2,342, green) or without (n = 4,967, black) m6A sites. e, Transcripts with m6A sites (n = 2,342) significantly increase in half-life upon m6A depletion (8% median increase, P value = 1.07 × 10–61, two-tailed Wilcoxon signed-rank test), unmethylated transcripts (n = 4,967) were largely unaffected (0.3% median decrease, P value = 3.186 × 10⁻⁵) (same gene set in both conditions). The mean half-life in each group is shown as a red dot. Boxes represent quartiles, center lines denote medians, and whiskers extend to most extreme values within 1.5 × interquartile range. f, Half-lives of autosomal transcripts significantly increase upon m6A depletion (P value = 3.03 × 10⁻³¹, two-tailed Wilcoxon signed-rank test), while X-chromosomal transcripts remain unchanged (P value = 0.2121, two-tailed Wilcoxon signed-rank test). Distribution of half-lives for autosomal (n = 7,069) and X-chromosomal transcripts (n = 241) (same gene set in both conditions). The mean half-life in each group is shown as a red dot. Boxes are as in e. g, Median fold change (FC) in mRNA half-lives (log2) for each chromosome in m6A-depleted (STM2457) over control (DMSO) conditions. X-chromosomal transcripts show the lowest half-life increase upon m6A depletion (P value = 0.005486, mean difference in log2(fold change) values = –0.0945, linear mixed model, two-tailed t-test on fixed effects, see Methods). h, Median fold change (log2) in mRNA half-lives for each chromosome in Mettl3 KO over WT mESCs (P value = 0.000225, X-chromosomal versus autosomal transcripts, mean difference in log2-transformed fold changes = −0.22057). The absolute differences between m6A depletion and Mettl3 KO conditions may result from differences in the experimental setup, including the mode of Mettl3 inactivation and the method used to determine transcript half-lives. Source data
Fig. 2
Fig. 2. X-chromosomal transcripts are more stable and less upregulated upon m6A depletion.
a, X-chromosomal transcripts are less upregulated upon m6A depletion in male mESCs (P value = 1.86 × 10⁻¹⁷, two-tailed Wilcoxon rank-sum test). The cumulative fraction of transcripts (RPKM > 1) on individual autosomes (gray) and the X chromosome (orange) that show a given expression fold change (log2, RNA-seq) upon m6A depletion (STM2457, 24 h). Mean expression changes for all autosomes are shown as a black line. Effect sizes (blue) show the shift in medians, expressed as percentage of the average interquartile range (IQR) of autosomal and X-chromosomal genes (see Methods). b, X:A expression ratios show a significant reduction upon m6A depletion (P = 1.4 × 10⁻¹⁵, two-tailed t-test of linear contrasts in mixed effect Gaussian model in log scale). c, Differential effects on autosomal and X-chromosomal transcripts already occur after 6 h of m6A depletion. Median fold changes (log2) of transcripts from autosomes (n = 19, gray) and the X chromosome (n = 1, orange) estimated by RNA-seq at different time points of m6A depletion (STM2457, 3, 6, 9 and 12 h). Boxes represent quartiles, center lines denote medians, and whiskers extend to most extreme values within 1.5 × interquartile range. d, Same as a, for human primary fibroblasts (STM2457, 9 h). P value = 6.24 × 10⁻⁶, two-tailed Wilcoxon rank-sum test. Effect sizes are shown as the shift in medians of the two distributions, expressed as percentage of the average IQR of autosomal and X-chromosomal genes (see Methods). e, Same as b, for human cell lines (P value = 0.0000803 (human fibroblasts), P value = 0.0000379 (HEK293T), P value = 0.0003284 (C643), P value = 0.0002982 (RPE1). P values were calculated as in a, with multiple testing correction. Source data
Fig. 3
Fig. 3. m6A sites are reduced on transcripts from the X chromosome.
a, The number of detected m6A sites varies with expression level. Mean m6A sites per transcript were quantified for transcripts in each expression bin (n = 12,034 transcripts, see Extended Data Fig. 6a for n in each bin). Error bars indicate the 95% confidence interval. b, X-chromosomal transcripts harbor fewer m6A sites across expression levels. Transcripts from the X chromosome (orange, n = 389 transcripts) compared with the mean of all chromosomes (gray). The numbers of transcripts in expression bins are shown in Extended Data Figure 6c. Significance values for bins 3–8 are indicated by asterisks (autosomes versus X chromosome, two-tailed Wald tests in a generalized linear model for negative binomial data, multiple testing correction; n.s., not significant; *P value < 0.05, **P value < 0.01). c, The m6A content of transcripts from chromosome 11 (n = 1,031 transcripts) follows the mean of all chromosomes across all expression levels. Transcripts from chromosome 11 (black) compared with the mean of all chromosomes (gray). Analyses for individual chromosomes are shown in Extended Data Figure 6c. dg, X-chromosomal transcripts have significantly fewer m6A sites in male mESCs (P = 4.1 × 10⁻⁹, generalized linear model for negative binomial data) (d), published m6A-seq2 data from mESCs (e), mouse heart samples (P = 8.34 × 10⁻¹¹) and macrophages (P value = 1.38 × 10⁻⁸) (f), and human HEK293T (P = 0.000203) and C643 cell lines (P value = 0.001030) (g). Mean fold change (log2) of m6A sites per transcript on respective chromosomes relative to all chromosomes (Extended Data Fig. 6d). For mouse data, transcripts of intermediate expression (bins 3–8) are used. For HEK293T data, bins 4–9 were used, and for C643 data, bins 5–10 were used. X-chromosomal and autosomal transcripts are shown in gray and orange, respectively. Chromosomes 11 and X are labeled, for comparison with b and c. P values for comparisons of autosomal versus X-chromosomal transcripts are as in b. Source data
Fig. 4
Fig. 4. Reduced m6A levels on X-chromosomal transcripts are intrinsically encoded.
a, GGACH motifs (normalized to region length) in different transcript regions of autosomal (gray) and X-chromosomal transcripts (orange) in mouse (P value = 1.38 × 10⁻²⁹ (CDS, n = 16,631 annotations), P value = 1.06 × 10–40 (3′ UTR, n = 16,484 annotations) and 0.2707 (5′ UTR, n = 16,490 annotations), two-tailed Wilcoxon rank-sum test). b, Methylation levels of GGACH motifs are slightly reduced on X-chromosomal transcripts. Fraction of m6A sites per chromosome with methylation in miCLIP2 data from male mESCs. Boxes represent quartiles, center lines denote medians, and whiskers extend to most extreme values within 1.5 × interquartile range. c, Location of mouse X-chromosomal orthologs in human, opossum (Monodelphis domestica), and chicken. d, Percentage of orthologs of X-chromosomal or autosomal genes in mouse that are located on autosomes or sex chromosomes in human, opossum, and chicken. e, GGACH motifs in transcripts (exons) from mouse genes and corresponding orthologs in chicken, opossum, and human (n = 6,520). Orthologs to mouse X-chromosomal and autosomal genes are indicated in orange and gray, respectively (two-tailed Wilcoxon rank-sum test, *P value < 0.05, **P value < 0.01, ***P value < 0.001, P value = 1.2 × 10⁻¹⁸ (mouse), 2.7 × 10⁻⁶ (human), 0.001227 (opossum), 0.8602 (chicken)). Boxes are as in a. f, Effects of m6A depletion on expression of autosomal and X-chromosomal transcripts in XX and X0 clones of female mESCs (P value = 1.64 × 10⁻¹² and 3.5 × 10⁻¹¹, respectively, two-tailed Wilcoxon rank-sum test, Extended Data Fig. 9a–c). Median fold changes (log2) of transcripts from autosomes (n = 19, gray) and the X chromosome (n = 1, orange), estimated by RNA-seq after m6A depletion (STM2457, 9 h). Boxes are as in a. g, X:A expression ratios are significantly reduced upon m6A depletion (P value = 4.12 × 10⁻¹⁵ (mESC), P value = 2.06 × 10⁻¹¹ (female mESC XX), P value = 1.08 × 10⁻¹⁰ (female mESC X0). P values are as in Figure 2b, multiple testing correction). h, Median fold change (log2) of m6A sites per transcript on each chromosome relative to all chromosomes (P = 0.0018, autosomal (gray) versus X-chromosomal (orange) transcripts, two-tailed Wald test in generalized linear mixed model for negative binomial data). Source data
Fig. 5
Fig. 5. The role of m6A in X-to-autosome dosage compensation.
m6A acts as a selective degradation signal on autosomal transcripts and thereby contributes to X-to-autosome dosage compensation. Transcripts from the autosomes are transcribed from two active chromosomes, leading to higher transcript copy numbers per autosomal gene than for X-chromosomal genes. m6A is selectively enriched on transcripts from autosomes, leading to their destabilization and degradation. Because m6A is not enriched on X-chromosomal transcripts, this leads to an equal dosage between autosomal and X-chromosomal transcripts. m6A thereby contributes to X-to-autosome dosage compensation.
Extended Data Fig. 1
Extended Data Fig. 1. Mettl3 inhibitor treatment of mouse embryonic stem cells (mESC) depletes m6A levels.
a. X-chromosomal transcripts are more stable than autosomal transcripts (median half-life = 3.72 h [autosomes] vs. 4.35 h [X chromosome], P value = 1.02e-05, two-sided Wilcoxon rank-sum test). Distribution of half-lives from published SLAM-seq data for mESC for transcripts on each individual chromosome. Dashed red line and red box indicate median and inter-quartile range of X-chromosomal transcripts, respectively, for comparison. Boxes represent quartiles, centre lines denote medians, and whiskers extend to most extreme values within 1.5× interquartile range. b. Time course experiments shows that treatment of male mESC with the Mettl3 inhibitor (STM2457, 20 µM) results in a gradual reduction of m6A levels on mRNAs. m6A levels were measured by liquid chromatography-tandem mass spectrometry (LC-MS/MS) for poly(A) + RNA from m6A-depleted (STM2457, 3–24 h) and control conditions. Quantification of m6A as percent of A in poly(A) + RNA. n = 2 independent biological replicates. c. Expression levels of marker genes confirm the pluripotent state of the male mESC throughout the time course experiment. Gene expression levels (RNA-seq) are shown as reads per kilobase of transcript per million mapped reads (RPKM, mean over all replicates, log10) in m6A-depleted (STM2457, 3–24 h) and control conditions. d. Quantitative real-time PCR (qPCR) to quantify expression changes of stem cell marker genes in m6A-depleted (STM2457, 9 h) and control conditions. Normalised CT values (∆CT, normalised to Gapdh expression) are compared between conditions. Fold changes are displayed as mean s.d.m., two-sided Student’s t-test on log2-transformed data, n = 4 independent biological samples, ns, not significant. P value = 0.8 [Sox2]; 0.96 [Nanog]. Source data
Extended Data Fig. 2
Extended Data Fig. 2. SLAM-seq measures mRNA half-lives in mESC.
a. Cell viability assessed for male mESC cultured with s4U for 2 ± 4 h in varying concentrations (x-axis, log2-transformed). Viability of labelled cells in relation to unlabelled cells is shown as mean ± s.d.m., n = 3 biologically independent samples. IC10,24h is indicated as dashed line. b. Principal component analysis of SLAM-seq replicates based on numbers of reads with T-to-C conversions. Principal component (PC) 1 and PC2 (left) separate the different timepoints of the experiment (colours), PC3 and PC4 (right), separate control and m6A-depleted conditions (symbols). c. T-to-C conversions on T’s by the overall T coverage per 3′ UTR. Maximum s4U rate is achieved after 24 h of labelling (T0) and steadily decreases after s4U washout and uridine chase (T1-T7). Unlabelled samples (No s4U) are shown for comparison. n = 21,527 UTRs with incorporation rates per replicate. Boxes represent quartiles, centre lines denote medians, and whiskers extend to most extreme values within 1.5× interquartile range. d. Expression estimates based on log10-transformed coverage on T’s per 3′ UTR (mean over all replicates and timepoints per condition). Only 3′ UTRs with SLAM-seq reads covering at least 100T’s (indicated by dotted line) were used for subsequent fitting. e. Cumulative distribution of the goodness-of-fit (residual standard error, RSE) of half-lives calculated from SLAM-seq data. Dotted lines indicate filtering cut-off (RSE > 0.3). f. Correlation of half-lives determined in this study (male mESC, control condition) with previously published half-lives in male mESC (two-sided Pearson correlation coefficient [R] = 0.8, P value < 2.2e-16). g. Distribution of half-lives of transcripts on individual chromosomes in control (left) or m6A-depleted conditions (right). In control conditions, half-lives of X-chromosomal transcripts differ significantly from autosomal transcripts (median half-life 3.19 h [autosomes] vs. 3.57 [X chromosome], P value = 7.63e-05, two-sided Wilcoxon rank-sum test). In m6A-depleted conditions, autosomal transcript half-lives approximate X-chromosomal transcript half-lives in control conditions (P value = 0.06228, two-sided Wilcoxon rank-sum test). Red lines and boxes indicate median and interquartile range, respectively, of half-lives of X-chromosomal transcripts in control conditions. Boxes as in c. Source data
Extended Data Fig. 3
Extended Data Fig. 3. RNA-seq upon m6A depletion reveals upregulation of autosomal but not X-chromosomal transcripts.
a. Principal component analysis indicates high reproducibility of RNA-seq data for male mESC in control and m6A-depleted conditions (STM2457, 24 h, 4 replicates per condition, total of 398 million uniquely mapped reads). Replicate number given next to each data point. b. Correlation of expression fold changes (log2) of RNA seq data in m6A-depleted (STM2457, 24 h) over control conditions using normalisation to ERCC spike-ins (x-axis) or 100 randomly chosen genes without m6A sites (y-axis, see Methods; two-sided Pearson correlation coefficient [R] = 1, P value < 2.2e-16). c. Upregulation upon m6A depletion increases with the number of m6A sites in the transcripts. Distribution of fold changes (log2) in m6A-depleted (STM2457, 24 h) over control conditions in expressed transcripts (transcripts per million [TPM] > 1, based on total miCLIP2 signal) stratified by their number of m6A sites. Numbers of transcripts in each category are indicated above. Boxes represent quartiles, centre lines denote medians, and whiskers extend to most extreme values within 1.5× interquartile range. d. Cumulative distribution of expressed autosomal (grey) and X-chromosomal (orange) transcripts (RPKM > 1) with a given expression level (RPKM, x-axis). The expression distributions of X-chromosomal and autosomal transcripts are largely identical, supporting a X:A ratio close to 1 across the full expression range. For comparison, a theoretical doubling of the X-chromosomal expression is shown (orange, dotted) which would exceed autosomal expression levels. e. Median X-to-autosome (X:A) expression ratios increase with higher RPKM cut-offs (>0, n [genes] = 26,291, ≥0.25, n = 13,795, ≥0.5, n = 12,255, ≥1, n = 10,849). Median X:A ratios for male mESC and 95% confidence intervals are given. Source data
Extended Data Fig. 4
Extended Data Fig. 4. Time-course RNA-seq upon m6A depletion reveals upregulation of autosomal genes after 6 h of inhibitor treatment.
a. Principal component analyses of RNA-seq replicates of control and m6A-depleted male mESC at different time points (STM2457, 3–12 h) based on numbers of reads or the 500 genes with highest variance across all samples for a given time point. Replicate number given next to each data point. b. After 6 h of m6A depletion, X-chromosomal transcripts show significantly lower fold changes (log2) compared to autosomal transcripts (P value = 0.48 [3 h], P value = 1.02e-12 [6 h], P value = 5.12e-10 [9 h], P value = 1.69e-08 [12 h], two-sided Wilcoxon rank-sum test). Cumulative fraction of transcripts on individual autosomes (grey) and the X chromosome (orange) that show a given expression fold change (log2, RNA-seq) at different timepoints of m6A depletion (STM2457, 3–12 h) in male mESC. Mean expression changes for all autosomes are shown as black line. Effect sizes (blue) show the shift in medians, expressed as percent of the average interquartile range (IQR) of autosomal and X-chromosomal genes (see Methods). c. qPCR to quantify expression changes of five autosomal (left) and five X-chromosomal (right) transcripts in control and m6A-depleted (STM2457, 9 h) male mESC cells. Normalised CT values (∆CT, normalised to Gapdh expression) are compared between conditions. Fold changes are displayed as mean ± s.d.m., two-sided Student’s t-test on log2-transformed data, n = 4 biologically independent samples, *P value < 0.05, **P value < 0.01, ***P value < 0.001, ns, not significant. P value = 0.00017 [Rab11fip5], 8.57e-07 [Tubb3], 8.08e-08 [Phax], 0.049 [Faap100], 1.46e-06 [Tstp2]; 0.56 [Itm2a], 0.001 [Hnrnph2], 0.95 [Ssr4], 0.007 [Plp1], 0.01 [Fmr1]. Source data
Extended Data Fig. 5
Extended Data Fig. 5. RNA-seq upon m6A depletion reveals upregulation of autosomal transcripts in human cell lines.
a. Principal component analyses for replicates of RNA-seq experiments under m6A-depleted and control conditions for human primary fibroblasts (STM2457, 9 h), HEK293T cells, C643 cells and RPE1 cells (STM2457, 24 h). Replicate number given next to each data point. b. X-chromosomal transcripts show significantly lower fold changes upon m6A depletion than autosomal transcripts (P value = 6.92e-06 [HEK293T, n = 12,856 of autosomal transcripts, n = 443 of X-chromosomal transcripts], P value = 4.53e-05 [C643, n = 11,109 of autosomal transcripts, n = 383 of X-chromosomal transcripts], P value = 0.0001901 [RPE1, n = 10,732 of autosomal transcripts, n = 347 of X-chromosomal transcripts], Wilcoxon rank-sum test). Cumulative fraction of transcripts on individual autosomes (grey) and the X chromosome (orange) that show a given fold change (log2) in m6A-depleted (STM2457, 24 h) over control conditions for HEK293T, C643, and RPE1 cells. Mean expression changes for all autosomes are shown as black line. Effect sizes (blue) shown the shift in medians, expressed as percent of the average IQR of autosomal and X-chromosomal genes (see Methods). Source data
Extended Data Fig. 6
Extended Data Fig. 6. X-chromosomal transcripts harbour less m6A sites than autosomal transcripts in male mESC.
a. Transcripts were stratified into 12 bins (#1–12) according to their expression in male mESC (transcripts per million [TPM, log10], see Methods). x-axis depicts boundaries between bins (in TPM). Bin number (#) and number of transcripts therein are given below and above each bar, respectively. Bins #3–8 that were used for quantifications of m6A sites per transcripts are highlighted in black. b. Quantification of m6A for each transcript in the different expression bins of autosomal (grey) and X-chromosomal (orange) transcripts. Boxes represent quartiles, centre lines denote medians, and whiskers extend to most extreme values within 1.5× interquartile range. c. Quantification of m6A sites per transcript for all mouse chromosomes. Data points indicate mean number of m6A sites per transcript and 95% confidence interval (left y-axis) in each expression bin (x-axis, bins as defined in a) for all chromosomes (chromosome name and total number of expressed transcripts given above). Grey bars indicate the percentage of transcripts in each expression bin (right y-axis) relative to all expressed transcripts on the chromosome. Absolute numbers of transcripts in each bin are given above the bars. Only genes with a mean TPM > 1 over all samples were considered. d. Fold change (log2, grey dots) in mean m6A sites per transcripts for expression bins #3–8 (n of mean of expression bins = 6) on an individual chromosome over the mean m6A sites per transcripts across all chromosomes. Red dots indicate mean fold change of the six bins on the given chromosome. Boxes as in b. e. Same as d. using only m6A sites in a fixed window around stop codons (−50 nt to +150 nt) to exclude confounding effects of transcript length differences. Boxes as in b. f. Same as c. after randomly subsampling n = 30 genes from expression bins #3–5 to exclude potential biases from different numbers of transcripts in the expression bins for each chromosome. Shown is the distribution of mean m6A sites per transcript for each chromosome from 100 repeats of subsampling. Boxes as in b. Source data
Extended Data Fig. 7
Extended Data Fig. 7. The number of GGACH motifs and their methylation level are reduced on X-chromosomal transcripts compared to autosomal transcripts.
a. X-chromosomal transcripts harbour fewer GGACH motifs than autosomal transcripts. Distribution of GGACH (H=[A|C|U]) per kilobase (kb) transcript sequence for individual chromosomes (corresponding to Fig. 4a). Boxes represent quartiles, centre lines denote medians, and whiskers extend to most extreme values within 1.5× interquartile range. b. Distribution of m6A sites from mESC miCLIP2 data across different DRACH motifs. Barplot shows the number of m6A sites for a given type of DRACH motif in mESC. The five most often methylated (‘strong’) and least often methylated (‘weak’) DRACH motifs are labelled below. c. Autosomal transcripts harbour more frequently methylated DRACH motifs in CDS and 3′ UTR. Quantification of strong DRACH motifs in different transcript regions (normalised to region length) of autosomal (grey) and X-chromosomal transcripts (orange) in mouse. CDS n of annotations = 16,631, 3‘ UTR n of annotations = 16,484 and 5′ UTR n of annotations = 16,490. Boxes as in a. d. Autosomal transcripts harbour similar numbers of the least methylated DRACH motifs (‘weak’) in CDS and 3′ UTR. Quantification of the five least methylated DRACH motifs as in (C.). CDS n of annotations = 16,631, 3‘ UTR n of annotations = 16,484 and 5′ UTR n of annotations = 16,490. Boxes as in a. e-g. The methylation level of GGACH motifs in male mESC, that is, the percentage of GGACH motifs that are methylated, is slightly reduced in X-chromosomal transcripts (f), compared to transcripts across all chromosomes (e) or from chromosome 11 (g). To take into account only GGACH motifs in transcript regions with sufficient expression, GGACH motifs in transcripts were stratified into bins by the local miCLIP2 read coverage (see Methods) and overlayed with m6Aboost-predicted m6A sites from the same data. Dashed red line indicates local linear regression to estimate the methylation level (shown in Fig. 4b), that is, the point at which the slope drops below 0.01. Dashed grey lines in f and g show estimated GGACH methylation level for transcripts across all chromosomes (e) for comparison. Source data
Extended Data Fig. 8
Extended Data Fig. 8. The number of GGACH motifs is reduced on transcripts encoding histones and ribosomal proteins.
a. The X chromosome harbours fewer Mettl3 ChIP-seq peaks. The number of published ChIP-seq peaks (normalised by chromosome length) per chromosome relative to peaks on all other chromosomes (log2). b. Different gene sets on the X-chromosome are similarly depleted in GGACH motifs. Quantification of GGACH motifs of all autosomal or X-chromosomal genes is compared to the following gene sets: escaper genes, independently evolved genes, genes with or without orthologs on the human X chromosome, testis-specific genes or genes residing in the X-added region (XAR) and X-conserved region (XCR). Numbers of genes are given in the figure (n). Boxes represent quartiles, centre lines denote medians, and whiskers extend to most extreme values within 1.5× interquartile range. c. X-chromosomal genes with low GGACH motif numbers are associated with DNA packaging or the cytosolic ribosome. Gene ontology (GO) enrichment analysis of the 200 genes with the lowest density of GGACH motifs on the X chromosome. P values were calculated by overrepresentation analysis (see Methods). d. Histone and ribosomal protein-encoding genes on the X chromosome are depleted in GGACH motifs. Quantification of GGACH motifs for histone-encoding and ribosomal protein-encoding genes on autosomes or on the X chromosome. Numbers of genes are given in the figure (n). Boxes as in b. Source data
Extended Data Fig. 9
Extended Data Fig. 9. X-chromosomal and autosomal transcripts differ in their response to m6A depletion in both XX or X0 clones of female mESC.
a. The majority of clones lost one copy of the X chromosome (X0). 20 single colonies of female mESC were picked and cultured under standard conditions until confluency was reached. To determine chromosome copy number, DNA-seq reads were counted into 100 kb bins along the chromosome and divided by the median mapped reads of all bins along the genome. Shown is the distribution of the resulting ratios for the bins on each chromosome. Six clones that were selected for RNA-seq in control and m6A-depleted (STM2457, 9 h) condition are highlighted in green. Boxes represent quartiles, centre lines denote 50th percentiles (medians), and whiskers extend to most extreme values within 1.5× interquartile range. b. Principal component analysis of RNA-seq replicates from female X0 (left) and XX (right mESC clones under m6A-depleted (STM2457, 9 h) and control conditions. Analysis based on numbers of reads for the 500 genes with highest variance across all samples. c. Expression levels (RNA-seq) of marker genes confirm the pluripotent state of the female XX and X0 mESC under m6A-depleted (STM2457, 9 h) and control conditions. Expression is shown as RPKM (mean over replicates, log10). d. X-chromosomal transcripts are less upregulated than autosomal transcripts upon m6A depletion in female X0 and XX mESC (P value = 3.51e-11 [mESC X0], P value = 1.64e-12 [mESC XX], two-sided Wilcoxon rank-sum test). Cumulative fraction of transcripts (RPKM > 1) on individual autosomes (grey) and the X chromosome (orange) that show a given expression fold change (log2, RNA-seq) upon m6A depletion (STM2457, 9 h). Mean expression changes for all autosomes are shown as black line. Effect sizes (blue) shown the shift in medians, expressed as percent of the average IQR of autosomal and X-chromosomal transcripts (see Methods). Source data

References

    1. Graves JA. Evolution of vertebrate sex chromosomes and dosage compensation. Nat. Rev. Genet. 2016;17:33–46. doi: 10.1038/nrg.2015.2. - DOI - PubMed
    1. Lyon MF. Gene action in the X-chromosome of the mouse (Mus musculus L.) Nature. 1961;190:372–373. doi: 10.1038/190372a0. - DOI - PubMed
    1. Ohno, S. Sex Chromosomes and Sex-Linked Genes (Springer, 1966).
    1. Yildirim E, Sadreyev RI, Pinter SF, Lee JT. X-chromosome hyperactivation in mammals via nonlinear relationships between chromatin states and transcription. Nat. Struct. Mol. Biol. 2011;19:56–61. doi: 10.1038/nsmb.2195. - DOI - PMC - PubMed
    1. Deng X, et al. Evidence for compensatory upregulation of expressed X-linked genes in mammals, Caenorhabditis elegans and Drosophila melanogaster. Nat. Genet. 2011;43:1179–1185. doi: 10.1038/ng.948. - DOI - PMC - PubMed

Publication types