. 2023 Jul;24(7):1149-1160.
doi: 10.1038/s41590-023-01503-3. Epub 2023 May 18.

Conserved stromal-immune cell circuits secure B cell homeostasis and function

Affiliations

Conserved stromal-immune cell circuits secure B cell homeostasis and function

Mechthild Lütge et al. Nat Immunol. 2023 Jul.

Abstract

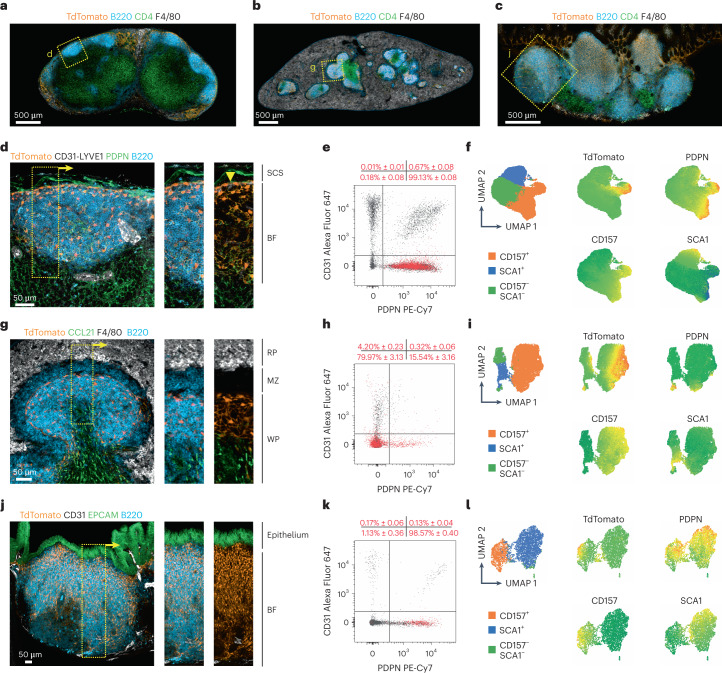
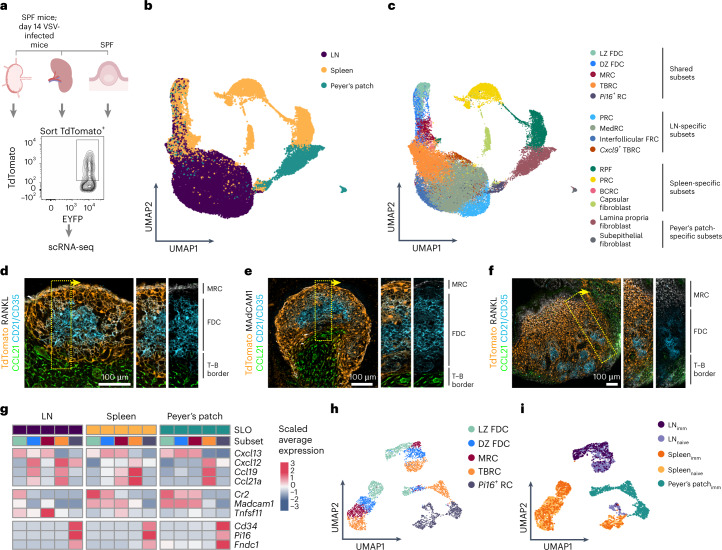
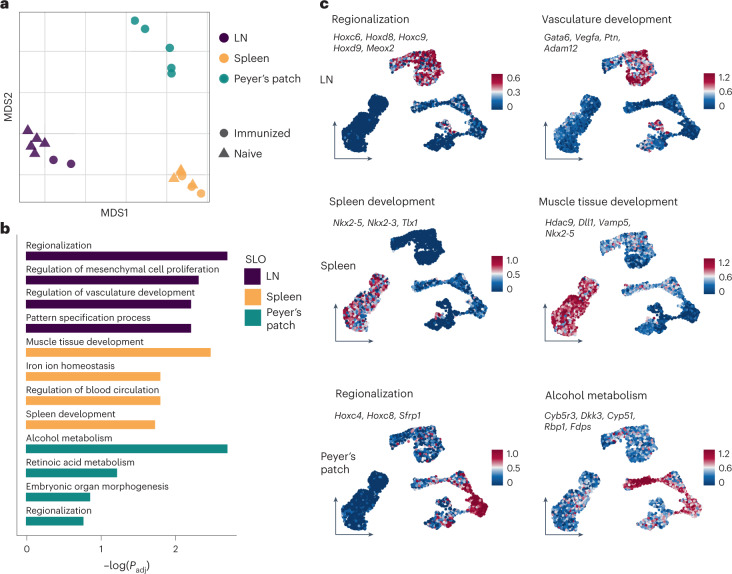
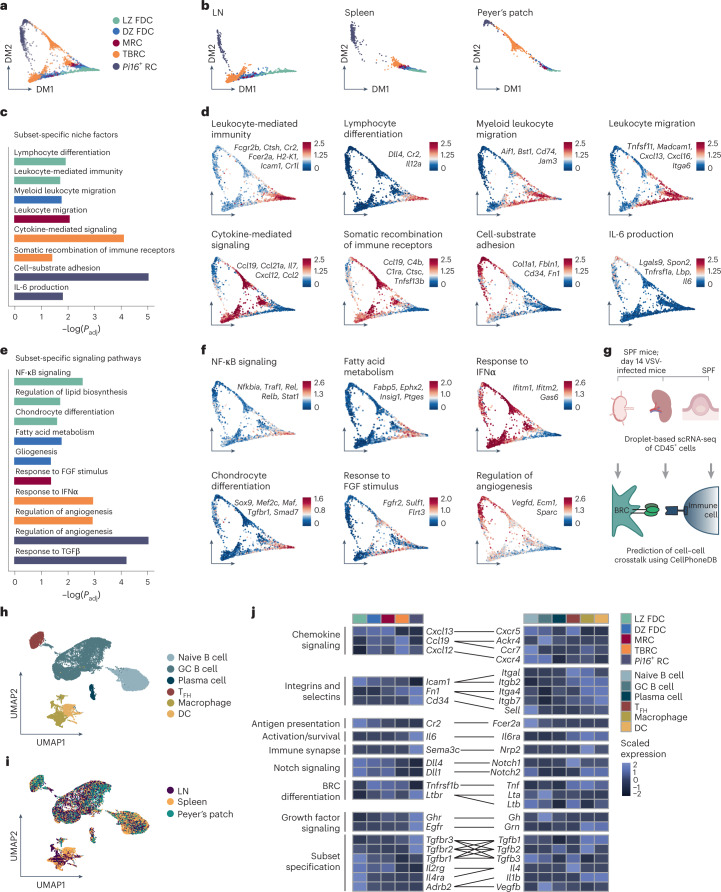
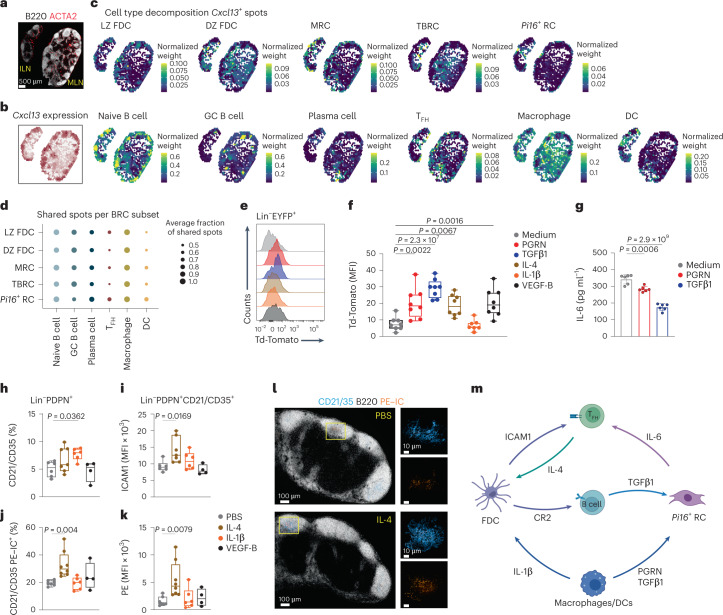
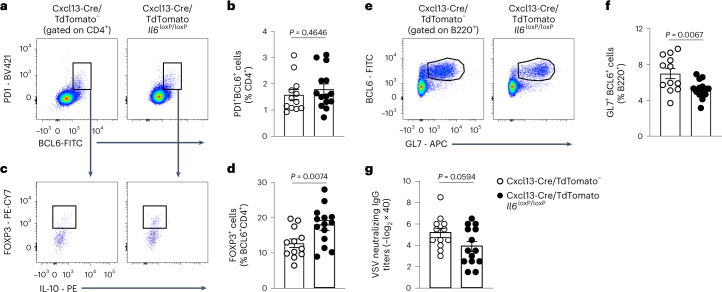
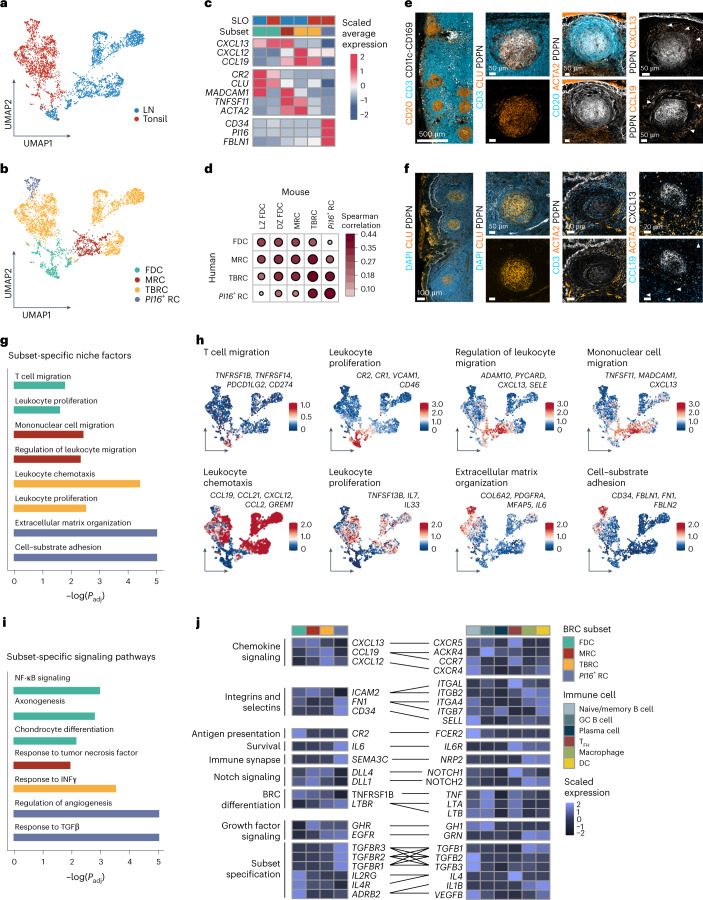
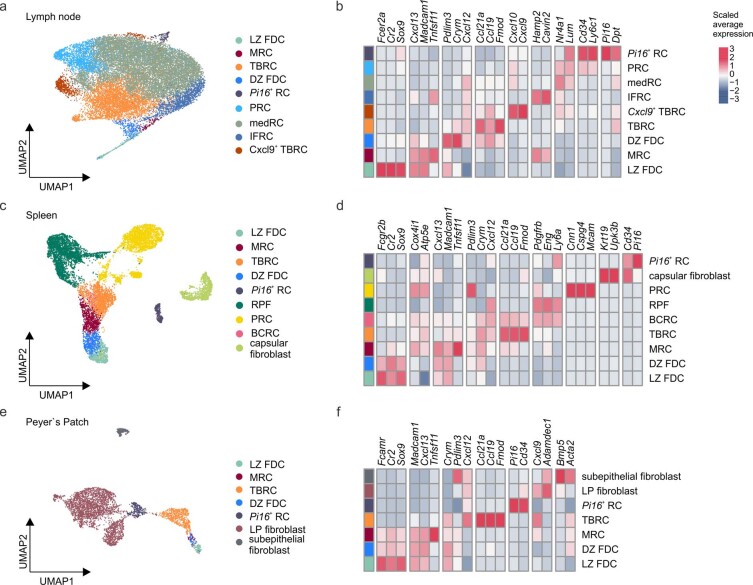
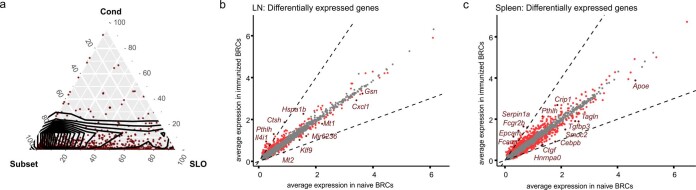
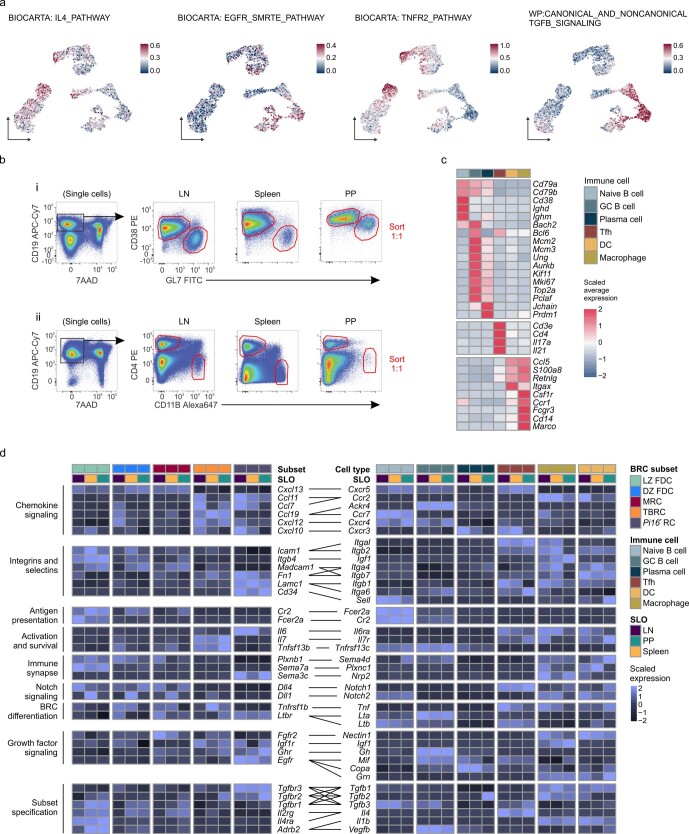
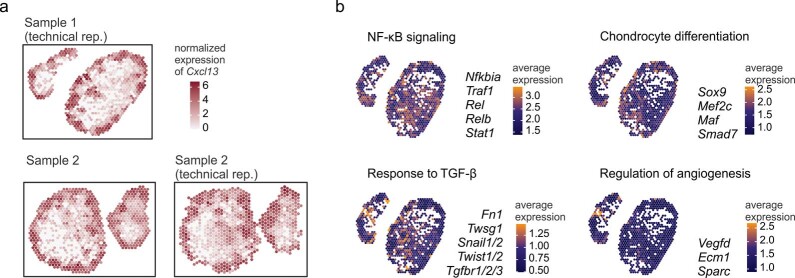
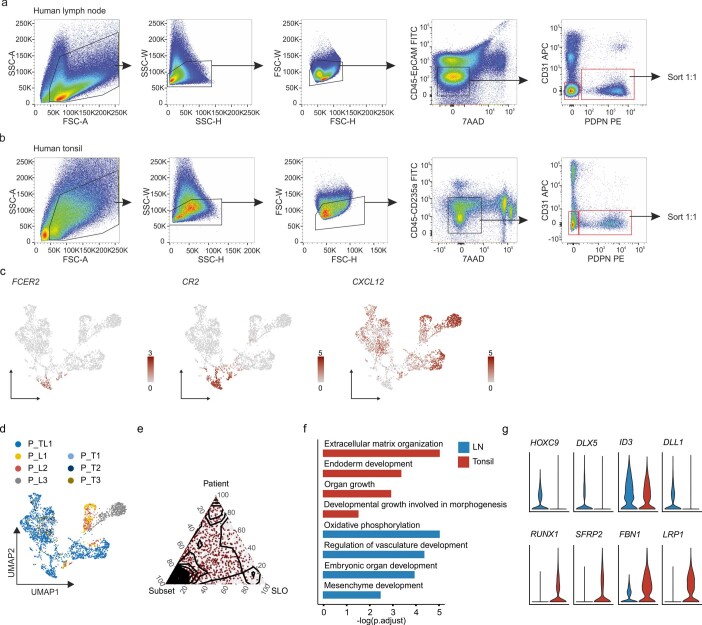
B cell zone reticular cells (BRCs) form stable microenvironments that direct efficient humoral immunity with B cell priming and memory maintenance being orchestrated across lymphoid organs. However, a comprehensive understanding of systemic humoral immunity is hampered by the lack of knowledge of global BRC sustenance, function and major pathways controlling BRC-immune cell interactions. Here we dissected the BRC landscape and immune cell interactome in human and murine lymphoid organs. In addition to the major BRC subsets underpinning the follicle, including follicular dendritic cells, PI16+ RCs were present across organs and species. As well as BRC-produced niche factors, immune cell-driven BRC differentiation and activation programs governed the convergence of shared BRC subsets, overwriting tissue-specific gene signatures. Our data reveal that a canonical set of immune cell-provided cues enforce bidirectional signaling programs that sustain functional BRC niches across lymphoid organs and species, thereby securing efficient humoral immunity.


Conflict of interest statement

C.P.-S., C.G.-C., H.-W.C., L.O., N.B.P. and B.L. are founders and shareholders of Stromal Therapeutics. L.O. and B.L. are members of the board of Stromal Therapeutics. The other authors declare no competing interests.

Figures

Fig. 1
Fig. 1. Anatomical heterogeneity of Cxcl13-Cre+ BRC landscapes across SLOs.
ac, Representative immunofluorescence images of ILNs (a), spleen (b) and Peyer’s patches (c) from naive Cxc13-Cre/TdTomato EYFP mice. Immunostaining for B220, CD4 and F4/80 demarcated leukocyte compartments and TdTomato identified Cxcl13-Cre transgene expression. d, Representative immunofluorescence images of the BRC network in an ILN primary BF, with the SCS, BF and lymphatics (arrowhead) demarcated. e,f, Flow cytometry analysis of non-hematopoietic Cxcl13-Cre/TdTomato-targeted cells in the ILNs of naive Cxcl13-Cre/TdTomato EYFP mice (e) and relative expression of TdTomato, PDPN, CD157 and SCA1 by TdTomato+ cells (f). g, Representative immunofluorescence images of the BRC network in the splenic WP BF, with the RP, marginal zone (MZ) and WP regions indicated. h,i, Flow cytometry analysis of non-hematopoietic Cxcl13-Cre/TdTomato-targeted cells in the spleens of naive Cxcl13-Cre/TdTomato EYFP mice (h) and the relative expression of TdTomato, PDPN, CD157 and SCA1 by TdTomato+ cells (i). j, Representative immunofluorescence images of the BRC network in Peyer’s patches with the epithelium and BF demarcated. k,l, Flow cytometry analysis of non-hematopoietic Cxcl13-Cre/TdTomato-targeted cells in Peyer’s patches of naive Cxcl13-Cre/TdTomato EYFP mice (k) and the relative expression of TdTomato, PDPN, CD157 and SCA1 by TdTomato+ cells (l). In ac,d,g,j data are representative of at least six mice. In e,f,h,i,k,l n = 6 from two independent experiments. In e,h,k TdTomato+ BRC subsets were quantified according to CD31 and PDPN expression; data are shown as the mean ± s.e.m.
Fig. 2
Fig. 2. BRC and Pi16+ RC subsets are shared across SLOs.
a, Schematic representation of TdTomato+ cell isolation from LNs, spleen and Peyer’s patches from either specific pathogen-free (SPF) mice or day 14 VSV-infected mice for scRNA-seq. b,c, Uniform manifold approximation and projections (UMAPs) visualizing Cxcl13-expressing RCs from ILNs, spleen and Peyer’s patches from naive and VSV-immunized Cxcl13-Cre/TdTomato mice after integration across SLOs and colored by SLO (b) or assigned subset identity (c). df, Immunostaining of the BFs from ILNs (d), spleen (e) and Peyer’s patches (f) from Cxcl13-Cre/TdTomato mice. Immunostaining with RANKL or MAdCAM1 demarcates MRCs, CD21/CD35 demarcates FDCs and CCL21 demarcates the T–B border region. g, Heatmap showing the average expression of signature genes across shared BRC subsets. h,i, UMAP visualization of re-embedded BRC subsets that are shared across SLOs downsampled to a maximum of 300 cells per subset of each SLO and colored by subset identity (h) and SLO (i). In b,c the scRNA-seq data represent 34,538 Cxcl13+ cells from eight independent experiments with n = 7 biological replicates for LNs, n = 7 biological replicates for the spleen and n = 5 biological replicates for Peyer’s patches. In df images are representative of at least six mice per staining and organ. In gi scRNA-seq data represent 9,572 Cxcl13+ cells (downsampled to 3,361 Cxcl13+ cells for visualization) from eight independent experiments with n = 7 biological replicates for LNs, n = 7 biological replicates for the spleen and n = 5 biological replicates for Peyer’s patches.
Fig. 3
Fig. 3. Developmental and anatomical genes imprint BRC identity.
a, Pseudobulk-level MDS plot for the visualization of sample distances colored by SLO and shaped by condition (naive or VSV-immunized). b, SLO-specific Gene Ontology (GO) terms as determined by an enrichment test based on SLO-specific genes across shared BRC subsets. c, SLO-specific gene signatures derived from enriched pathways and projected as average gene expression onto the UMAP of shared BRC subsets. In b P adjustment was performed using the Benjamini–Hochberg procedure. In ac scRNA-seq data represent 9,572 Cxcl13+ cells (downsampled to 3,361 Cxcl13+ cells for visualization) from eight independent experiments with n = 7 biological replicates for LNs, n = 7 biological replicates for the spleen and n = 5 biological replicates for Peyer’s patches.
Fig. 4
Fig. 4. Conserved molecular circuits define BRC–immune cell interaction topology.
a,b, Diffusion map of BRC subsets that are shared across SLOs colored by subset identity (a) and split by SLO (b). c, Conserved subset-specific niche factors derived from significantly enriched GO terms determined by enrichment test on subset-specific genes. d, Average gene expression of subset-specific niche factors derived from enriched pathways and projected onto the diffusion map. e, Conserved subset-specific signaling pathways derived from significantly enriched GO terms determined by enrichment tests of subset-specific genes. f, Subset-specific enriched pathways projected as the average gene expression of the indicated genes onto the diffusion map. g, Schematic representation of cell isolation and processing of immune cells for interactome analysis. h,i, UMAP visualization of immune cells from ILNs, spleen and Peyer’s patches from VSV-immunized Cxcl13-Cre/TdTomato mice colored by subset identity (h) or SLO (i). j, Heatmap with average gene expression of conserved receptor–ligand pairs as determined by CellPhoneDB analysis, reflecting niche factors provided by BRC or immune cell-provided BRC maturation cues. In c,e P adjustment was performed using the Benjamini–Hochberg procedure. In af scRNA-seq data represent 9,572 Cxcl13+ cells from eight independent experiments with n = 7 biological replicates for LNs, n = 7 biological replicates for the spleen and n = 5 biological replicates for Peyer’s patches. In h,i scRNA-seq data represent 23,250 immune cells from one independent experiment with n = 4 individual mice.
Fig. 5
Fig. 5. Leukocyte-provided maturation factors specify BRC subset identity.
a, B220 and ACTA2 immunostaining of ILNs and mesenteric LNs (MLNs) processed for spatial transcriptomics. b, Spatial expression of Cxcl13. c, Normalized weights from cell type decomposition projected onto Cxcl13+ spots. d, Dot plot visualizing the fraction of shared spots for each BRC subset with different immune cells averaged across four samples. e,f, Representative histograms (e) and quantification (f) of TdTomato expression in LinEyfp+ cells from Cxcl13-Cre/TdTomato EYFP LN fibroblast cultures 48 h after stimulation with the indicated proteins (Lin refers to CD45CD31). g, IL-6 concentration in supernatants from LN fibroblast cultures 48 h after stimulation with the indicated factors. hl, In vivo stimulation with predicted maturation cues. h,i, Flow cytometry quantification of FDC frequencies in LinPDPN+ cells (h) and ICAM1 expression in FDCs (i). j,k, Flow cytometry quantification of the frequency (j) and mean fluorescence intensity (MFI) (k) of PE–ICs on CD21/35+ cells after in vivo stimulation. l, Representative confocal microscopy images of PE–IC deposition in LNs from PBS or IL-4-treated mice. m, Schematic representation of BRC-provided niche factors and immune cell-derived BRC activation and differentiation cues. In ad spatial transcriptome analysis was performed on n = 4 LNs, with a technical replicate for each sample. In ac one representative sample is shown. In e,f data from n = 8 replicates from two independent experiments are shown. The boxplot midline demarcates the median; the box limits demarcate the upper and lower quartiles; and the whiskers depict the minimum and maximum. In g data from n = 6 replicates from two independent experiments with mean and s.d. are shown. In h,i data from n = 6 PBS-treated mice, n = 7 recombinant IL-4-treated mice, n = 6 recombinant IL-1β-treated mice and n = 4 VEGF-B-treated mice are shown (two independent experiments). In j,k data from n = 7 PBS-treated mice, n = 8 recombinant IL-4-treated mice, n = 6 recombinant IL-1β-treated mice and n = 4 VEGF-B-treated mice are shown (two independent experiments). In hk the midline of the boxplot demarcates the median; the box limits demarcate the upper and lower quartiles; the whiskers depict the minimum and maximum. In l the representatives of three mice per treatment are shown. In fk adjusted P values were derived from a Dunnett’s multiple comparison test with a 95% confidence interval using a one-way analysis of variance. m, Created with BioRender.
Fig. 6
Fig. 6. Cxcl13-Cre-provided Il6 controls TFH differentiation to sustain GC responses.
a,c,e, Representative flow cytometry plots depicting the gating of TFH cells (a), FOXP3+ TFR cells (c) and GC B cells (e) according to the indicated markers. b,d,f, Quantification of the frequency of TFH cells (b), FOXP3+ TFR cells (d) and GC B cells (f) in LNs from Cxcl13-Cre/TdTomato or Cxcl13-Cre/TdTomato Il6loxP/loxP mice 14 d after VSV infection. g, Quantification of neutralizing serum antibodies from day 14, VSV-infected Cxcl13-Cre/TdTomato or Cxcl13-Cre/TdTomato Il6loxP/loxP mice. In ag data represent three independent experiments with n = 12 Cxcl13-Cre/TdTomato mice and n = 14 Cxcl13-Cre/TdTomato Il6loxP/loxP mice. In b,d,f,g P values were computed using a two-sided, unpaired t-test. Data are presented as the mean ± s.d.
Fig. 7
Fig. 7. Cross-species conservation of BRC–immune cell circuits.
a,b, UMAP representation of CXCL13-expressing RCs from human LNs (n = 4 patients) and tonsils (n = 4 patients) colored by SLO (a) or subset identity (b). c, Heatmap showing the average expression of signature genes across BRC subsets from different organs. d, Correlation plot visualizing the cross-species similarity of BRC subsets based on the Spearman correlation of the average expression of the 400 most variable homologs. e,f, Representative confocal microscopy images of BFs from human LNs (e) and tonsillar crypts (f) immunostained for the indicated markers. The arrowheads demarcate CXCL13+ or CCL19+ cells as indicated. g, Subset-specific niche factors derived from significantly enriched GO terms determined by enrichment tests on subset-specific genes. h, Subset-specific niche factors projected as average expression of genes derived from enriched pathways onto the UMAP. i, Subset-specific signaling pathways with adjusted P values as determined by an enrichment test of differentially expressed genes between human BRC subsets. j, Heatmap showing the average expression of conserved receptor–ligand pairs derived from the CellPhoneDB analysis. In g,i P adjustment was performed using the Benjamini–Hochberg procedure. LN scRNA-seq data are representative of n = 4 patients and tonsils are representative of n = 4 patients and represent 3,450 CXCL13-expressing cells from seven independent experiments. In e,f images are representative of four human LNs and two human tonsils.
Extended Data Fig. 1
Extended Data Fig. 1. Cxcl13-Cre+ BRCs in murine SLOs.
a–c, Representative immunofluorescence images of inguinal lymph nodes (a), the spleen (b), and Peyer’s patches (c) from naïve Cxc13-Cre/TdTomato EYFP mice. Immunostaining for EYFP and TdTomato identifies Cxcl13-Cre/TdTomato transgene expression. d-f, Representative flow cytometric plots depicting the BRC gating strategy for each the inguinal lymph node (d), spleen (e), and Peyer’s pathches (f) according to the indicated markers. g-i, Representative immunofluorescence images of Cxcl13-Cre/TdTomato cells expressing CD157 in the B cell follicle (BF) of the inguinal lymph node (g), splenic white pulp (h) and Peyer’s Patches (f). The medulla (M), T cell zone (TZ), red pulp (RP) and lamina propria (LP) are demarcated. In a-c data is representative of at least 6 mice. Flow cytometric analysis in d-f is representative of n = 6 mice from 2 independent experiments. In g-i data is representative of at least 3 mice.
Extended Data Fig. 2
Extended Data Fig. 2. Transcriptomic characterization of Cxcl13+ BRCs in individual SLOs.
a, c, e UMAP visualizing Cxcl13+ reticular cells from inguinal lymph nodes (a), splenic white pulp (c) and Peyer’s Patches (e) of naïve and VSV-immunized Cxc13-Cre/TdTomato EYFP mice colored by assigned subset identity. b, d, f Heatmaps showing the average expression of signature genes used for characterization of BRC subsets in lymph nodes (b), splenic white pulp (d) and Peyer’s Patches (f). In a, b, scRNA-seq data represent 19,761 Cxcl13+ cells for n = 5 biological replicates for naive BRCs and 2 biological replicates for immunized mice from 5 independent experiments. In c, d, scRNA-seq data represent 10,361 Cxcl13+ cells for n = 4 biological replicates for naive BRCs and 3 biological replicates for immunized mice from 5 independent experiments. In e, f, scRNA-seq data represent 4,416 Cxcl13+ cells for n = 5 biological replicates from 5 independent experiments.
Extended Data Fig. 3
Extended Data Fig. 3. Contribution of inflammatory condition on BRC subset identity.
a, Ternary plot visualizing the percentage of variance in the average expression of the 2000 most variable genes explained by either subset identity, SLO or infection condition (Cond). b, c, Scatterplot comparing the average expression of genes expressed in at least 10 percent of cells within shared BRC subsets in lymph nodes (b) and splenic white pulps (c) between naïve and immunized mice. Red dots indicate differentially expressed genes with an adjusted p-value < 0.01 and an effect size (logFC) > 0.25. Dotted lines indicate a logFC of 2. In a, scRNA-seq data represents 9,572 Cxcl13+ cells from 9 independent experiments with n = 7 biological replicates for lymph nodes, n = 7 biological replicates for splenic white pulps and n = 5 biological replicates for Peyer’s Patches. b, scRNA-seq data represents 4,788 Cxcl13+ cells for n = 5 biological replicates for naive BRCs and 2 biological replicates for immunized mice from 5 independent experiments. In c, scRNA-seq data represents 3,632 Cxcl13+ cells for n = 4 biological replicates for naive BRCs and 3 biological replicates for immunized mice from 5 independent experiments. b, c, p-value adjustment was performed using Bonferoni correction.
Extended Data Fig. 4
Extended Data Fig. 4. Conserved expression of BRC-derived niche factors across SLOs.
a, Expression pattern of signaling pathways downstream of subset-specific BRC maturation cues projected as average expression across all genes from the indicated pathways onto the UMAP of shared BRC subsets. b, Representative flow cytometric plots depicting the sorting strategy of CD38+ GL7 naïve and CD38GL7+ GC B cells (i) and CD4+ and CD11b+ myeloid cells (ii) from each the inguinal lymph node, spleen, and Peyer’s patches according to the indicated markers. c, Heatmap showing the average expression of signature genes used for characterization of immune cells isolated from lymph nodes, spleen, and Peyer’s patches. d, Heatmap visualizing the average expression of receptor-ligand pairs identified as significant interactions common in all SLOs by CellPhoneDB analysis. In a, scRNA-seq data represent 9,572 Cxcl13 + cells (downsampled to 3,361 Cxcl13+ cells for visualization) from 8 independent experiments with n = 7 biological replicates for lymph nodes, n = 7 biological replicates for splenic white pulps and n = 5 biological replicates for Peyer’s Patches. In b, c, scRNA-seq data represents 23,250 immune cells from 1 independent experiment with n = 4 mice and 9,572 Cxcl13+ cells from 8 independent experiments with n = 7 biological replicates for lymph nodes, n = 7 biological replicates for splenic white pulps and n = 5 biological replicates for Peyer’s Patches.
Extended Data Fig. 5
Extended Data Fig. 5. Spatial expression of subset-specific BRC intrinsic signaling programs.
a, Spatial expression of Cxcl13 in two samples and technical replicates showing an inguinal and a mesenteric lymph node each. Sample 1 is shown as representative in Fig. 5b. b, Spatial expression of BRC intrinsic signaling signatures derived from conserved subset-specific gene expression profiles and projected on all Cxcl13+ spots within inguinal and mesenteric lymph nodes from Sample 1 shown in Fig. 5b, c.
Extended Data Fig. 6
Extended Data Fig. 6. Predicted FDC maturation cues impact immune complex binding.
a, Schematic of the experimental workflow for in vivo stimulations with predicted FDC maturation cues. Mice were s.c. injected in both flanks on three consecutive days and FDCs from both inguinal lymph nodes were analysed by flow cytometry two days after the third stimulation. b, Representative flow cytometric plots depicting the sorting strategy of CD45CD31PDPN+CD21/35+ FDCs from inguinal lymph nodes harvested following in vivo stimulations. c, Representative flow cytometry plots show the gating used for quantification of PE-IC binding by CD21/35+ cells following in vivo stimulations with FDC maturation cues.
Extended Data Fig. 7
Extended Data Fig. 7. Developmental gene signatures imprint human BRC organ-specificity.
a, b, Representative flow cytometric plots depicting the sorting strategy of non-hematopoeitic, non-endothelial cells from human lymph nodes (a) and human palatine tonsils (b) according to the indicated markers. c, Feature plots visualizing the expression of the indicated marker genes projected on the UMAP of tonsillar and lymph node BRCs. d, UMAP visualizing CXCL13+ reticular cells from human lymph nodes and palatine tonsils colored by patient identity. e, Ternary plot visualizing the percentage of variance in the average expression of the 2000 most variable genes explained by either subset identity, SLO or patient identity. f, Organ-specific GO terms with adjusted p-values as determined by enrichment test on differentially expressed genes between SLOs. g, Violin plots showing the expression of transcription factors differentially expressed between tonsillar and lymph node BRCs. In c-g, data was sampled from n = 4 patients for human lymph nodes and n = 4 patients for human palatine tonsils and represents 3,450 CXCL13+ cells. f, p-value adjustment was performed using Benjamini & Hochberg procedure.
Extended Data Fig. 8
Extended Data Fig. 8. Immune cell characterization in human lymphoid tissues.
a, b, Representative flow cytometric plots depicting the sorting strategy of CD3+ T cells, CD19+ B cells, and CD19 CD3 cells from human lymph nodes (a) and human palatine tonsils (b) according to the indicated markers. c, d, UMAPs visualizing immune cells known to be situated in and around the B cell follicle from human lymph nodes and human palatine tonsils colored by SLO (c) or assigned subset identity (d). e, Heatmap showing the average expression of signature genes characterizing human immune cells. In c-e, data represents 56,887 immune cells sampled from n = 2 patients for human lymph nodes and n = 2 patients for human palatine tonsils.
Extended Data Fig. 9
Extended Data Fig. 9. BRC-immune cell interaction circuits in human lymphoid tissues.
a, Heatmap visualizing the average expression of conserved receptor-ligand pairs identified as significant interactions in human SLOs by CellPhoneDB analysis. b, c, Fold changes of SOX9 (b) and PI16 (c) mRNA levels in bulk cultured primary tonsillar fibroblast of OSA patients stimulated with the indicated recombinant proteins for 48 h and measured by qRT-PCR. d, Fold changes of PI16 mRNA levels after in vitro expansion of sorted PI16+ RCs from human tonsils and following stimulation with TGF-β1 for 48 h. bd, Box plots with whiskers showing the minimum and maximum values. Horizontal lines indicate the median and boxes represent 0.25−0.75 percentiles (b, c) q values are derived from Tukey’s test following Kruskal-Wallis test and using Benjamini, Krieger and Yekutieli correction to control the false discovery rate. (d) Two-sided Mann Whitney test was used to test for significant differences. In a, data represent 3,450 CXCL13+ cells and 56,887 immune cells sampled from n = 4 patients for human lymph nodes and n = 4 patients for human palatine tonsils. In b, c, cells from n = 8 patients were cultivated and processed in 2 independent experiments. In d, cells from n = 5 patients were cultivated and processed in 2 independent experiments.

Comment in

References

    1. Meizlish ML, Franklin RA, Zhou X, Medzhitov R. Tissue homeostasis and inflammation. Annu. Rev. Immunol. 2021;39:557–581. doi: 10.1146/annurev-immunol-061020-053734. - DOI - PubMed
    1. Pikor NB, Cheng H-W, Onder L, Ludewig B. Development and immunological function of lymph node stromal cells. J. Immunol. 2021;206:257–263. doi: 10.4049/jimmunol.2000914. - DOI - PubMed
    1. Krishnamurty AT, Turley SJ. Lymph node stromal cells: cartographers of the immune system. Nat. Immunol. 2020;21:369–380. doi: 10.1038/s41590-020-0635-3. - DOI - PubMed
    1. Makris S, et al. Immune function and dysfunction are determined by lymphoid tissue efficacy. Dis. Model Mech. 2022;15:dmm049256. doi: 10.1242/dmm.049256. - DOI - PMC - PubMed
    1. Pikor NB, et al. Remodeling of light and dark zone follicular dendritic cells governs germinal center responses. Nat. Immunol. 2020;21:649–659. doi: 10.1038/s41590-020-0672-y. - DOI - PMC - PubMed

Publication types