. 2023 Jul;24(7):1138-1148.
doi: 10.1038/s41590-023-01502-4. Epub 2023 May 18.

PI16+ reticular cells in human palatine tonsils govern T cell activity in distinct subepithelial niches

Affiliations

PI16+ reticular cells in human palatine tonsils govern T cell activity in distinct subepithelial niches

Angelina De Martin et al. Nat Immunol. 2023 Jul.

Abstract

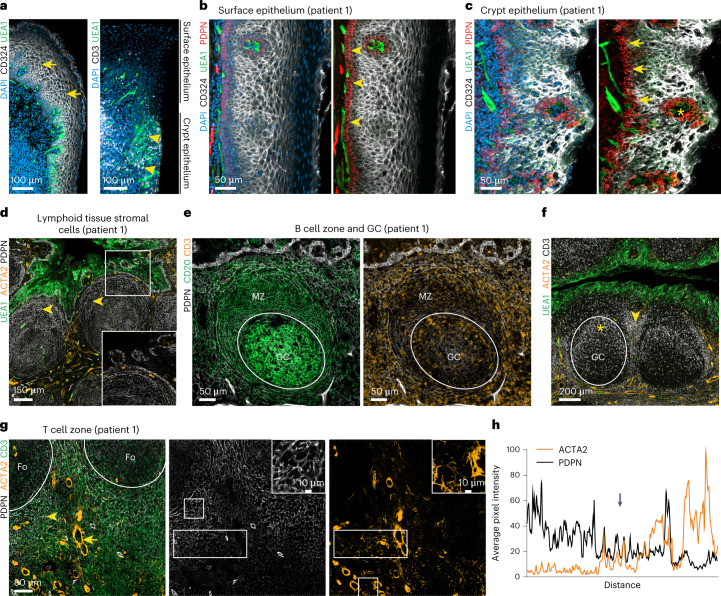
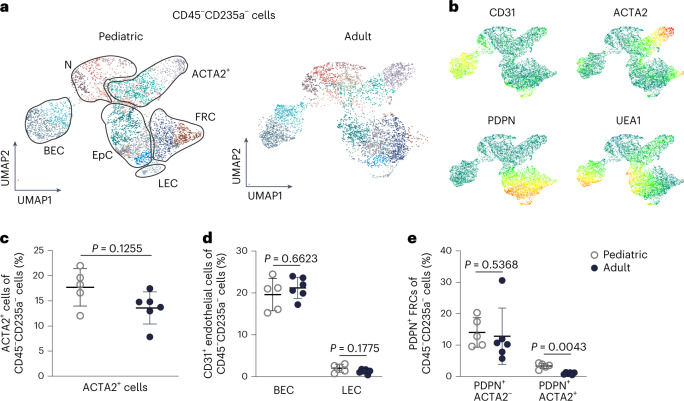
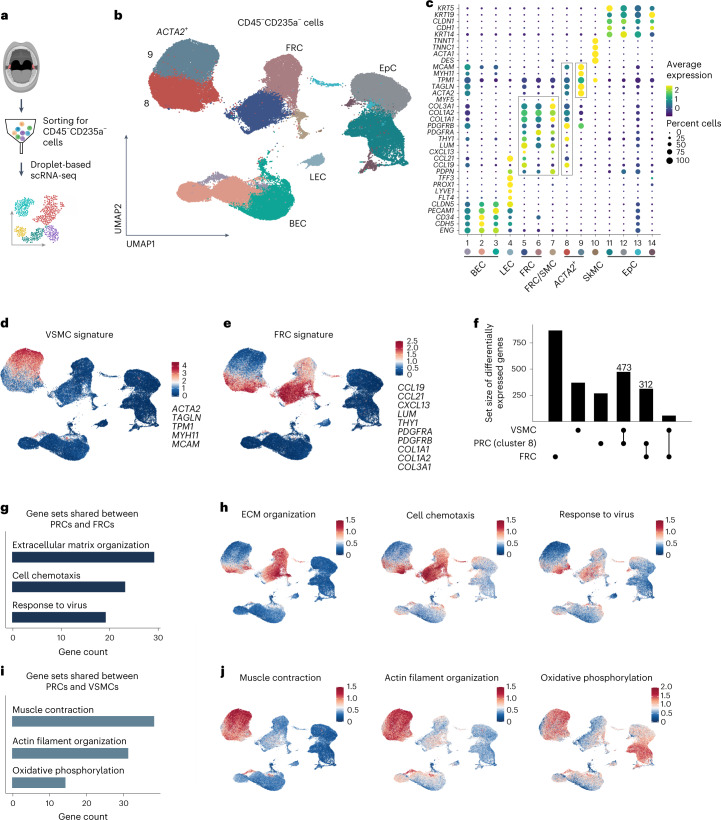
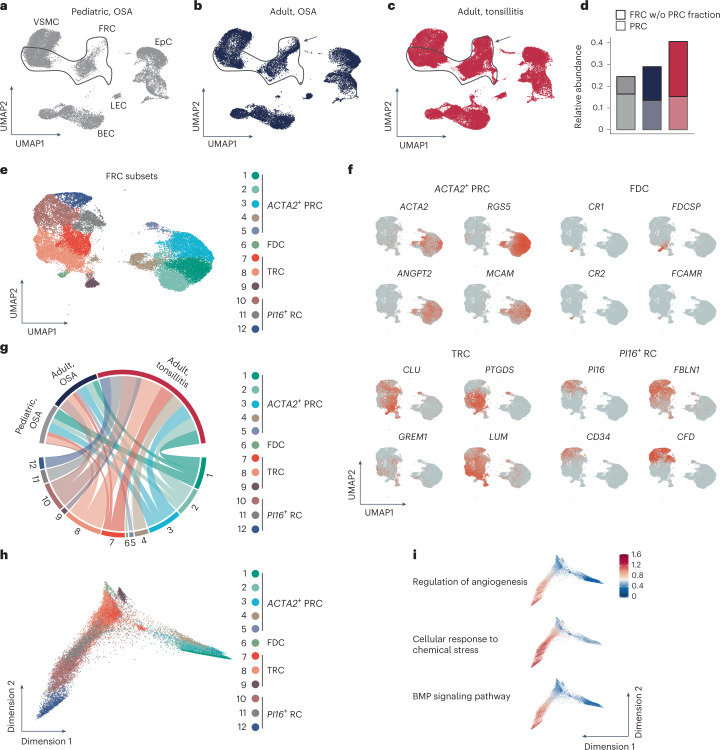
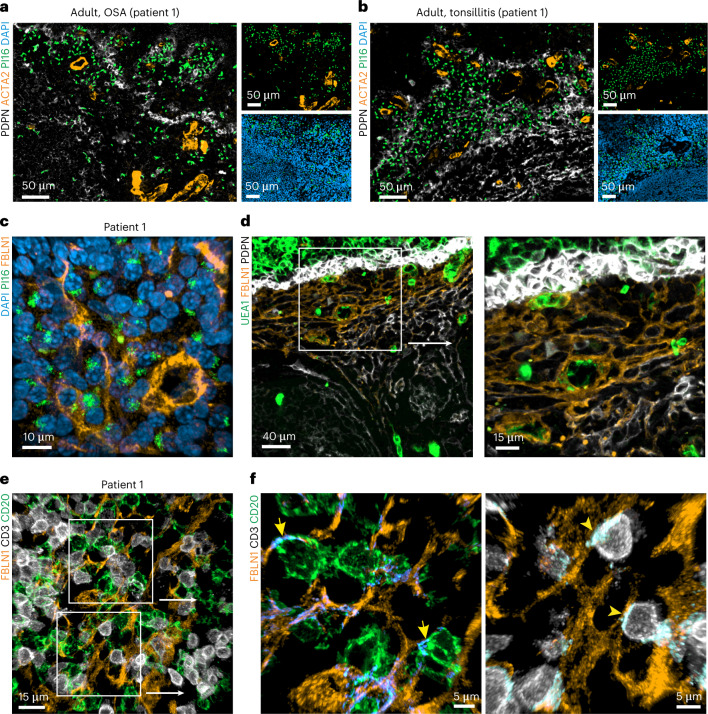
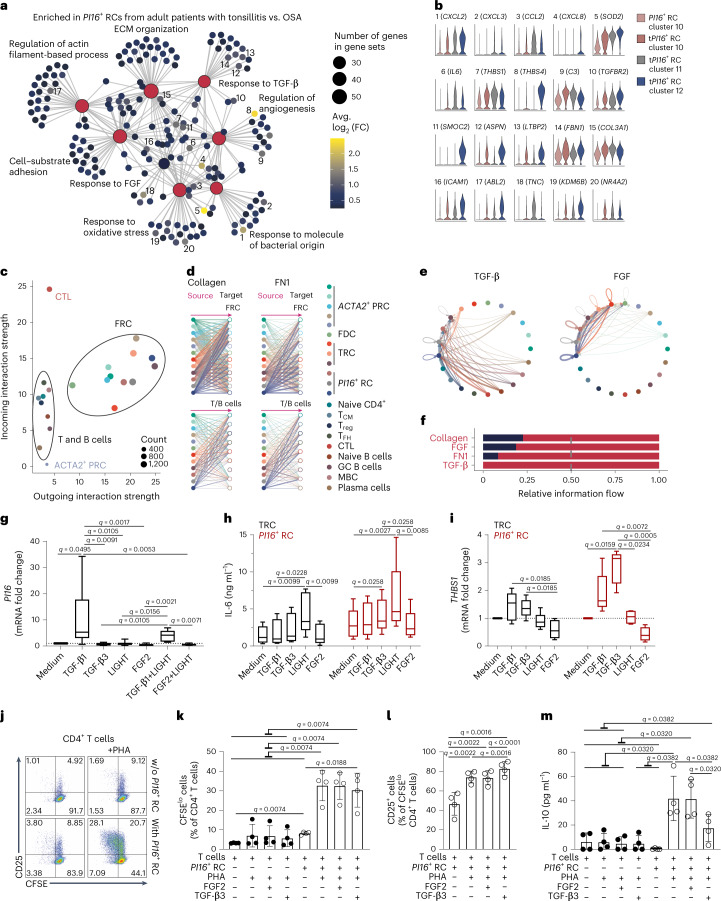
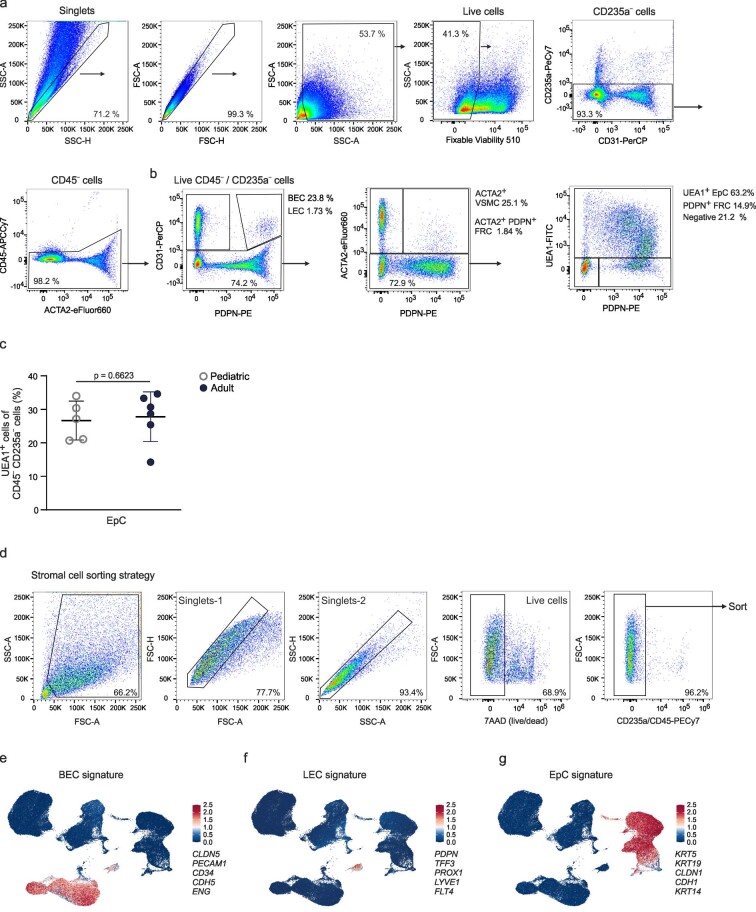
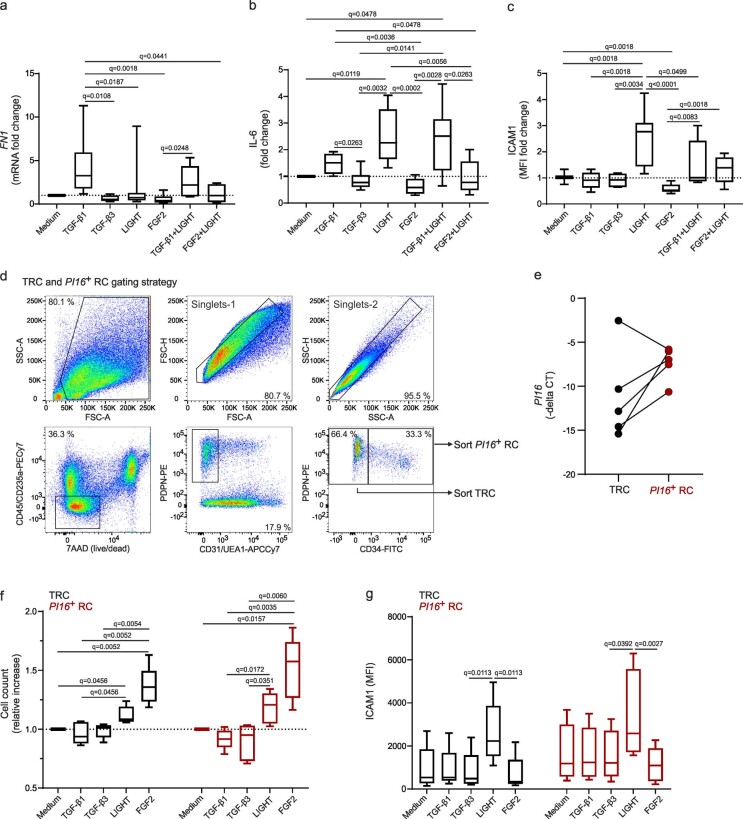
Fibroblastic reticular cells (FRCs) direct the interaction and activation of immune cells in discrete microenvironments of lymphoid organs. Despite their important role in steering innate and adaptive immunity, the age- and inflammation-associated changes in the molecular identity and functional properties of human FRCs have remained largely unknown. Here, we show that human tonsillar FRCs undergo dynamic reprogramming during life and respond vigorously to inflammatory perturbation in comparison to other stromal cell types. The peptidase inhibitor 16 (PI16)-expressing reticular cell (PI16+ RC) subset of adult tonsils exhibited the strongest inflammation-associated structural remodeling. Interactome analysis combined with ex vivo and in vitro validation revealed that T cell activity within subepithelial niches is controlled by distinct molecular pathways during PI16+ RC-lymphocyte interaction. In sum, the topological and molecular definition of the human tonsillar stromal cell landscape reveals PI16+ RCs as a specialized FRC niche at the core of mucosal immune responses in the oropharynx.


Conflict of interest statement

H.-W.C., L.O., N.B.P. and B.L. are founders and shareholders of Stromal Therapeutics. L.O. and B.L. are members of the board of Stromal Therapeutics. All other authors declare no competing interests.

Figures

Fig. 1
Fig. 1. Stromal cell topology in human palatine tonsils.
ag, Representative immunofluorescence images of palatine tonsil sections from adult patients with OSA stained with the indicated antibodies and analyzed by confocal microscopy. a, Transition zone from the surface to the crypt epithelium. Stratified squamous epithelial cells at the surface (arrows) and UEA1+ epithelial cells infiltrated with CD3+ lymphocytes (arrowheads) at the transition area to the crypt epithelium are highlighted. DAPI, 4,6-diamidino-2-phenylindole. b, High-resolution analysis of the non-keratinized stratified squamous surface epithelium. PDPN-expressing basal cuboidal epithelial cells are highlighted (arrowheads). c, Morphology of the lymphoreticular crypt epithelium. Broadened PDPN-expressing basal layer of the crypt epithelium (arrows) and papillary extension providing access for blood vessels (asterisk) are highlighted. d, Epithelial and subepithelial (arrowheads) areas underpinned by PDPN+ stromal cells. Boxed area shows the magnified epithelial–lymphoid tissue interface. e, B cell follicles with GCs and mantle zones (MZ) underpinned by PDPN+ FRCs. f, CD3+ lymphocytes in epithelial, GC (asterisk) and interfollicular T cell (arrowhead) areas. g, T cell area surrounding B cell follicles (Fo) underpinned by PDPN+ FRCs (arrowhead) and ACTA2+PDPN VSMCs (arrow). Square boxes show cell networks at higher magnification, and rectangular boxes indicate the regions of PDPN- and ACTA2-intensity measurements shown in h. h, Average pixel intensity of ACTA2 and PDPN signal-intensity measurements. The x axis represents the horizontal distance through the selection (rectangular boxes in g), and the y axis represents the vertically averaged pixel intensity. The arrow highlights ACTA2+PDPN+ myofibroblasts in the perivascular space. Microscopy images are representative for n = 3 adult patients with OSA.
Fig. 2
Fig. 2. Age-associated changes of the tonsillar stromal cell landscape.
a, Representative UMAPs of distinct tonsillar stromal cell types according to the PhenoGraph clustering algorithm based on forward scatter (FSC)-A, side scatter (SSC)-A, CD31, ACTA2, PDPN and UEA1 flow cytometry data of CD45CD235a cells (n = 3 pediatric and n = 3 adult patients with OSA). Epithelial cells (EpCs), ACTA2+ cells, BECs, LECs, FRCs and negative cells (N) are indicated. b, UMAPs show the expression pattern of the indicated markers. ce, Quantification of the indicated stromal cell types as a percentage of CD45CD235a live cells in pediatric (n = 5) and adult (n = 6) patients with OSA. Data show average values of left and right tonsils for each patient. Mean and s.d. are indicated. P values were calculated with the two-sided Mann–Whitney test.
Fig. 3
Fig. 3. Single-cell transcriptomic analysis of human palatine tonsil stromal cells.
a, Schematic representation of the scRNA-seq workflow. b, UMAP showing 14 CD45CD235a stromal cell clusters after removal of contaminating cells (Methods) including BECs, LECs, epithelial cells, ACTA2+ cells and FRCs. c, Dot plot depicts marker genes used for characterization and assignment of the indicated stromal cell types. Frames highlight marker genes of FRC clusters and the two ACTA2+ clusters (8 and 9). SMC, smooth muscle cell; SkMC, skeletal muscle cell. d,e, Expression patterns of VSMC and FRC gene signatures projected onto UMAPs. f, UpSet plot showing differentially expressed genes shared between VSMCs, PRCs in cluster 8 and FRCs. g,i, Top significantly enriched terms according to gene ontology (GO) enrichment analysis based on differentially expressed genes shared between the indicated cell types. Bar plots show counts of genes assigned to respective cellular processes. h,j, Expression patterns of genes assigned to the indicated cellular processes projected onto UMAPs. scRNA-seq data represent a total of 86,966 CD45CD235a stromal cells from n = 12 patients. ECM, extracellular matrix.
Fig. 4
Fig. 4. Age- and inflammation-related molecular changes in tonsillar FRCs.
ac, UMAPs display scRNA-seq data of tonsillar CD45CD235a stromal cells separated and colored according to different conditions. FRCs showing strong transcriptional changes are highlighted by arrows. d, Bar plot shows the relative abundance of FRCs among CD45CD235a stromal cells according to different conditions as revealed by scRNA-seq. w/o, without. e, UMAP visualization of re-embedded FRC subsets. FDC, follicular dendritic cells. f, Feature UMAPs show expression pattern of cluster marker genes used for characterization of the indicated FRC subsets. g, Chord diagram shows the proportion of cells derived from different conditions for each FRC subset. h, Diffusion map dimensionality reduction of FRC subsets. i, Top significantly enriched GO terms in PI16+ RCs according to enrichment analysis based on subset marker genes. Expression pattern of genes assigned to the indicated cellular processes is projected onto diffusion maps. BMP, bone morphogenic protein. scRNA-seq data represent a total of 86,966 CD45CD235a stromal cells and 28,571 FRCs containing 20,158 cells (4,867 FRCs) from n = 3 pediatric patients with OSA, 21,596 cells (6,184 FRCs) from n = 5 adult patients with OSA and 45,212 cells (17,520 FRCs) from n = 4 adult patients with tonsillitis.
Fig. 5
Fig. 5. Histological characterization of the PI16+ RC-underpinned subepithelial T and B cell niche.
a,b, PI16-positive cells in the subepithelial niche of tonsils from adult patients with OSA or tonsillitis. Cryosections were stained with the indicated antibodies and analyzed by confocal microscopy. c, High-resolution analysis of PI16+ cells shows intracellular PI16 signal in FBLN1+ reticular cells. Sections were stained with anti-FBLN1 and anti-PI16, and data were acquired by confocal microscopy and reconstructed in 3D. d, Morphology of the FBLN1+ subepithelial compartment in adult tonsils. Histological sections were stained with the indicated antibodies, and data were acquired and analyzed by confocal microscopy. The boxed area shows an FBLN1+ reticular network around UEA1+ endothelial cells at higher magnification on the right. e, High-resolution reconstruction of the adult subepithelial FBLN1+ FRC niche occupied by CD3+ and CD20+ lymphocytes. Sections were stained with the indicated antibodies, and data were acquired by confocal microscopy and reconstructed in 3D. f, Surface contact areas (blue) of FBLN1+ cells with CD20+ (arrows) and CD3+ (arrowheads) cells are shown at higher magnification. Microscopy images are representative for n = 3 adult patients with OSA and n = 3 adult patients with tonsillitis.
Fig. 6
Fig. 6. Interactome analysis of PI16+ RCs during homeostasis and inflammation.
a, Gene sets enriched upon inflammation based on differentially expressed genes in tonsillitis (t)PI16+ RCs compared to PI16+ RCs of patients with OSA. Numbers highlight top genes with an average log2 (fold change) (avg. log2 (FC)) > 1 assigned to enriched terms. b, Violin plots show gene expression profiles in different PI16+ RC clusters. c, Scatterplot indicates interaction strengths of individual cell subsets based on all signaling pathways derived. Dot size reflects interaction count. d, Hierarchical plots show inferred interactions of collagen and FN1 signaling networks. e, Circle plots represent inferred TGF-β and FGF signaling networks. d,e, Edge width reflects the communication probability. f, Significantly different (paired Wilcoxon test) relative information flow of signaling pathways between adult patients with OSA and tonsillitis. gi, Bulk tonsillar fibroblasts from n = 8 (medium, TGF-β1, LIGHT), n = 6 (FGF2, TGF-β1 + LIGHT) and n = 5 (TGF-β3, FGF2 + LIGHT) patients with OSA (g) or sorted TRCs and PI16+ RCs from n = 5 adult patients with OSA or tonsillitis (h,i) were stimulated with recombinant proteins for 48 h. PI16 (g) and THBS1 (i) mRNA fold change measured by quantitative PCR with reverse transcription (RT–qPCR). h, IL-6 concentration in culture supernatants. jm, Carboxyfluorescein succinimidyl ester (CFSE)-labeled T cells were cultured (3 d) with PI16+ RCs and recombinant proteins and were stimulated with PHA. j, Representative flow cytometric plots depicting CD25 expression on CFSEloCD4+ T cells. k, Quantification of CFSElo cells as a percentage of CD4+ cells. l, Quantification of CD25+ cells as a percentage of CFSEloCD4+ cells. m, IL-10 concentration in culture supernatant. gi, Box extends from 25th to 75th percentiles, median is indicated and whiskers show the minimum and maximum values. km, Mean and s.d. are indicated, n = 4 patients with OSA or tonsillitis. q values were calculated with the Kruskal–Wallis (g,i), Friedman (h) or repeated measure (RM) one-way ANOVA (km) test and Benjamini, Krieger and Yekutieli correction for multiple comparisons. Interactome analysis represents scRNA-seq data of 81,997 T and B cells from n = 2 adult patients with OSA and n = 3 adult patients with tonsillitis and 23,704 FRCs from n = 5 adult patients with OSA and n = 4 adult patients with tonsillitis. CTL, cytotoxic T lymphocytes; TCM, central memory T cells; Treg, regulatory T cells; TFH, follicular helper T cells; MBC, memory B cells.
Extended Data Fig. 1
Extended Data Fig. 1. Epithelial cell topology in human palatine tonsils.
a-f, Representative immunofluorescence images of palatine tonsil sections from adult patients with OSA stained with the indicated antibodies and analyzed by confocal microscopy. a, Structure of the palatine tonsil. UEA1 staining of the lymphoreticular epithelium highlights deep crypts permeating palatine tonsils. b,d, High resolution analysis of the non-keratinized stratified squamous surface epithelium. PDPN-expressing basal cuboidal epithelial cells are highlighted (arrowheads). c,e, Morphology of the lymphoreticular crypt epithelium. Broadened PDPN-expressing basal layer of the crypt epithelium is highlighted (arrows). f, Lymphoreticular crypt epithelium occupied by CD11c+ myeloid cells. Boxed area shows magnified intraepithelial CD11c+ cells surrounding a blood vessel (asterisk). Microscopy images are representative for n = 3 adult patients with OSA.
Extended Data Fig. 2
Extended Data Fig. 2. Lymphoid tissue stromal cell topology in human palatine tonsils.
ah, Representative immunofluorescence images of palatine tonsil sections from adult patients with OSA stained with the indicated antibodies and analyzed by confocal microscopy. a,d, Epithelial and subepithelial areas (arrowheads) underpinned by PDPN+ stromal cells. Boxed area shows magnified epithelial-lymphoid tissue interface. b,e, B cell follicles with germinal centers (GC) and mantle zones (MZ) underpinned by PDPN+ FRCs. c,f, CD3+ lymphocytes in epithelial, germinal center (asterisk) and interfollicular T cell areas (arrowhead). g,h, T cell area surrounding B cell follicles (Fo) underpinned by PDPN+ FRCs (arrowhead) and ACTA2+ PDPN VSMCs (arrow). Microscopy images are representative for n = 3 adult patients with OSA.
Extended Data Fig. 3
Extended Data Fig. 3. Flow cytometric and scRNA-seq analysis of stromal cells in human palatine tonsils.
a,b, Representative flow cytometric plots depicting the gating strategy for each stromal cell type according to the indicated markers. c, Quantification of epithelial cells (EpC) as a percentage of total CD45 CD235a live cells in pediatric (n = 5) and adult (n = 6) patients with OSA. Data show average value of left and right tonsils for each patient. Mean and s.d. are indicated. P value was calculated with the two-sided Mann-Whitney test. d, Representative flow cytometric plots depicting the sorting strategy for scRNA-seq of CD45 CD235a stromal cells from human palatine tonsils according to the indicated markers. eg, Expression patterns of indicated BEC, LEC and EpC gene signatures projected onto UMAPs. ScRNA-seq data represents a total of 86,966 CD45 CD235a stromal cells from n = 12 patients.
Extended Data Fig. 4
Extended Data Fig. 4. Age- and inflammation-related molecular changes in tonsillar stromal cells.
a, Bar plots show the relative abundance of indicated stromal cell types among CD45 CD235a cells of individual patients according to different conditions and based on scRNA-seq data. Mean and SEM are indicated. P values as per Kruskal-Wallis test. ScRNA-seq data represents a total of 86,966 CD45 CD235a stromal cells containing 20,158 cells from n = 3 pediatric patients with OSA, 21,596 cells from n = 5 adult patients with OSA and 45,212 cells from n = 4 adult patients with tonsillitis. b, UMAP showing 126,320 CD45 CD235a stromal cells from 12 patients acquired at KSSG (Kantonsspital St.Gallen, St.Gallen, Switzerland) and 3 patients independently acquired at UPENN (University of Pennsylvania, Philadelphia, USA) (see Extended Data Table 1) integrated over their origin. BECs, LECs, EpCs, ACTA2+ cells and PI16+ RCs as a fraction of FRCs are indicated. c, UMAP visualization of tonsillar stromal cells split by sample origin. d, Bar plot showing the relative abundance of PI16+ RCs among CD45 CD235a cells per condition and based on scRNAseq data. Data represents n = 5 (Pediatric,OSA), n = 6 (Adult,OSA) and n = 4 (Adult,Tonsillitis) individual patients. Mean and SEM are indicated. P values as per two-sided Wilcoxon test. e, Heatmap showing the average expression of marker genes used for characterization of FRC subsets. f, Featureplots visualizing the expression pattern of indicated cytokines and chemokines across FRCs. g, UMAP depicting re-embedded FRCs colored according to the indicated patient groups. h, Significantly enriched terms according to GO enrichment analysis based on differentially expressed genes for the indicated FRC subsets. e-h, ScRNA-seq data represents 28,571 FRCs containing 4,867 cells from n = 3 pediatric patients with OSA, 6,184 cells from n = 5 adult patients with OSA and 17,520 cells from n = 4 adult patients with tonsillitis.
Extended Data Fig. 5
Extended Data Fig. 5. Histological analysis of subepithelial PI16+ RCs.
a–d, PI16-positive cells in the subepithelial niche in tonsil sections from adult patients with OSA (a), tonsillitis (b) and pediatric patients with OSA (c, d). Cryosections were stained with indicated antibodies and analyzed by confocal microscopy. Images are representative for n = 3 (Pediatric,OSA), n = 3 (Adult,OSA) and n = 3 (Adult,Tonsillitis) patients. e–g, High-resolution microscopy images of adult PI16+ cells. Sections were stained with antibodies against FBLN1 and PI16, acquired by confocal microscopy and reconstructed in 3D. h,j, Reconstruction of the adult subepithelial FRC niche occupied by CD3+ or CD20+ lymphocytes. Sections were stained with anti-FBLN1, anti-CD3 and anti-CD20 antibodies, acquired by confocal microscopy and reconstructed in 3D. i,k, Surface contact areas (blue) of FBLN1+ cells with CD20+ (arrows) and CD3+ (arrowheads) cells are shown at higher magnification. Microscopy images in e-k are representative for n = 3 adult patients with OSA.
Extended Data Fig. 6
Extended Data Fig. 6. ScRNA-seq analysis of tonsillar TRCs and immune cells during homeostasis and inflammation.
a, Gene sets enriched in TRCs according to GO enrichment analysis based on differentially expressed genes in adult TRCs compared to pediatric TRCs. b, Gene sets enriched in TRCs upon inflammation according to GO enrichment analysis based on differentially expressed genes in TRCs between adult patients with tonsillitis and OSA. Genes with an average log2 fold change (Avg. log2 FC) > 1 assigned to enriched terms are highlighted. c-g, ScRNA-seq analysis of the human palatine tonsil T and B cell landscape. c, Representative flow cytometric plots depicting the sorting strategy of CD3+ T cells and CD19+ B cells from human palatine tonsils according to the indicated markers. UMAP visualizations show T and B cells from adult patients with OSA and tonsillitis colored according to unbiased clustering (d), condition (e), and assigned B and T cell subsets (f). g, Dot plot depicts marker genes used for characterization and assignment of T and B cell subsets. ScRNA-seq data represents a total of 81,997 T and B cells from n = 2 adult patients with OSA and n = 3 adult patients with tonsillitis. Tcm, central memory T cells; Treg, regulatory T cells; Tfh, T follicular helper cells; CTL, cytotoxic T lymphocytes; GC, germinal center; MBC, memory B cells; PC, plasma cells.
Extended Data Fig. 7
Extended Data Fig. 7. Interactome analysis of tonsillar FRCs during homeostasis and inflammation.
a,b, Heatmaps depict outgoing and incoming number of interactions (a) and interaction strengths (b) of individual cell subsets. Colored bar plots represent the sum of column (incoming signal) or row (outgoing signal) values displayed in the heatmap. c, Relative contribution of each ligand-receptor pair to the overall communication network of COLLAGEN, FN1, TGFB and FGF signaling pathways. d, Heatmaps show relative importance of each cell subset based on network centrality measures for FGF and TGFB signaling pathway networks. e-i, Heatmaps show relative importance of each cell subset based on network centrality measures for CXCL, THBS, ICAM, IL6, and LIGHT signaling pathway networks. Circle plots in the right panel show inferred signaling networks of indicated ligand-receptor pairs. Edge width reflects the communication probability. Interactome analysis represents scRNA-seq data of 81,997 T and B cells from n = 2 adult patients with OSA and n = 3 adult patients with tonsillitis and 23,704 FRCs from n = 5 (Adult,OSA) and n = 4 (Adult,Tonsillitis) patients. Tcm, central memory T cells; Treg, regulatory T cells; Tfh, T follicular helper cells; CTL, cytotoxic T lymphocytes. GC, germinal center; MBC, memory B cells.
Extended Data Fig. 8
Extended Data Fig. 8. In vitro differentiation and activation of tonsillar FRC subsets.
a–c, Bulk cultured primary tonsillar fibroblast of patients with OSA were stimulated with the indicated recombinant proteins for 48 h. a, FN1 mRNA fold change measured by quantitative PCR with reverse transcription (RT-qPCR), n = 8 (Medium, TGF-β1, LIGHT), n = 7 (FGF2), n = 6 (TGF-β1 + LIGHT, FGF2 + LIGHT) and n = 5 (TGF-β3). b, IL-6 concentration in culture supernatants. c, Flow cytometric analysis of ICAM1 surface expression displayed as fold change of mean fluorescence intensity (MFI). b,c, n = 8 (Medium, TGF-β1, LIGHT, FGF2) and n = 6 (TGF-β3, TGF-β1 + LIGHT, FGF2 + LIGHT). d, Representative flow cytometric plots depicting the sorting strategy for TRCs and PI16+ RCs from human palatine tonsils according to the indicated markers, where CD34 was used as a surrogate marker for PI16+ RCs based on the scRNA-seq analysis of tonsillar FRCs. e, PI16 mRNA expression after in vitro expansion of sorted TRCs and PI16+ RCs from n = 5 patients with OSA or tonsillitis. f,g, Sorted TRCs and PI16+ RCs from n = 5 adult patients with OSA or tonsillitis were cultured and stimulated with indicated recombinant proteins for 48 h. f, Flow cytometric analysis of relative increase in cell counts. g, Flow cytometric analysis of ICAM1 mean fluorescence intensity (MFI). a-c,f-g, Box extends from 25th to 75th percentile, median is indicated and whiskers show the minimum and maximum values. Q values were calculated with the Kruskal-Wallis (a-c,f) or Friedman (g) test and Benjamini, Krieger and Yekutieli correction for multiple comparisons.
Extended Data Fig. 9
Extended Data Fig. 9. Co-culture of PI16+ RCs with T cells.
ae, Carboxyfluorescein succinimidyl ester (CFSE)-labeled tonsillar T cells from adult patients with OSA or tonsillitis were cultured for 3 days with PI16+ RCs and indicated recombinant proteins and were stimulated with phytohemagglutinin (PHA). a, Representative flow cytometric plots depicting CD25 expression on CFSElow CD8+ T cells. b, Quantification of CFSElow cells as a percentage of CD8+ T cells. c, Quantification of CD25+ cells as a percentage of CFSElow CD8+ T cells. d, CD25 mean fluorescence intensity (MFI) fold change of CFSElow CD25+ CD4+ T cells. e, IL-6 concentration in culture supernatant. be, Mean and s.d. are indicated, n = 4 patients. Q values were calculated with the repeated measure (RM) one-way ANOVA (b, c, e) or Ordinary one-way ANOVA (d) test and Benjamini, Krieger and Yekutieli correction for multiple comparisons.

Comment in

References

    1. Junt T, Scandella E, Ludewig B. Form follows function: lymphoid tissue microarchitecture in antimicrobial immune defence. Nat. Rev. Immunol. 2008;8:764–775. doi: 10.1038/nri2414. - DOI - PubMed
    1. Buckley CD, Barone F, Nayar S, Benezech C, Caamano J. Stromal cells in chronic inflammation and tertiary lymphoid organ formation. Annu. Rev. Immunol. 2015;33:715–745. doi: 10.1146/annurev-immunol-032713-120252. - DOI - PubMed
    1. Huang JY, Lyons-Cohen MR, Gerner MY. Information flow in the spatiotemporal organization of immune responses. Immunol. Rev. 2022;306:93–107. doi: 10.1111/imr.13046. - DOI - PMC - PubMed
    1. Pikor NB, Cheng HW, Onder L, Ludewig B. Development and immunological function of lymph node stromal cells. J. Immunol. 2021;206:257–263. doi: 10.4049/jimmunol.2000914. - DOI - PubMed
    1. van de Pavert SA, Mebius RE. New insights into the development of lymphoid tissues. Nat. Rev. Immunol. 2010;10:664–674. doi: 10.1038/nri2832. - DOI - PubMed

Publication types