. 2023 May;12(5):e12315.
doi: 10.1002/jev2.12315.

Benchmarking blood collection tubes and processing intervals for extracellular vesicle performance metrics

Affiliations

Benchmarking blood collection tubes and processing intervals for extracellular vesicle performance metrics

Bert Dhondt et al. J Extracell Vesicles. 2023 May.

Abstract

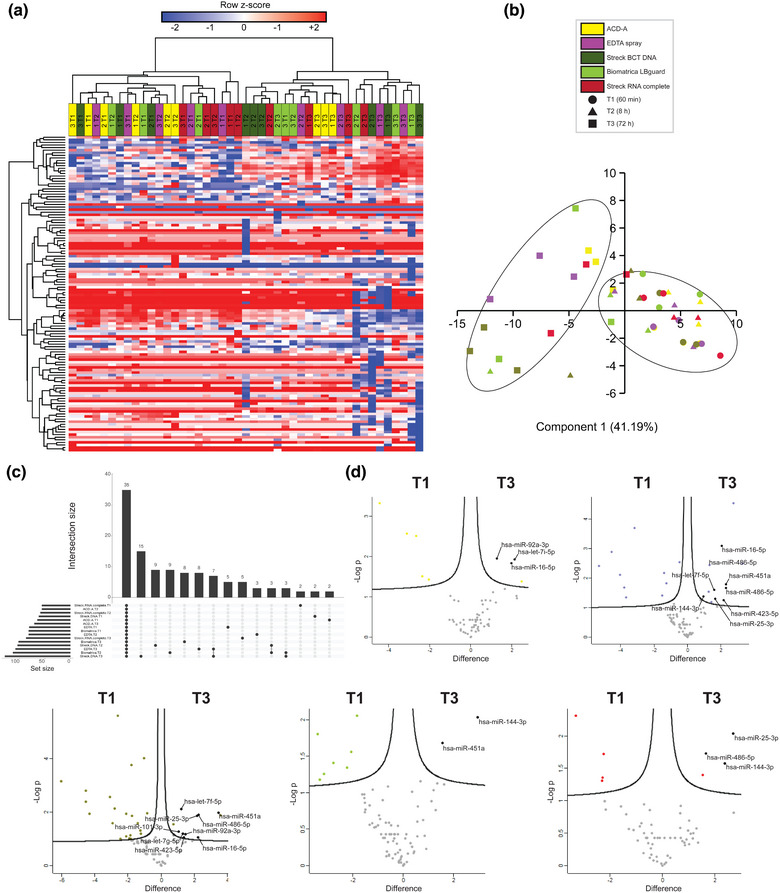
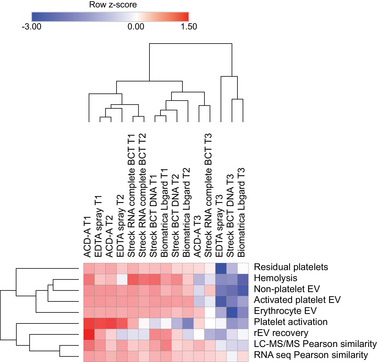
The analysis of extracellular vesicles (EV) in blood samples is under intense investigation and holds the potential to deliver clinically meaningful biomarkers for health and disease. Technical variation must be minimized to confidently assess EV-associated biomarkers, but the impact of pre-analytics on EV characteristics in blood samples remains minimally explored. We present the results from the first large-scale EV Blood Benchmarking (EVBB) study in which we systematically compared 11 blood collection tubes (BCT; six preservation and five non-preservation) and three blood processing intervals (BPI; 1, 8 and 72 h) on defined performance metrics (n = 9). The EVBB study identifies a significant impact of multiple BCT and BPI on a diverse set of metrics reflecting blood sample quality, ex-vivo generation of blood-cell derived EV, EV recovery and EV-associated molecular signatures. The results assist the informed selection of the optimal BCT and BPI for EV analysis. The proposed metrics serve as a framework to guide future research on pre-analytics and further support methodological standardization of EV studies.

Keywords: RNA sequencing; anticoagulants; biomarkers; cancer; exosomes; extracellular vesicles; plasma; preservatives; proteomics; serum.


Conflict of interest statement

Edward Geeurickx, Jo Vandesompele, Pieter Mestdagh, Olivier De Wever and An Hendrix are inventors on the patent application covering the rEV technology (WO2019091964). The remaining authors declare no competing interests.

Figures

FIGURE 1
FIGURE 1
Overview of the study design. The impact of preservation (n = 6) and non‐preservation (n = 5) BCT and BPI during blood storage at room temperature on EV stability (rEV recovery and EV morphology), sample quality (haemolysis, platelet activation, residual platelets and lipoprotein particles (presumably chylomicrons)), ex‐vivo release of blood‐cell derived EV subtypes (activated platelet EV, non‐platelet EV and erythrocyte EV) and EV omics profile (LC–MS/MS proteomics and small RNA sequencing) was evaluated. In the BCT evaluation phase of the study, the impact of 10 BCT on short‐term blood storage (T1) was assessed. Based on these experiments, performance metrics were developed to enable robust and objective comparisons between BCT. In the BPI evaluation phase of the study, a selection of 4 BCT with favourable performance characteristics, and a BCT marketed for EV preservation (*), was additionally evaluated against three clinically relevant sample processing time intervals (T1–T3) to determine the ability of BCT to stabilize EV during blood sample storage over time. The selected time points between blood draw and processing were 1 h (T1) and 8 h (T2) to mimic immediate and same day processing (short‐term stabilizing efficiency), and 72 h (T3) to assess long‐term stabilizing efficiency.
FIGURE 2
FIGURE 2
Impact of BCT type (n = 10) on EV stability a. Recovery rate (%) of recombinant EV (rEV) in EV‐enriched fractions, separated from serum and PDP by SEC, measured by fNTA following 60 min incubation in full blood at room temperature (n = 3). b. Size (nm) of recovered rEV, measured by fNTA (n = 3). Data are depicted as individual values with means. c. Left: NTA of EV‐enriched fractions, separated from serum and PDP by sequential SEC and ODG ultracentrifugation. NTA calculated size distributions are depicted as mean (black line) with standard error (red area) and mean particle size and mode are shown. Right: Transmission electron microscopy of EV‐enriched fractions (scale bar: 100 nm).
FIGURE 3
FIGURE 3
Impact of BCT type (n = 10) on sample quality and ex vivo release of blood‐cell derived EV. Analyses were performed on serum and PDP, prepared 60 min after blood draw (n = 10). Data are depicted as individual values with means. The asterisk indicates a statistically significant difference compared to the reference BCT (citrate). a. Haemolysis, quantified as haemoglobin (Hb) concentration (mg/mL), measured by colorimetric assay. b. Platelet activation, quantified as plasma concentration of platelet factor 4 (PF4) (ng/mL), measured by ELISA. c. Platelet activation, quantified as plasma concentration of beta thromboglobulin (BTG) (ng/mL), measured by ELISA. d. Total EV count, quantified as the concentration (mL−1) of particles with a refractive index < 1.42 (RI < 1.42). e. Activated platelet EV count, quantified as the concentration (mL−1) of CD61+Lac+ particles (RI < 1.42). f. Non‐platelet EV count, quantified as the concentration (mL−1) of CD61‐Lac+ particles (RI < 1.42). g. Residual platelet count, quantified as the concentration (mL−1) of CD61+ particles (SSC cross section > 300 nm2). The dotted line indicates the detection limit of a standard haematology analyser. h. Erythrocyte EV count, quantified as the concentration (mL−1) of CD235+ particles (RI < 1.42). i. Lipoprotein particle count, quantified as the concentration (mL−1) of particles with a refractive index > 1.45 (presumably chylomicrons). Particle numbers were measured by flow cytometry.
FIGURE 4
FIGURE 4
Impact of BCT type (n = 10) on EV proteome. Serum and PDP was prepared 60 min after blood draw (n = 3). Mass spectrometry proteomic analysis (LC–MS/MS) was performed on EV‐enriched fractions, separated by sequential biophysical fractionation. Proteomics data were analysed by a. Hierarchical clustering. b. Principal component analysis. Data points are coloured according to BCT. Serum (red) and Roche cfDNA (pink) clusters are indicated by coloured ellipses. c. Upset plot analysis. The total number of identified proteins in a given BCT is represented on the left bar plot. Intersections between BCT are represented by the bottom plot and their occurrence is shown on the top bar plot. d. Volcano plot analysis. Exemplary proteins of interest are highlighted in black. EV protein enrichment in the BCT of interest (n = 1) is compared to EV protein enrichment in the rest of the selected BCT (n = 9). e. The impact of haemolysis on EV‐associated proteins (Flotillin‐1, CD81) in EV‐enriched fractions, separated from plasma by SEC, was evaluated with western blot analysis.
FIGURE 5
FIGURE 5
Impact of BCT type (n = 10) on EV‐derived small RNA content. Serum and PDP was prepared 60 min after blood draw (n = 3). Small RNA sequencing was performed on EV‐enriched fractions, separated by sequential biophysical fractionation. miRNA expression data were analysed by a. Hierarchical clustering. b. Principal component analysis. Data points are coloured according to BCT. Serum (red) and Roche cfDNA (pink) clusters are indicated by coloured ellipses. c. Upset plot analysis. The total number of identified miRNA in a given BCT is represented on the left bar plot. Intersections between BCT are represented by the bottom plot and their occurrence is shown on the top bar plot. d. Volcano plot analysis. Exemplary miRNA of interest are highlighted. EV miRNA enrichment in the BCT of interest (n = 1) is compared to EV miRNA enrichment in the rest of the selected BCT (n = 9).
FIGURE 6
FIGURE 6
Overview of the impact of type of BCT on all EV performance metrics after transforming corresponding values to z‐scores. Higher z‐scores indicate better performance. Rows and columns of the heatmap are clustered according to complete hierarchical clustering based on Euclidean distance.
FIGURE 7
FIGURE 7
Impact of BPI (n = 3) on EV recovery, sample quality and ex vivo release of blood‐cell derived EV using different BCT (n = 5). Recovery analyses were performed on EV‐enriched fractions, separated from PDP by SEC, following 60 min (T1), 8 h (T2) and 72 h (T3) incubation of spiked rEV in whole blood at room temperature (n = 3). Sample quality and EV subtype analyses were performed on PDP, prepared 60 min (T1), 8 h (T2) and 72 h (T3) after blood draw (n = 5). Data are depicted as individual values with means. The asterisk indicates a statistically significant difference compared to the reference BPI (T1). a. Recovery rate (%) of recombinant EV (rEV), measured by fluorescent nanoparticle tracking analysis. b. Hemolysis, quantified as haemoglobin (Hb) concentration (mg/mL), measured by colorimetric assay. c. Platelet activation, quantified as plasma concentration of platelet factor 4 (PF4) (ng/mL), measured by ELISA. d. Platelet activation, quantified as plasma concentration of beta thromboglobulin (BTG) (ng/mL), measured by ELISA. e. Total EV count, quantified as the concentration (mL−1) of particles with a refractive index < 1.42 (RI < 1.42). f. Activated platelet EV count, quantified as the concentration (mL−1) of CD61+Lac+ particles (RI < 1.42). g. Non‐platelet EV count, quantified as the concentration (mL−1) of CD61‐Lac+ particles (RI < 1.42). g. Residual platelet count, quantified as the concentration (mL−1) of CD61+ particles (SSC cross section > 300 nm2). The dotted line indicates the detection limit of a standard haematology analyser. H. Erythrocyte EV count, quantified as the concentration (mL−1) of CD235+ particles (RI < 1.42).
FIGURE 8
FIGURE 8
Impact of BPI (60 min = T1, 8 h = T2 and 72 h = T3 after blood draw) (n = 3) on EV proteomes using different BCT (n = 5). Mass spectrometry proteomic analysis (LC‐MS/MS) was performed on EV‐enriched fractions, separated by sequential biophysical fractionation. Proteomics data were analysed by a. Hierarchical clustering. b. Principal component analysis. Data point are coloured according to BCT. Time points are indicated by a unique symbol. Clusters of interest are indicated by ellipses. c. Upset plot analysis. The total number of identified proteins in a BCT at a given BPI is represented on the left bar plot. Intersections are represented by the bottom plot and their occurrence is shown on the top bar plot. d. Volcano plot analysis. Exemplary proteins of interest are highlighted.
FIGURE 9
FIGURE 9
Impact of BPI (60 min = T1, 8 h = T2 and 72 h = T3 after blood draw) (n = 3) on EV small RNA content using different BCT (n = 5). Small RNA sequencing was performed on EV‐enriched fractions, separated by sequential biophysical fractionation. miRNA expression data were analysed by a. Hierarchical clustering. b. Principal component analysis. Data points are coloured according to BCT. Time points are indicated by a unique symbol. Clusters of interest are indicated by ellipses. c. Upset plot analysis. The total number of identified miRNA in a BCT at a given BPI is represented on the left bar plot. Intersections are represented by the bottom plot and their occurrence is shown on the top bar plot. d. Volcano plot analysis. Exemplary miRNA of interest are highlighted.
FIGURE 10
FIGURE 10
Overview of the impact of BPI using different BCT on all EV performance metrics after transforming corresponding values to z‐scores. Higher z‐scores indicate better performance. Rows and columns of the heatmap are clustered according to complete hierarchical clustering based on Euclidean distance.

References

    1. Antoniou, M. , Kolamunnage‐Dona, R. , Wason, J. , Bathia, R. , Billingham, C. , Bliss, J. M. , Brown, L. C. , Gillman, A. , Paul, J. , & Jorgensen, A. L. (2019). Biomarker‐guided trials: Challenges in practice. Contemporary Clinical Trials Communications, 16, 100493. 10.1016/j.conctc.2019.100493 - DOI - PMC - PubMed
    1. Ayers, L. , Pink, R. , Carter, D. R. F. , & Nieuwland, R. (2019). Clinical requirements for extracellular vesicle assays. Journal of Extracellular Vesicles, 8, 00. Preprint at 10.1080/20013078.2019.1593755 - DOI - PMC - PubMed
    1. Bæk, R. , Søndergaard, E. K. L. , Varming, K. , & Jørgensen, M. M. (2016). The impact of various preanalytical treatments on the phenotype of small extracellular vesicles in blood analysed by protein microarray. Journal of Immunological Methods, 438, 11–20. - PubMed
    1. Banfi, G. , Salvagno, G. L. , & Lippi, G. (2007). The role of ethylenediamine tetraacetic acid (EDTA) as in vitro anticoagulant for diagnostic purposes. Clinical Chemistry and Laboratory Medicine, 45, 565–576. - PubMed
    1. Buntsma, N. C. , Gąsecka, A. , Roos, Y. B. W. E. M. , van Leeuwen, T. G. , van der Pol, E. , & Nieuwland, R. (2021). EDTA stabilizes the concentration of platelet‐derived extracellular vesicles during blood collection and handling. Platelets, 33(5), 764–771. 10.1080/09537104.2021.1991569 - DOI - PubMed

Publication types

LinkOut - more resources