. 2023 Nov 1;25(6):662-673.
doi: 10.4103/aja202315. Epub 2023 May 16.

Low XIST expression in Sertoli cells of Klinefelter syndrome patients causes high susceptibility of these cells to an extra X chromosome

Affiliations

Low XIST expression in Sertoli cells of Klinefelter syndrome patients causes high susceptibility of these cells to an extra X chromosome

Liang-Yu Zhao et al. Asian J Androl. .

Abstract

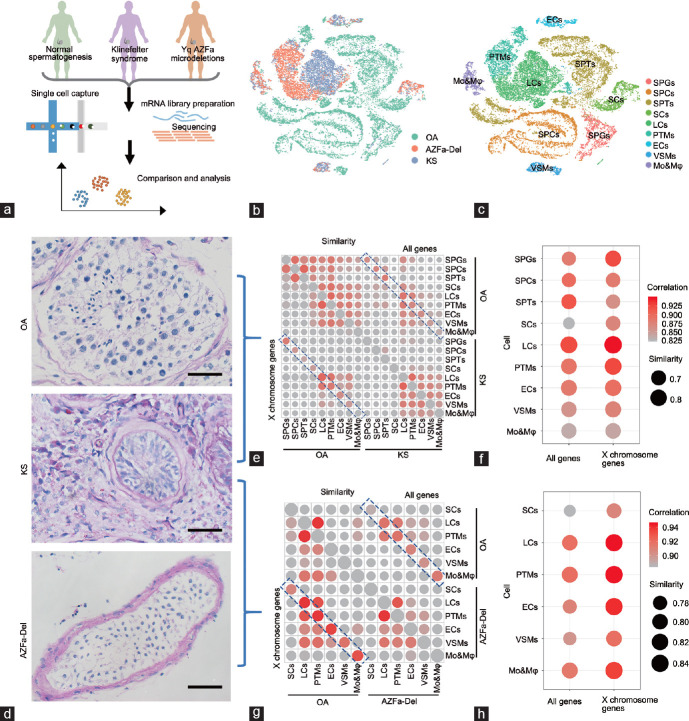
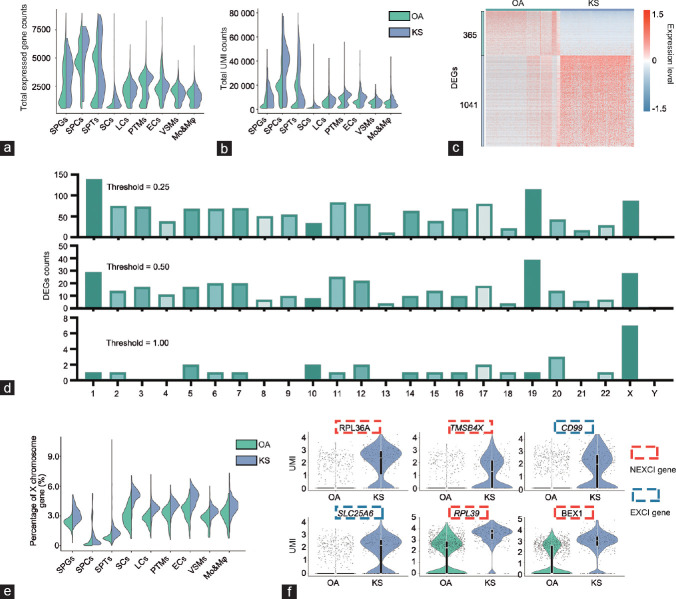
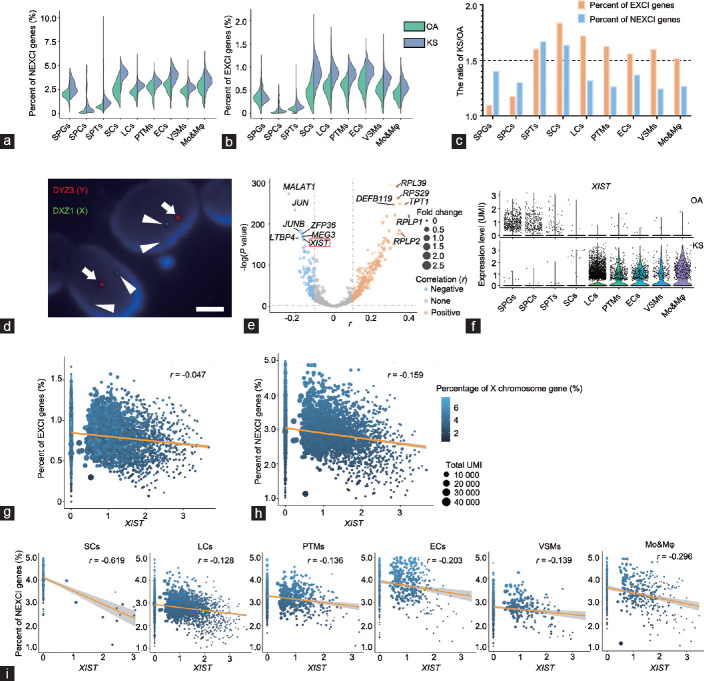
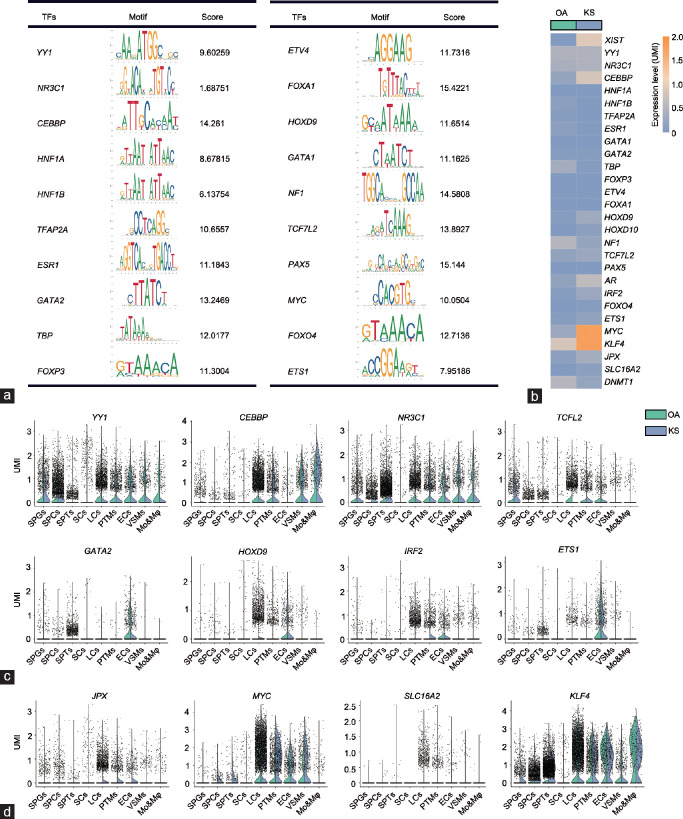
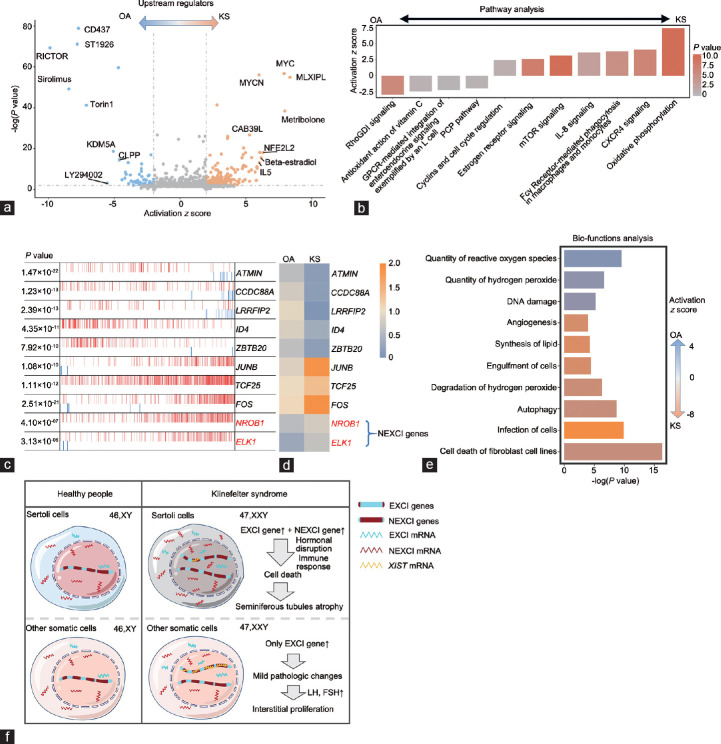
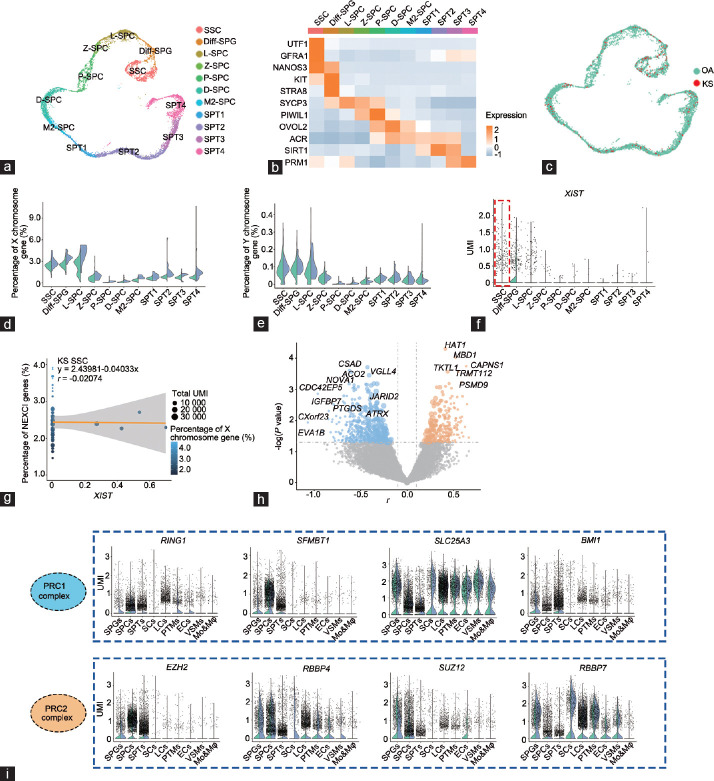
Klinefelter syndrome (KS) is the most common genetic cause of human male infertility. However, the effect of the extra X chromosome on different testicular cell types remains poorly understood. Here, we profiled testicular single-cell transcriptomes from three KS patients and normal karyotype control individuals. Among the different somatic cells, Sertoli cells showed the greatest transcriptome changes in KS patients. Further analysis showed that X-inactive-specific transcript ( XIST ), a key factor that inactivates one X chromosome in female mammals, was widely expressed in each testicular somatic cell type but not in Sertoli cells. The loss of XIST in Sertoli cells leads to an increased level of X chromosome genes, and further disrupts their transcription pattern and cellular function. This phenomenon was not detected in other somatic cells such as Leydig cells and vascular endothelial cells. These results proposed a new mechanism to explain why testicular atrophy in KS patients is heterogeneous with loss of seminiferous tubules but interstitial hyperplasia. Our study provides a theoretical basis for subsequent research and related treatment of KS by identifying Sertoli cell-specific X chromosome inactivation failure.


Conflict of interest statement

All authors declare no competing interests.

Supplementary Information is linked to the online version of the paper on the Asian Journal of Andrology website.

Figures

Figure 1
Figure 1
The global transcriptome pattern of obstructive azoospermia, Klinefelter syndrome, and AZFa-Del testes. (a) Schematic illustration of the study workflow. (b) T-distributed stochastic neighbor embedding plots of all six testicular single-cell samples. Each cell is labeled with a different color according to its sample type. (c) T-distributed stochastic neighbor embedding plots of all six testicular single-cell samples. Each cell is labeled with a different color according to its cell cluster. (d) Glycogen periodic acid–Schiff staining of OA, KS, and AZFa-Del testes illustrated typical pathological changes in their histological morphology. The scale bars represent 50 µm. (e) A bubble diagram shows the similarity between KS and OA. The size of points represents the value of Jaccard distance. The upper right half represents the result when all expressed genes are considered, and the lower left half represents the results when only X chromosome genes are considered. The colors of the points represent the regression coefficients. The size of points represents the value of Jaccard distance. The colors of the points represent the regression coefficients. (f) A bubble diagram shows an enlarged view of the contents of the blue dotted rectangle, illustrating the similarities between the same types of KS and OA cells. The size of points represents the value of Jaccard distance. The colors of the points represent the regression coefficients. (g) A bubble diagram shows the similarity between KS and AZFa-Del. The size of points represents the value of Jaccard distance. The upper right half represents the result when all expressed genes are considered, and the lower left half represents the results when only X chromosome genes are considered. The colors of the points represent the regression coefficients. The size of points represents the value of Jaccard distance. The colors of the points represent the regression coefficients. (h) A bubble diagram shows an enlarged view of the contents of the blue dotted rectangle, illustrating the similarities between the same types of KS and AZFa-Del cells. The size of points represents the value of Jaccard distance. The colors of the points represent the regression coefficients. SPGs: spermatogonia; SPCs: spermatocytes; SPT: spermatids; SCs: Sertoli cells; LCs: Leydig cells; PTMs: peritubular myoid cells; ECs: endothelial cells; VSMs: vascular smooth muscle cells; Mo&Mφ: monocyte and macrophage; OA: obstructive azoospermia; KS: Klinefelter syndrome; AZFa-Del: Y chromosome microdeletions of the AZFa regions; AZFa: azoospermia factor a.
Figure 2
Figure 2
Comparison of global and X chromosome gene expression patterns between obstructive azoospermia and Klinefelter syndrome Sertoli cells. (a) Violin plot shows the total expressed gene counts of Sertoli cells; the column is divided according to cell type, including OA and KS cells. (b) Violin plot shows the total unique molecular identifier counts of Sertoli cells; the column is divided according to cell type, including OA and KS cells. (c) Heatmap shows DEGs between OA and KS Sertoli cells. DEG counts are shown on the left of the color bar, which indicates the cell type annotation. (d) The number of DEGs between OA and KS Sertoli cells located on each chromosome under different thresholds are shown. (e) A violin plot shows the percentage of X chromosome gene expression in Sertoli cells; the column is divided into OA and KS cells. (f) Violin plot shows the expression of the top six DEGs located on the X chromosome of Sertoli cells. The color of the rectangular box represents whether this gene can escape from XCI according to a previous study on females. SPGs: spermatogonia; SPCs: spermatocytes; SPT: spermatids; SCs: Sertoli cells; LCs: Leydig cells; PTMs: peritubular myoid cells; ECs: endothelial cells; VSMs: vascular smooth muscle cells; Mo&Mφ: monocyte and macrophage; OA: obstructive azoospermia; KS: Klinefelter syndrome; XCI: X chromosome inactivation; EXCI genes: genes that escape from XCI; NEXCI genes: genes that not escape from XCI; UMI: unique molecular identifier; DEG: differentially expressed genes.
Figure 3
Figure 3
The relationship between X chromosome gene expression patterns and XIST expression levels in Klinefelter syndrome. (a) Violin plot shows the percent of NEXCI genes in Sertoli cells. The column is divided according to cell type, comparing between OA and KS samples. (b) Violin plot shows the percent of EXCI genes in Sertoli cells. The column is divided according to cell type, comparing between OA and KS samples. (c) The ratio of NEXCI gene or EXCI gene expression levels between KS and OA cells. (d) DNA-fluorescence in situ hybridization shows the karyotype of sex chromosomes of KS Sertoli cells. The long arrow indicates the DYZ3 region of the Y chromosome (labeled by red fluorescence), and the triangular arrow indicates the DXZ3 region of the X chromosome (labeled by green fluorescence). The scale bar represents 0.5 µm. (e) Volcano plot shows the correlation between NEXCI gene expression and that of each gene in all KS testicular cells. The X-axis represents the r value of the correlation coefficient. The Y-axis represents the P value. The sizes of the points represent the fold change in the gene expression level in KS cells compared with OA cells. (f) Violin plot shows the expression level of XIST in each cell cluster of OA (upper panel) or KS (lower panel) cells. (g) Regression analysis shows the correlation between XIST expression and the EXCI gene expression level in total KS somatic cells. The sizes of the points represent the total unique molecular identifier count of the cells, and the color represents the percentage of X chromosome gene expression. (h) Regression analysis shows the correlation between XIST expression and the NEXCI gene expression level in total KS somatic cells. The sizes of the points represent the total unique molecular identifier count of the cells, and the color represents the percentage of X chromosome gene expression. (i) Regression analysis shows the correlation between XIST expression and NEXCI gene expression level in different clusters of KS somatic cells. The sizes of the points represent the total unique molecular identifier count of the cells, and the color represents the percentage of X chromosome gene expression. XIST: X-inactive-specific transcript; SPGs: spermatogonia; SPCs: spermatocytes; SPT: spermatids; SCs: Sertoli cells; LCs: Leydig cells; PTMs: peritubular myoid cells; ECs: endothelial cells; VSMs: vascular smooth muscle cells; Mo&Mφ: monocyte and macrophage; OA: obstructive azoospermia; KS: Klinefelter syndrome; XCI: X chromosome inactivation; EXCI genes: genes that escape from XCI; NEXCI genes: genes that not escape from XCI; UMI: unique molecular identifier; DYZ: DYZ3 alpha satellite DNA probe corresponding to Yp11.1-q11.1 labeled with spectrumOrange; DXZ: DXZ1 alpha satellite DNA probe corresponding to Xp11.1-g11.1 labeled with spectrumGreen.
Figure 4
Figure 4
Candidate regulators of XIST. (a) Twenty candidate transcription regulators and their binding motifs within −3 kb of the transcriptional start site of the XIST gene. The score was calculated using the JASPAR dataset. (b) Heatmap showing the expression level of XIST and its regulators in OA and KS Sertoli cells. (c) A violin plot shows the expression level of XIST regulators predicted by the PROMO dataset in each cell cluster of OA and KS cells. (d) A violin plot shows the expression level of XIST regulators validated by previous studies in each cell cluster of OA and KS cells. XIST: X-inactive-specific transcript; SPGs: spermatogonia; SPCs: spermatocytes; SPT: spermatids; SCs: Sertoli cells; LCs: Leydig cells; PTMs: peritubular myoid cells; ECs: endothelial cells; VSMs: vascular smooth muscle cells; Mo&Mφ: monocyte and macrophage; OA: obstructive azoospermia; KS: Klinefelter syndrome; UMI: unique molecular identifier.
Figure 5
Figure 5
Changes in the regulatory pathway and bio-function in Klinefelter syndrome Sertoli cells. (a) Volcano plot shows upstream signaling, which may induce the differences between OA and KS Sertoli cells. (b) Ingenuity pathway analysis (IPA) pathway terms that are enriched and decreased in KS Sertoli cells are shown as a bar plot. The Y-axis represents the z score, and the red gradient indicates low-to-high P values. (c) The top 10 candidate master regulators that may induce the differences between OA and KS Sertoli cells were identified by the Master Regulator Inference Algorithm (MARINa). In the MARINa plots, activated targets are colored red, and repressed targets are colored blue for each potential master regulator (vertical lines on the X-axis). On the X-axis, genes were rank-sorted by their differential expression in OA and KS Sertoli cells from left to right. The P values on the left indicate the significance of enrichment. (d) Heatmap showing the expression levels of top 10 regulators in OA and KS Sertoli cells. (e) IPA bio-function terms enriched or decreased in KS Sertoli cells are shown as a bar plot. The X-axis represents the P value, and the gradient from orange to blue indicates KS to OA bias activation. (f) The schematic diagram shows the main pathologic changes and associated mechanism in KS somatic cells. OA: obstructive azoospermia; KS: Klinefelter syndrome; XCI: X chromosome inactivation; EXCI genes: genes that escape from XCI; NEXCI genes: genes that not escape from XCI; LH: luteinizing hormone; FSH: follicle-stimulating hormone.
Figure 6
Figure 6
The regulation of X chromosome gene expression patterns in Klinefelter syndrome germ cells. (a) T-distributed stochastic neighbor embedding plots of OA and KS germ cells. Each cell is labeled with a different color according to its cell cluster. (b) Heatmap showing the expression level of known stage-specific markers during human spermatogenesis in OA and KS germ cells. (c) T-distributed stochastic neighbor embedding plots of OA and KS germ cells. Each cell is labeled with a different color according to its sample type. (d) Violin plot shows the percentage of X chromosome gene expression levels in each germ cell subpopulation of OA and KS cells. (e) Violin plot shows the percentage of Y chromosome gene expression levels in each germ cell subpopulation of OA and KS cells. (f) Violin plot shows the XIST gene expression levels in each germ cell subpopulation of OA and KS cells. (g) Regression analysis shows the correlation between XIST expression and NEXCI gene expression levels in KS SSCs. (h) Volcano plot shows the correlation between NEXCI genes and each gene expression level in all KS SSCs. The X-axis represents the r value of the correlation coefficient. The Y-axis represents the P value. The sizes of the points represent the fold change of the gene expression level in KS cells compared with OA cells. (i) A violin plot shows the expression of the PRC1 and PRC2 complex in OA and KS germ cells. SSC: spermatogonial stem cells; Diff-SPG: differentiating or differentiated spermatogonia; L-SPC: leptotene spermatocytes; Z-SPC: zygotene spermatocytes; P-SPC: pachytene spermatocytes; D-SPC: diplotene spermatocytes; M2-SPC: secondary spermatocytes; SPT1–4: four stages of spermatids; OA: obstructive azoospermia; KS: Klinefelter syndrome; XCI: X chromosome inactivation; NEXCI genes: genes that not escape from XCI; UMI: unique molecular identifier; PRC1: polycomb repressor complex 1; XIST: X-inactive-specific transcript.

References

    1. Bojesen A, Juul S, Gravholt CH. Prenatal and postnatal prevalence of Klinefelter syndrome:a national registry study. J Clin Endocrinol Metab. 2003;88:622–6. - PubMed
    1. Aksglaede L, Skakkebaek NE, Almstrup K, Juul A. Clinical and biological parameters in 166 boys, adolescents and adults with nonmosaic Klinefelter syndrome: a Copenhagen experience. Acta Paediatr. 2011;100:793–806. - PubMed
    1. Bergère M, Wainer R, Nataf V, Bailly M, Gombault M, et al. Biopsied testis cells of four 47,XXY patients: fluorescence in-situ hybridization and ICSI results. Hum Reprod. 2002;17:32–7. - PubMed
    1. Popp C, Dean W, Feng S, Cokus SJ, Andrews S, et al. Genome-wide erasure of DNA methylation in mouse primordial germ cells is affected by AID deficiency. Nature. 2010;463:1101–5. - PMC - PubMed
    1. Handel MA. The XY body: a specialized meiotic chromatin domain. Exp Cell Res. 2004;296:57–63. - PubMed