. 2023 Oct;19(10):2639-2656.
doi: 10.1080/15548627.2023.2213984. Epub 2023 May 19.

Impaired lipophagy induced-microglial lipid droplets accumulation contributes to the buildup of TREM1 in diabetes-associated cognitive impairment

Affiliations

Impaired lipophagy induced-microglial lipid droplets accumulation contributes to the buildup of TREM1 in diabetes-associated cognitive impairment

Qing Li et al. Autophagy. 2023 Oct.

Abstract

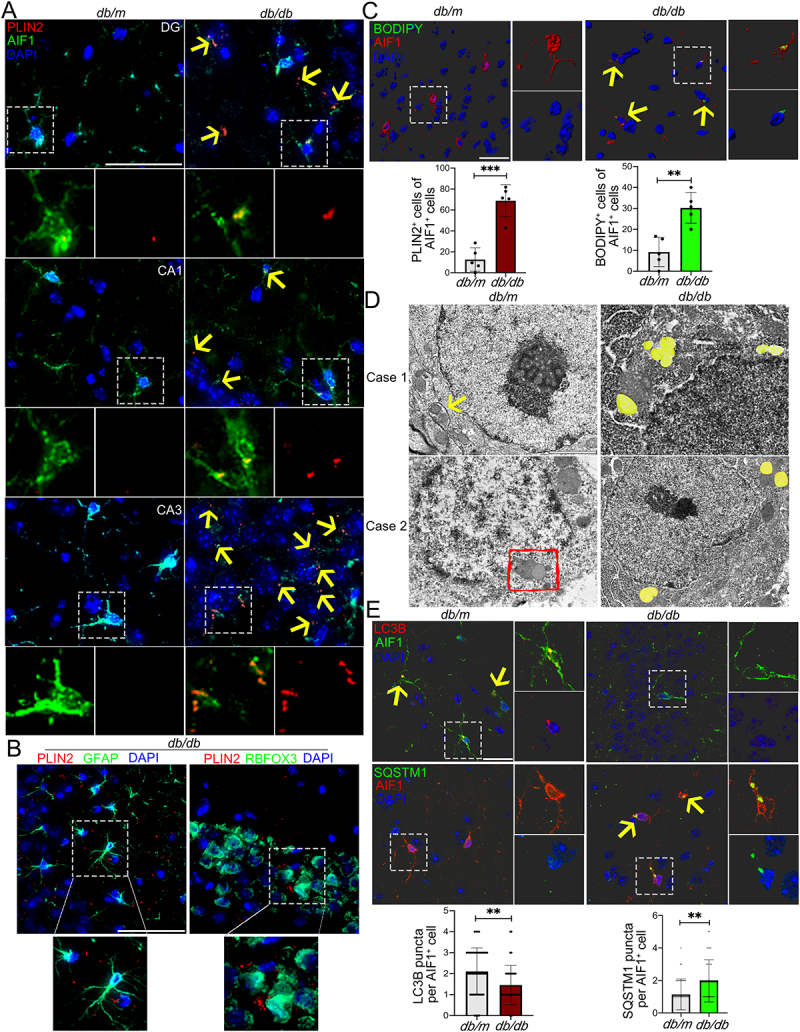
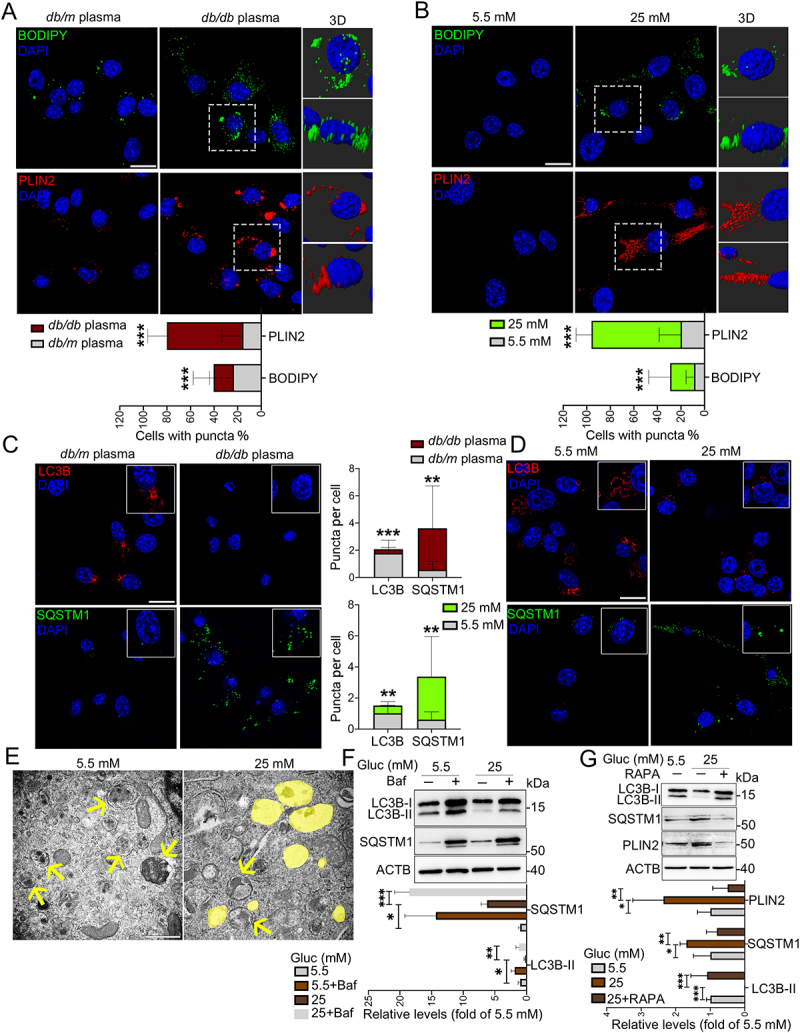
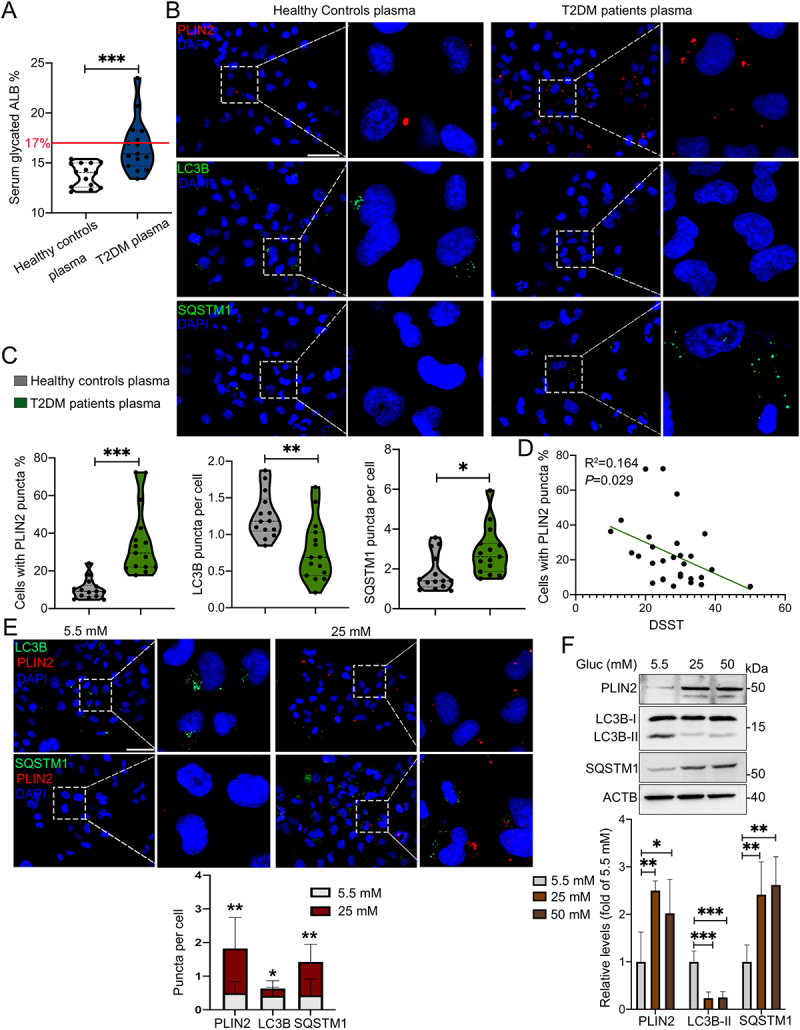
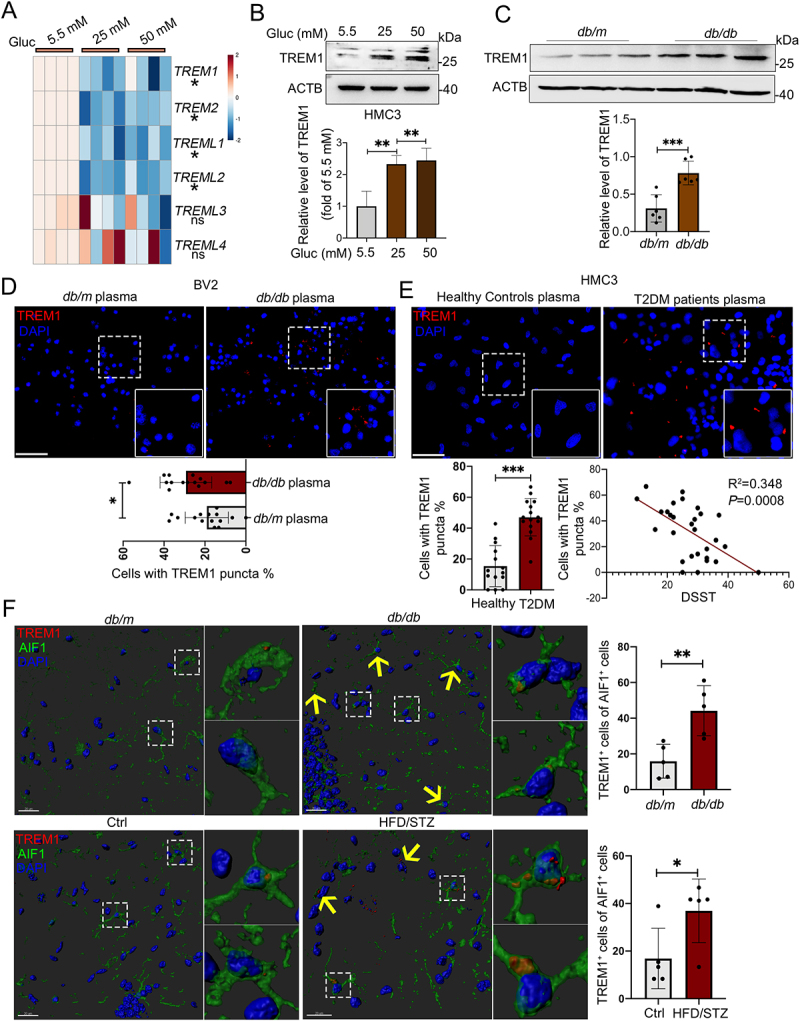
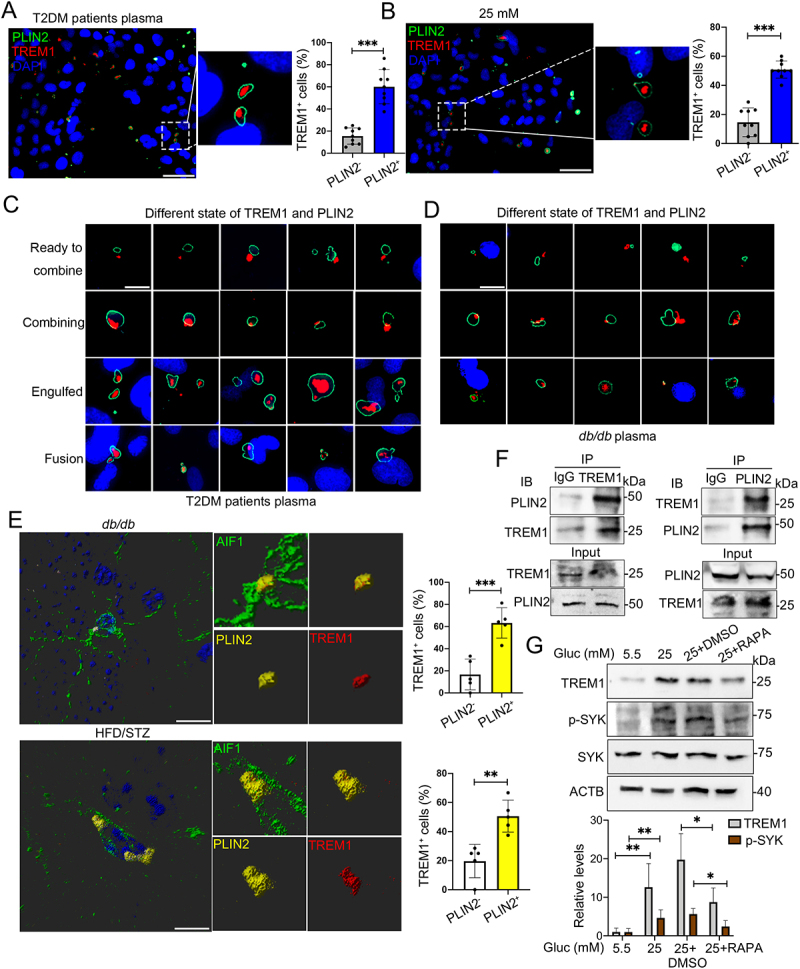
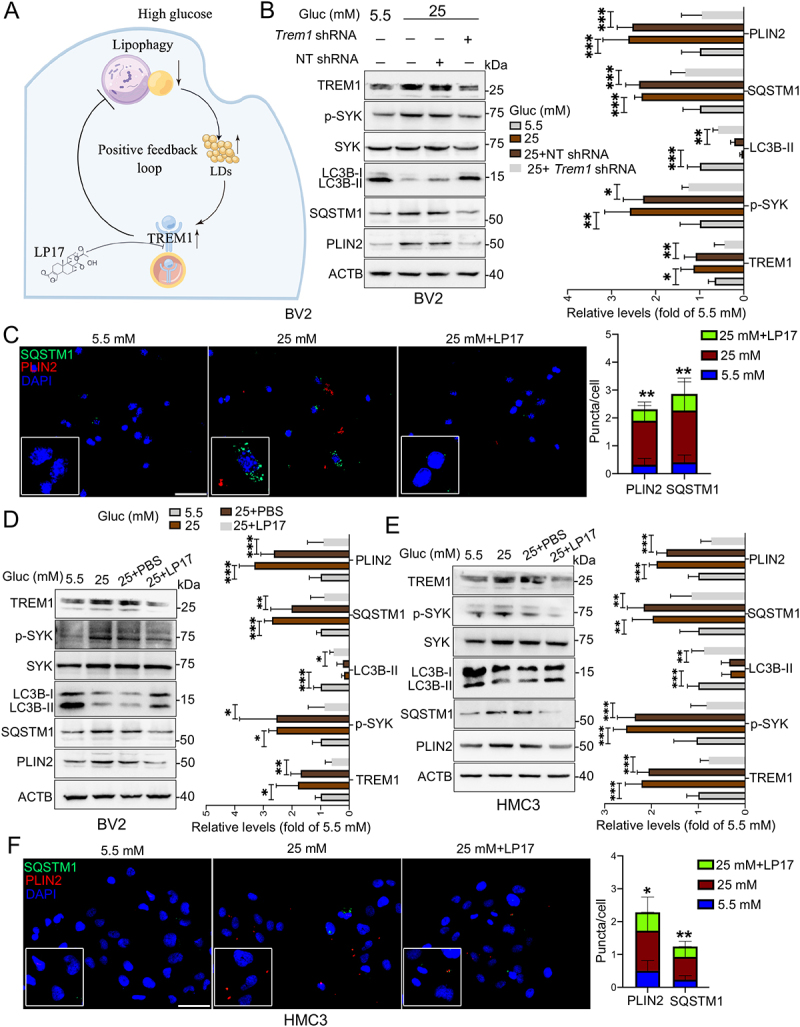
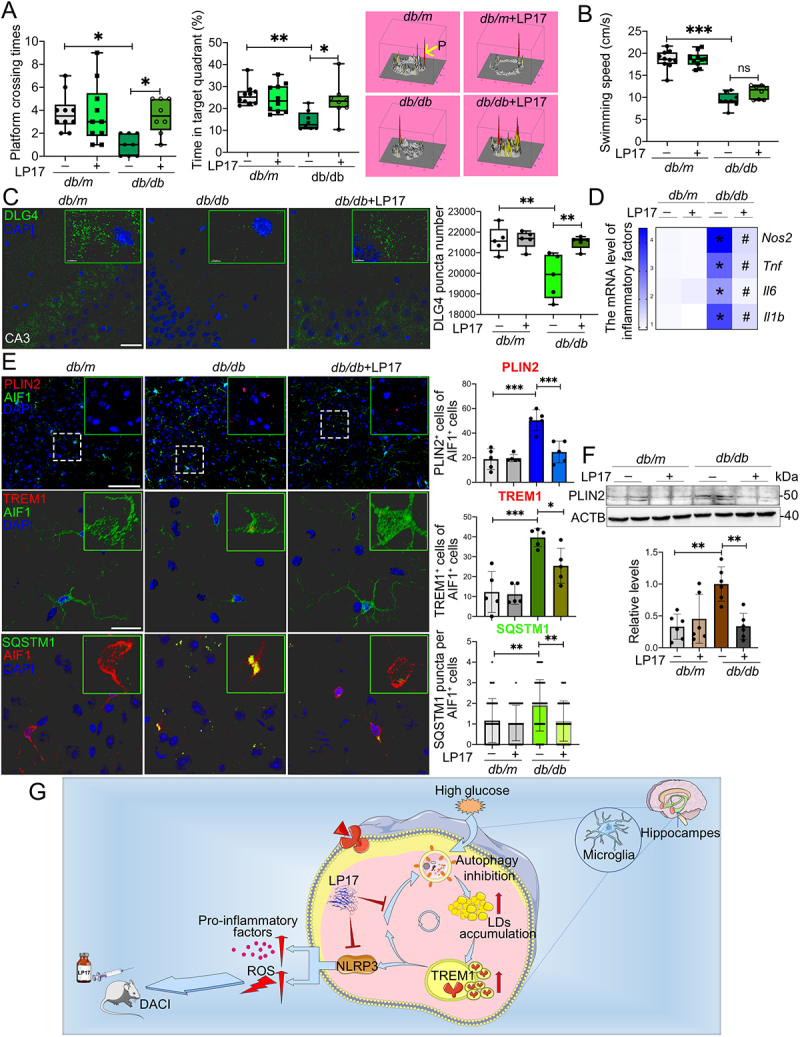
Neuroinflammation caused by microglial activation and consequent neurological impairment are prominent features of diabetes-associated cognitive impairment (DACI). Microglial lipophagy, a significant fraction of autophagy contributing to lipid homeostasis and inflammation, had mostly been ignored in DACI. Microglial lipid droplets (LDs) accumulation is a characteristic of aging, however, little is known about the pathological role of microglial lipophagy and LDs in DACI. Therefore, we hypothesized that microglial lipophagy could be an Achilles's heel exploitable to develop effective strategies for DACI therapy. Here, starting with characterization of microglial accumulation of LDs in leptin receptor-deficient (db/db) mice and in high-fat diet and STZ (HFD/STZ) induced T2DM mice, as well as in high-glucose (HG)-treated mice BV2, human HMC3 and primary mice microglia, we revealed that HG-dampened lipophagy was responsible for LDs accumulation in microglia. Mechanistically, accumulated LDs colocalized with the microglial specific inflammatory amplifier TREM1 (triggering receptor expressed on myeloid cells 1), resulting in the buildup of microglial TREM1, which in turn aggravates HG-induced lipophagy damage and subsequently promoted HG-induced neuroinflammatory cascades via NLRP3 (NLR family pyrin domain containing 3) inflammasome. Moreover, pharmacological blockade of TREM1 with LP17 in db/db mice and HFD/STZ mice inhibited accumulation of LDs and TREM1, reduced hippocampal neuronal inflammatory damage, and consequently improved cognitive functions. Taken together, these findings uncover a previously unappreciated mechanism of impaired lipophagy-induced TREM1 accumulation in microglia and neuroinflammation in DACI, suggesting its translational potential as an attractive therapeutic target for delaying diabetes-associated cognitive decline.Abbreviations: ACTB: beta actin; AIF1/IBA1: allograft inflammatory factor 1; ALB: albumin; ARG1: arginase 1; ATG3: autophagy related 3; Baf: bafilomycin A1; BECN1: beclin 1, autophagy related; BW: body weight; CNS: central nervous system; Co-IP: co-immunoprecipitation; DACI: diabetes-associated cognitive impairment; DAPI: 4',6-diamidino-2-phenylindole; DGs: dentate gyrus; DLG4/PSD95: discs large MAGUK scaffold protein 4; DMEM: Dulbecco's modified Eagle's medium; DSST: digit symbol substitution test; EDTA: ethylenedinitrilotetraacetic acid; ELISA: enzyme linked immunosorbent assay; GFAP: glial fibrillary acidic protein; HFD: high-fat diet; HG: high glucose; IFNG/IFN-γ: interferon gamma; IL1B/IL-1β: interleukin 1 beta; IL4: interleukin 4; IL6: interleukin 6; IL10: interleukin 10; LDs: lipid droplets; LPS: lipopolysaccharide; MAP2: microtubule associated protein 2; MAP1LC3B/LC3B: microtubule associated protein 1 light chain 3 beta; MWM: morris water maze; NFKB/NF-κB: nuclear factor of kappa light polypeptide gene enhancer in B cells; NLRP3: NLR family pyrin domain containing 3; NOS2/iNOS: nitric oxide synthase 2, inducible; NOR: novel object recognition; OA: oleic acid; PA: palmitic acid; PBS: phosphate-buffered saline; PFA: paraformaldehyde; PLIN2: perilipin 2; PLIN3: perilipin 3; PS: penicillin-streptomycin solution; RAPA: rapamycin; RBFOX3/NeuN: RNA binding protein, fox-1 homolog (C. elegans) 3; RELA/p65: RELA proto-oncogene, NF-kB subunit; ROS: reactive oxygen species; RT: room temperature; RT-qPCR: Reverse transcription quantitative real-time polymerase chain reaction; STZ: streptozotocin; SQSTM1/p62: sequestosome 1; SYK: spleen asociated tyrosine kinase; SYP: synaptophysin; T2DM: type 2 diabetes mellitus; TNF/TNF-α: tumor necrosis factor; TREM1: triggering receptor expressed on myeloid cells 1; TUNEL: terminal deoxynucleotidyl transferase-mediated dUTP-biotin nick end labeling.

Keywords: TREM1; hippocampus; lipid droplets; lipophagy; neuroinflammation; type 2 diabetes mellitus.


Conflict of interest statement

No potential conflict of interest was reported by the author(s).

Figures

Figure 1.
Figure 1.
Accumulation of LDs and impaired lipophagy in hippocampal microglia of db/db mice. (A) Immunostaining of PLIN2+ (LDs) and AIF1+ (microglia), and quantification of PLIN2+ microglia (yellow arrow) in the hippocampi of db/m and db/db mice. Brain tissues were analyzed from five independent experiments (n = 5 mice per group). Scale bar: 50 μm. (B) Representative 3D reconstructions of LDs in astrocyte and in neurons in CA3 region of the hippocampus of db/db mice. Scale bar: 50 μm. (C) Representative 3D reconstructions of BODIPY+ (LDs) and AIF1+ (microglia), and quantification of BODIPY+ microglia in CA3 region of hippocampus. Scale bar: 15 μm. (D) Representative electron microscope images showing autophagosome (arrow), lipophagosome (quadrangle) and LDs (yellow) in the hippocampal microglia (n = 3 mice per group). Scale bar: 1 μm. (E) Representative 3D reconstructions of microglial lipophagy and quantification of LC3B puncta and SQSTM1 puncta in the hippocampal microglia. Lipophagy was visualized using LC3B and SQSTM1, and microglia were visualized using AIF1. Scale bar: 50 μm. ** P < 0.01, *** P < 0.001.
Figure 2.
Figure 2.
HG-dampened lipophagy was responsible for the accumulation of LDs in microglia. (A and B) Immunostaining and representative Imaris 3D reconstructions of BODIPY+- and PLIN2 +-LDs in BV2 cells treated with plasma of db/m and db/db mice (A) and treated with 5.5 mM and 25 mM glucose for 72 h (B). Scale bar: 25 μm. The percent of cells with BODIPY+ puncta and PLIN2 + puncta were quantified. (C and D) Confocal images and quantifications of LC3B puncta and SQSTM1 puncta in BV2 cells treated with plasma of db/m and db/db mice (C) and treated with 5.5 mM and 25 mM glucose for 72 h (D). Scale bar: 25 μm. (E) Representative electron microscope images of autophagosome (arrow) and LDs (yellow) of BV2 cells. Scale bar: 1 μm. (F and G) Validation of LC3B-I/II, SQSTM1 and PLIN2 expressions in BV cells treated with glucose and Baf (F) or RAPA (G) via western blotting. ACTB was used as control. *P < 0.05, ** P < 0.01, *** P < 0.001.
Figure 3.
Figure 3.
Plasma of aged T2DM patients induced accumulation of LDs and inhibited lipophagy in human HMC3 cells. (A) Level of plasma glycated ALB (albumin) in healthy controls (n = 14) and T2DM patients (n = 15) (The normal reference value of serum glycated ALB is 11–17%). (B) Representative micrographs of HMC3 cells treated with plasma of healthy controls and T2DM patients. Lipophagy was both visualized using LC3B and SQSTM1, and LDs were visualized using PLIN2. Scale bar: 50 μm. (C) the number of LC3B puncta, SQSTM1 puncta and PLIN2+ cells were quantified. (D) the association between the number of PLIN2+ HMC3 cells and DSST score of all participants were analyzed. (E) Confocal images of HMC3 cells treated with glucose for 72 h. Lipophagy was both visualized using LC3B and SQSTM1, and LDs were visualized using PLIN2. The number of LC3B puncta, SQSTM1 puncta and PLIN2 puncta were quantified. Scale bar: 50 μm. (F) Validation of LC3B-I/II, SQSTM1 and PLIN2 expressions in HMC3 cells via western blotting. ACTB was used as control. *P < 0.05, ** P < 0.01, *** P < 0.001.
Figure 4.
Figure 4.
Increased protein level of TREM1 in hyperglycemic plasma or HG-cultured microglia and in the hippocampal microglia of db/db mice. (A) the mRNA expression levels of TREM and TREML receptors were analyzed by RT-Qpcr and TREM1 protein expressions was detected via western blotting (B). ACTB was used as control. (C) Western blotting analysis of TREM1 protein expressions and (D) confocal images of TREM1 in BV2 cells treated with plasma of db/db mice. Scale bar: 50 μm. (E) Confocal images of TREM1 in HMC3 cells treated with T2DM patients plasma. The number of TREM1+ cells were quantified. Scale bar: 50 μm. (F) Representative Imaris 3D reconstructions of TREM1-positive expression in IBA+ microglia of the hippocampi of db/db and HFD/STZ mice. TREM1-positive cells were quantified. Scale bar: 50 μm. *P < 0.05, ** P < 0.01, *** P < 0.001.
Figure 5.
Figure 5.
HG induced colocalization of TREM1 with LDs in microglial cells in vivo and in vitro. Representative immunostaining of TREM1 and PLIN2 in HMC3 cells cultured with plasma from T2DM patients (A) and HG (B). The number of TREM1+ cells in PLIN2 and PLIN2+ cells were quantified. Scale bar: 50 μm. (C and D) Representative micrographs of TREM1 and PLIN2 in different morphologies in HMC3 cells cultured with plasma from T2DM patients (C) and BV2 cells cultured with plasma from db/db mice (D). Scale bar: 10 μm. (E) Representative Imaris 3D reconstructions of colocalization of TREM1 and PLIN2 in the hippocampal microglia of db/db mice (upper panel) and HFD/STZ mice (lower panel). The number of TREM1+ cells in PLIN2 and PLIN2+ cells were quantified. (n = 5 mice per group, scale bar: 15 μm). (F) Co-IP validation of TREM1 and PLIN2 interaction in HMC3 cells cultured with HG. (G) Western blotting analysis of the expression of TREM1 and its downstream protein, phospho-SYK in HG and RAPA treated HMC3. ACTB was used as control. *P < 0.05, ** P < 0.01, *** P < 0.001.
Figure 6.
Figure 6.
Suppression of TREM1 reversed impairment of lipophagy and accumulation of LDs in HG-stimulated microglia. (A) Schematic diagram for HG-impaired lipophagy, accumulation of LDs and TREM1 in microglia. (B) Western blotting analysis of TREM1, phospho-SYK, LC3B-I/II, SQSTM1 and PLIN2 expressions in Trem1-specific shRNA-infected BV2 cells. *P < 0.05, ** P < 0.01, *** P < 0.001. (C) Representative micrographs of BV2 cells co-treated with glucose and LP17. Lipophagy was visualized using SQSTM1 puncta, and LDs were visualized using PLIN2 puncta. The numbers of SQSTM1 puncta and PLIN2 puncta were quantified. Scale bar: 50 μm. ** P < 0.01: 25 mM vs 25 mM + LP17. (D and E) Western blotting analysis of phospho-SYK, LC3B-I/II, SQSTM1 and PLIN2 expressions in BV2 cells (D) and HMC3 cells (E) co-treated with glucose and LP17. ACTB was used as control. *P < 0.05, ** P < 0.01, *** P < 0.001. (F) Representative micrographs of lipophagy in HMC3 cells co-treated with glucose and LP17 via immunostaining with SQSTM1 and PLIN2. The number of SQSTM1 puncta and PLIN2 puncta were quantified. Scale bar: 50 μm. *P < 0.05, ** P < 0.01: 25 mM vs 25 mM + LP17.
Figure 7.
Figure 7.
Pharmacological blockade of TREM1 in db/db model improved cognitive function, reduced hippocampal neuronal degeneration and inhibited microglial inflammation. db/m and db/db mice were administrated with or without LP17 injection. (A) Platform crossing times, time spent in the target quadrant (P, Platform) and (B) average swimming speed of the MWM test (n = 10 mice for db/m, n = 8 mice for db/db). (C) Representative Imaris reconstructions of DLG4 in hippocampus and quantification of DLG4 puncta in the hippocampus of mice from different groups. (D) mRNA expression of inflammatory factors in the hippocampus of mice from different groups. *P < 0.05: db/m vs. db/db; #P < 0.05: db/db vs. db/db + LP17. (E) Representative micrographs of PLIN2 (upper panel, scale bar: 50 μm) and representative Imaris 3D reconstructions of colocalization of TREM1 (middle panel, scale bar: 15 μm) or SQSTM1 (lower panel, scale bar: 15 μm) with AIF1 in the hippocampus of mice from different groups. The numbers of PLIN2+AIF1+, TREM1+AIF1+ and SQSTM1 puncta per AIF1+ cells were quantified. *P < 0.05, **P < 0.01, ***P < 0.001. (F) Western blotting analysis of PLIN2 expressions in the hippocampus of db/m and db/db mice with or without LP17. **P < 0.01. (G) Proposed series of events involved in HG-impaired microglia and the blockade of TREM1 pathway with LP17 administration as a new strategy for DACI therapy.

References

    1. Tinajero MG, Malik VS.. An update on the epidemiology of Type 2 diabetes: a global perspective. Endocrinol Metab Clin North Am. 2021;50(3):337–355. - PubMed
    1. Lovic D, Piperidou A, Zografou I, et al. The growing epidemic of diabetes mellitus. Curr Vasc Pharmacol. 2020;18(2):104–109. - PubMed
    1. Rojas-Carranza CA, Bustos-Cruz RH, Pino-Pinzon CJ, et al. Diabetes-related neurological implications and pharmacogenomics. Curr Pharm Des. 2018;24(15):1695–1710. - PubMed
    1. Taskinen MR. Type 2 diabetes as a lipid disorder. current Molecular medicine. 2005;5(3):297–308. - PubMed
    1. Cole JB, Florez JC. Genetics of diabetes mellitus and diabetes complications. Nat Rev Nephrol. 2020;16(7):377–390. - PMC - PubMed

Publication types

MeSH terms

Substances