. 2023 May 30;42(5):112513.
doi: 10.1016/j.celrep.2023.112513. Epub 2023 May 18.

Tissue-resident, extravascular Ly6c- monocytes are critical for inflammation in the synovium

Affiliations

Tissue-resident, extravascular Ly6c- monocytes are critical for inflammation in the synovium

Anna B Montgomery et al. Cell Rep. .

Abstract

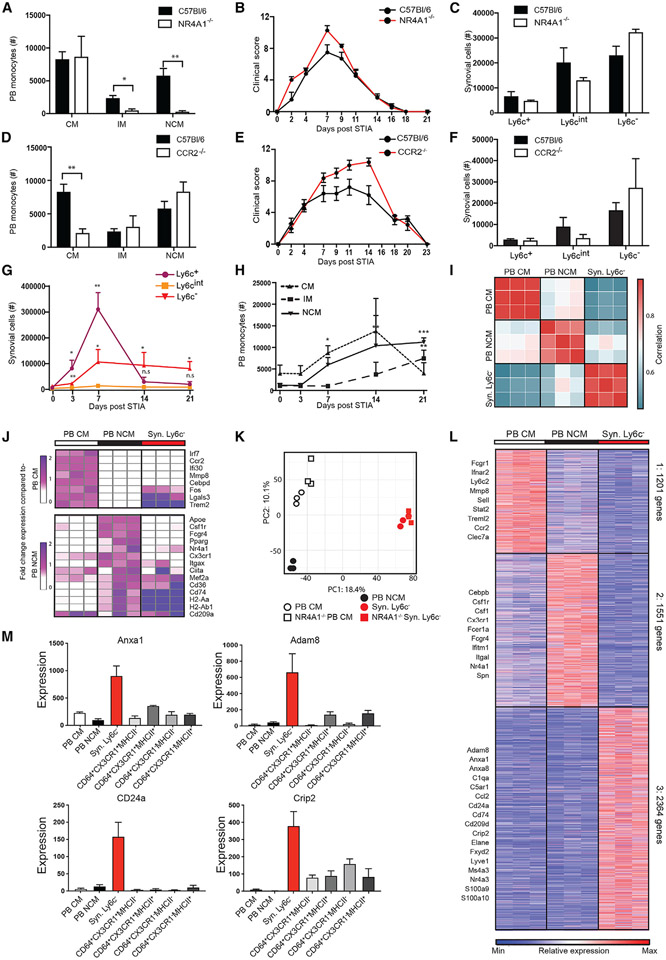
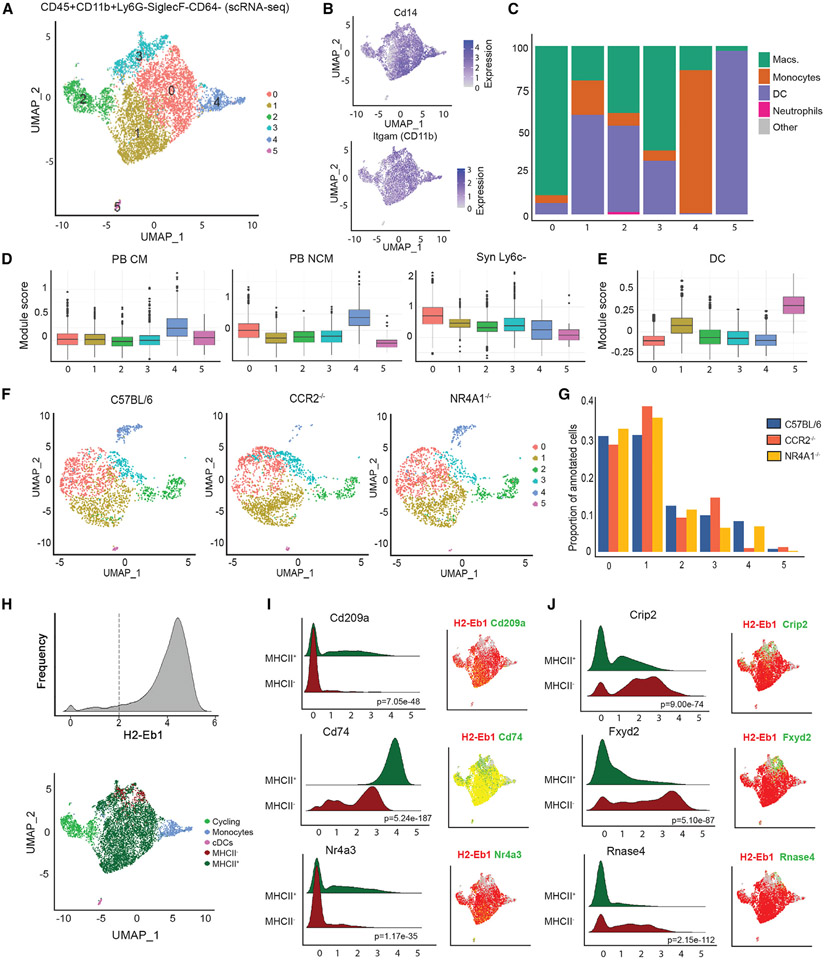
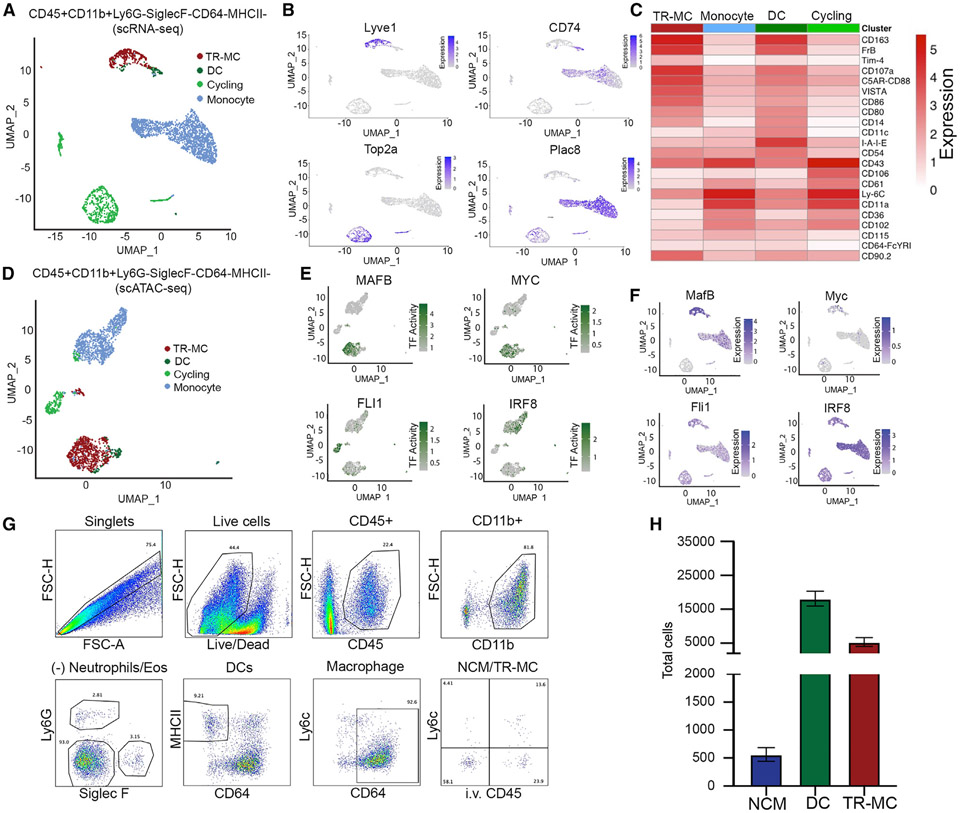
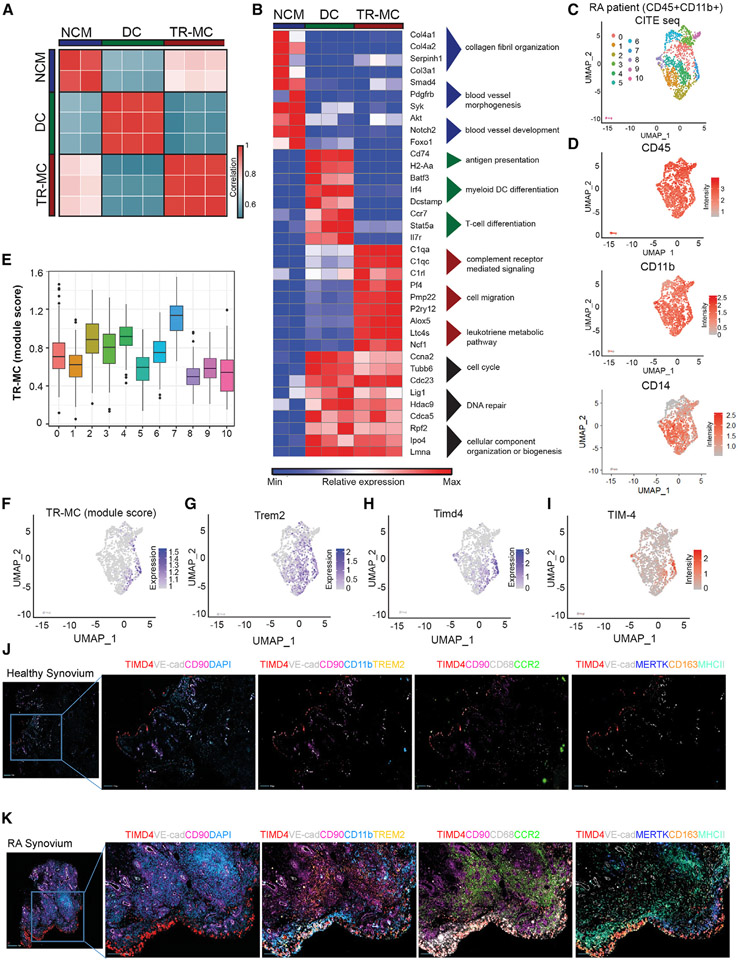
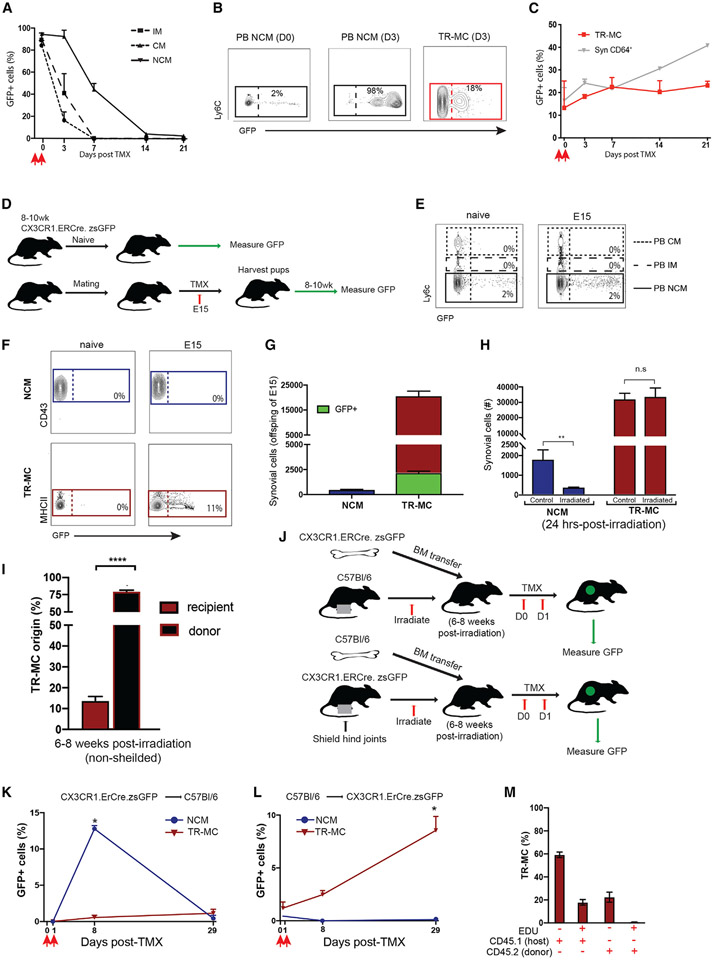
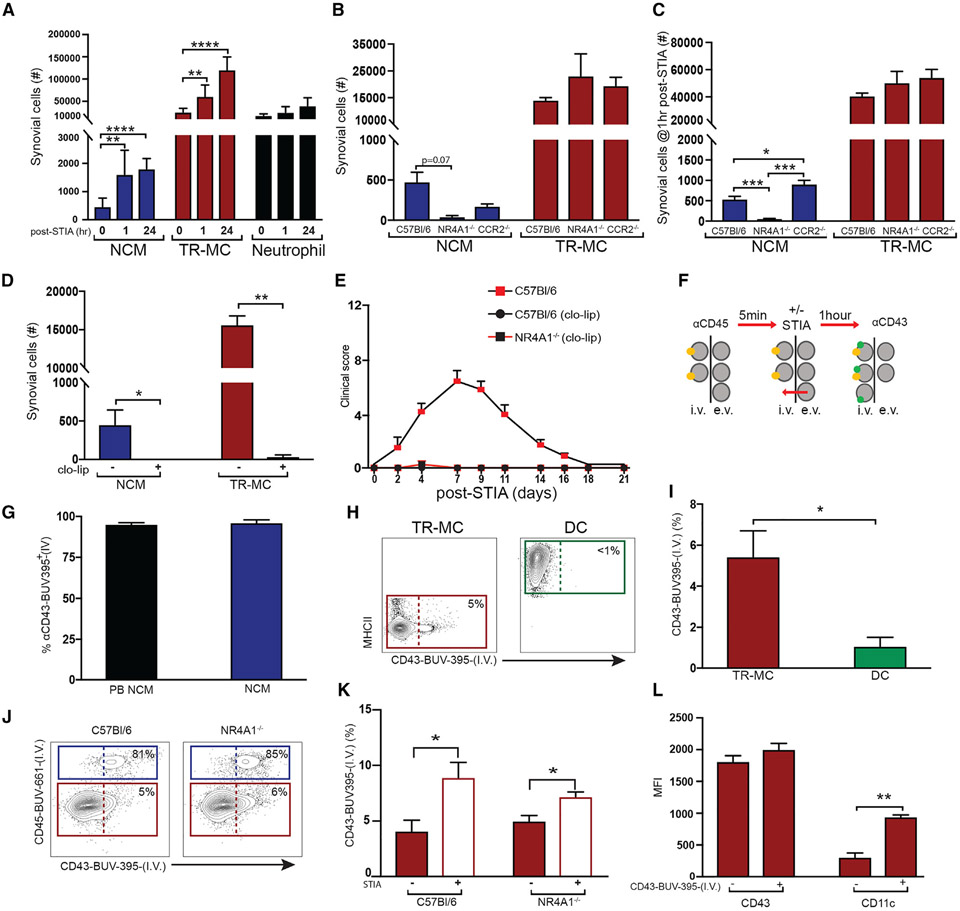
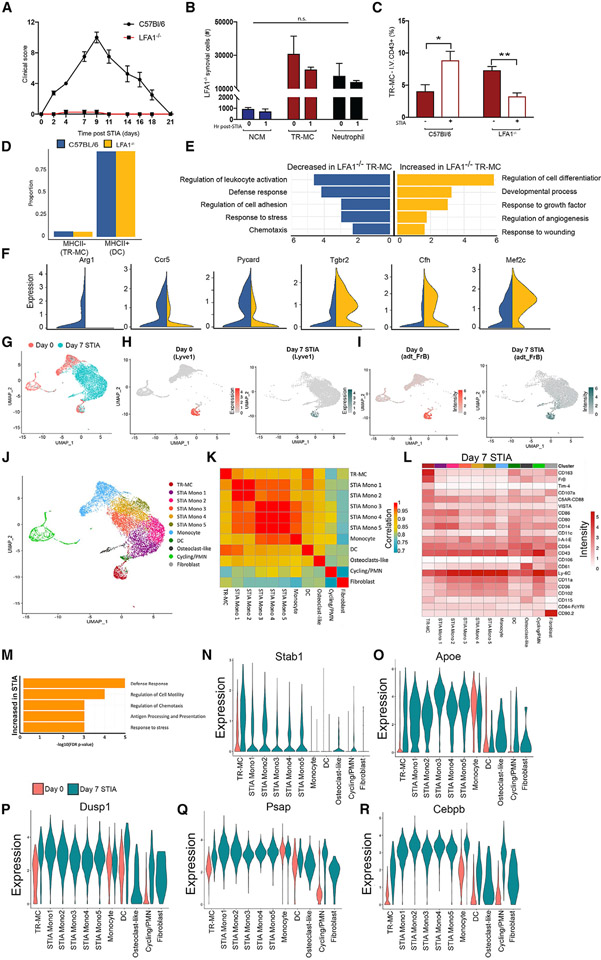
Monocytes are abundant immune cells that infiltrate inflamed organs. However, the majority of monocyte studies focus on circulating cells, rather than those in tissue. Here, we identify and characterize an intravascular synovial monocyte population resembling circulating non-classical monocytes and an extravascular tissue-resident monocyte-lineage cell (TR-MC) population distinct in surface marker and transcriptional profile from circulating monocytes, dendritic cells, and tissue macrophages that are conserved in rheumatoid arthritis (RA) patients. TR-MCs are independent of NR4A1 and CCR2, long lived, and embryonically derived. TR-MCs undergo increased proliferation and reverse diapedesis dependent on LFA1 in response to arthrogenic stimuli and are required for the development of RA-like disease. Moreover, pathways that are activated in TR-MCs at the peak of arthritis overlap with those that are downregulated in LFA1-/- TR-MCs. These findings show a facet of mononuclear cell biology that could be imperative to understanding tissue-resident myeloid cell function in RA.

Keywords: CP: Immunology; arthritis; macrophages; monoyctes.


Conflict of interest statement

Declaration of interests The authors declare no competing interests.

Figures

Figure 1.
Figure 1.. Synovial Ly6c cells are distinct from circulating NCMs
(A–F) Classical (CM), intermediate (IM), and non-classical (NCM) monocytes in the peripheral blood (PB); (B) STIA severity; and (C) Syn Ly6c+, Ly6cint, and Ly6c in C57BL/6 compared with NR4A1−/− synovium and (D–F) compared with CCR2−/−. (G and H) Changes in numbers of (G) Syn Ly6c+, Ly6cint, and Ly6c and (H) PB CMs, IMs, and NCMs during STIA. Data shown are n ≥ 4 ± SEM, *p < 0.05, **p < 0.01, ***p < 0.001. (I) Pairwise Pearson’s correlation of global gene expression between replicates of PB CMs, PB NCMs, and Syn Ly6c. (J) Fold-change expression of monocyte-associated genes from Mildner et al. compared with PB CMs or NCMs. (K) Principal component analysis (PCA) of 10,206 genes expressed by PB CMs, PB NCMs, and Syn Ly6c from C57BL/6 and NR4A1−/− mice. (L) k-means clustering of 5,115 differentially expressed genes across PB CMs, PB NCMs, and Syn Ly6c cells. (M) Mean expression of representative genes from PB CMs, PB NCMs, Syn Ly6c, and Syn macrophage (Syn Mac) populations (RNA-seq data: n = 3, error bars indicate SEM).
Figure 2.
Figure 2.. scRNA-seq analysis of joint myeloid niche identifies tissue Syn Ly6c cells
(A) Uniform manifold approximation and projection (UMAP) depicting six subpopulations of total Ly6c (CD45+CD11b+Ly6GSiglecFCD64Ly6c) cells from scRNA-seq data. (B) Expression of myeloid markers Cd14 and Itgam. (C) Percentage of cells assigned to ImmGen cell types by singleR. (D and E) Module score for scRNA-seq subpopulations representing expression of key genes in (D) PB CMs, PB NCMs, Syn Ly6c, and (E) conventional dendritic cell (cDCs). (F) Integration of scRNA-seq data on total Ly6c (CD45+CD11b+Ly6GSiglecFCD64Ly6c) cells from CCR2−/− and NR4A1−/− mice with C57BL/6 (subsampled to 2,000 cells). (G) Proportion of cells annotated as each subpopulation in C57BL/6, CCR2−/−, and NR4A1−/− mice. (H) Reclassification of cluster 2 as cycling cells, cluster 4 as monocytes, cluster 5 as cDCs, and clusters 0, 1, and 3 as MHCII+ or MHCII based on expression of H2-eb1. (I and J) Ridge plots and UMAP visualization of gene expression by MHCII compartment. The p value by Wilcoxon test is indicated.
Figure 3.
Figure 3.. Identification of intra- and extravascular Syn Ly6c cells by flow cytometry
(A) Annotation of CITE-seq data on C57BL/6 CD45+CD11b+Ly6GSiglecFCD64MHCII cells to subpopulations defined in total Syn Ly6c (CD45+CD11b+Ly6GSiglecFCD64) (Figure 2H). (B) Expression of TR-MC (Lyve1), DC (CD74), cycling (Top2a), and monocyte (Plac8) subpopulation genes. (C) Mean ADT intensity of surface markers. (D) Annotation of scATAC-seq data on C57BL/6 CD45+CD11b+Ly6GSiglecFCD64MHCII cells to subpopulations defined in total Syn Ly6c (Figure 2H). (E and F) (E) Transcription factor (TF) activity and (F) expression of corresponding genes associated with TR-MCs (MafB and MYC), cycling (Fli1), and monocyte (Irf8) subpopulations. (G) Gating strategy to distinguish intravascular NCMs vs. extravascular DCs and TR-MCs. (H) NCMs, DCs, and TR-MCs in steady state.
Figure 4.
Figure 4.. Extravascular tissue location confers phenotype of TR-MCs
(A) Pairwise Pearson’s correlation of global gene expression between replicates of NCMs, DCs, and TR-MCs. (B) Relative expression of representative genes from gene ontology (GO) processes associated with NCMs, DCs, and TR-MCs. (C) Clustering of RA patient CD45+CD11b+ synovial cells based on gene expression from CITE-seq. (D) ADT intensity of CD45, CD11b, and CD14 on RA patient synovial cells. (E and F) TR-MC module score in RA patient data. (G and H) Expression of Trem2 and Timd4 in RA patient data. (I–K) (I) ADT intensity of TIM4 in RA patient data. Immunofluorescence staining of synovial tissue from (J) healthy control and (K) RA patient.
Figure 5.
Figure 5.. TR-MCs are fetal liver derived and long lived
(A–C) GFP expression in (A) PB monocytes, (B) TR-MCs, and (C) CD64+ cells from adult CX3CR1Cre.ER.zsGFP mice treated with 50 mg/kg TMX at D0 analyzed on D1. (D) Experimental approach for lineage tracing. (E–G) Labeling of (E) PB monocytes and (F and G) NCMs and TR-MCs in adult CX3CR1Cre.ER.zsGFP without TMX, and offspring of CX3CR1Cre.ER.zsGFP mice treated with TMX on day 15 of gestation (E15). (H) Total NCMs and TR-MCs in steady state and 24 h post-non-lethal irradiation. (I) Percentage of TR-MCs in irradiated CD45.1 → CD45.2 bone marrow chimeras. (J) Experimental approach for shielded chimeras. (K and L) Percentage of GFP+ NCMs and TR-MCs in (K) CX3CR1Cre.ER.zsGFP → C57BL/6 and (L) C57BL/6 → CX3CR1Cre.ER.zsGFP 7 bone marrow chimeras 28 days after administration of 50 mg/kg TMX. (M) 5-ethynyl-2′-deoxyuridine (EdU) expression in TR-MCs 14 days post-EdU treatment in CD45.2 → CD45.1 bone marrow chimeras. All graphs are mean n > 4 + SEM; p value was calculated using unpaired t test; *p < 0.05, **p < 0.01, ****p < 0.001.
Figure 6.
Figure 6.. TR-MCs are the critical population for development of inflammatory arthritis
(A) NCMs, TR-MCs, and neutrophils at 1 and 24 h post-STIA. (B and C) NCMs and TR-MCs (B) at steady state and (C) at 1 h post-STIA in C57BL/6, NR4A1−/−, and CCR2−/− mice. (D) Depletion of NCMs and TR-MCs following 200 μL of clo-lip. (E) STIA severity induced 24 h after clo-lip treatment in C57BL/6 and NR4A1−/− mice. (F) Antibody labeling system. (G) Labeling of PB and NCM via I.V. administration of anti-CD43. (H and I) Labeling of TR-MCs and DCs with I.V. anti-CD43 after 1 h of steady state. (J and K) Labeling of NCMs and TR-MCs with anti-CD43 in C57BL/6 and NR4A1−/− (J) after 1 h of steady state and (K) 1 h after STIA. (L) Surface expression of CD43 and CD11c on I.V. αCD43-BUV395+/− TR-MCs. Graphs are mean n > 4 + SEM; p-value was calculated with unpaired t test; *p < 0.05, **p < 0.01, ***p < 0.005, ****p < 0.001.
Figure 7.
Figure 7.. Deletion of LFA1 reduced the pro-inflammatory phenotype of TR-MCs
(A) STIA clinical score in C57BL/6 and LFA1−/− mice. (B) NCMs, TR-MCs, and neutrophils 1 h post-STIA in C57BL/6 and LFA1−/− mice. (C) TR-MCs labeled with I.V. αCD43-BUV395 at steady state and 1 h post-STIA. Graphs are mean n > 4 + SEM; p value was calculated with unpaired t test; *p < 0.05, **p < 0.01. (D) Ratio of cells annotated as either MHCII (TR-MCs) or MHCII+ (DCs) in C57BL/6 and LFA1−/− mice. (E) Selected GO processes associated with differentially expressed genes in the MHCII compartment (representing TR-MCs) between LFA1−/− and C57BL/6 mice. (F) Expression of representative genes increased or decreased in MHCII cells from LFA1−/− compared with C57BL/6 mice. (G) Merged CITE-seq data on CD45+CD11b+Ly6GSiglecFCD64MHCII cells from D0 (shown in Figure 3) and D7 STIA. (H) Expression of Lyve1 (TR-MC marker) in D0 and D7 STIA. (I) ADT intensity of FrB protein in D0 and D7 STIA. (J) Annotated subpopulations from merged D0 and D7 STIA CITE-seq data based on de novo clustering and overlap with D0 annotations. (K) Pairwise Pearson’s correlation between the average expression profile at D7 STIA of annotated subpopulations. (L) Mean ADT intensity of surface markers at D7 STIA across annotated subpopulations. (M) Selected GO processes associated with genes that are increased in expression in TR-MCs at D7 STIA compared with D0. (N–R) Expression of representative genes that are increased in expression in TR-MCs at D7 STIA across clusters stratified by time point.

References

    1. Ziegler-Heitbrock L, Ancuta P, Crowe S, Dalod M, Grau V, Hart DN, Leenen PJM, Liu YJ, MacPherson G, Randolph GJ, et al. (2010). Nomenclature of monocytes and dendritic cells in blood. Blood 116, e74–e80. 10.1182/blood-2010-02-258558. - DOI - PubMed
    1. Yona S, and Jung S (2010). Monocytes: subsets, origins, fates and functions. Curr. Opin. Hematol 17, 53–59. 10.1097/MOH.0b013e3283324f80. - DOI - PubMed
    1. Guilliams M, Mildner A, and Yona S (2018). Developmental and functional heterogeneity of monocytes. Immunity 49, 595–613. - PubMed
    1. Mildner A, Schönheit J, Giladi A, David E, Lara-Astiaso D, Lorenzo-Vivas E, Paul F, Chappell-Maor L, Priller J, Leutz A, et al. (2017). Genomic characterization of murine monocytes reveals C/EBPbeta transcription factor dependence of Ly6C(−) cells. Immunity 46, 849–862.e7. 10.1016/j.immuni.2017.04.018. - DOI - PubMed
    1. Narasimhan PB, Marcovecchio P, Hamers AAJ, and Hedrick CC (2019). Nonclassical monocytes in health and disease. Annu. Rev. Immunol. 37, 439–456. 10.1146/annurev-immunol-042617-053119. - DOI - PubMed

Publication types